. 2017 May;22(5):680-688.
doi: 10.1038/mp.2017.1. Epub 2017 Feb 14.

Genetic Otx2 mis-localization delays critical period plasticity across brain regions

Affiliations

Genetic Otx2 mis-localization delays critical period plasticity across brain regions

H H C Lee et al. Mol Psychiatry. 2017 May.

Erratum in

Abstract

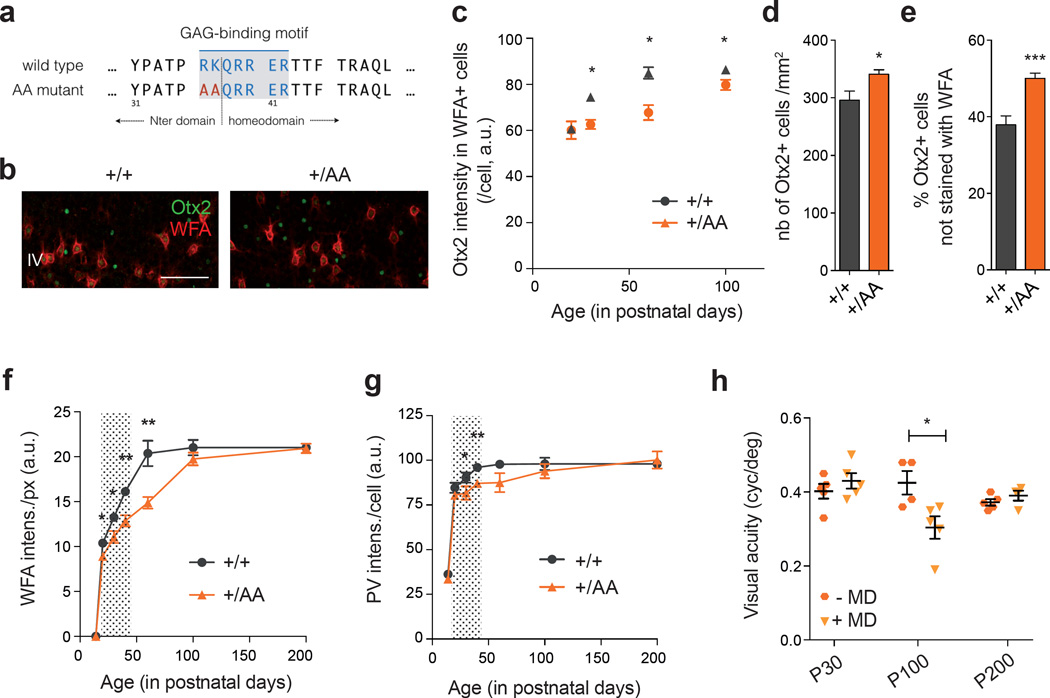
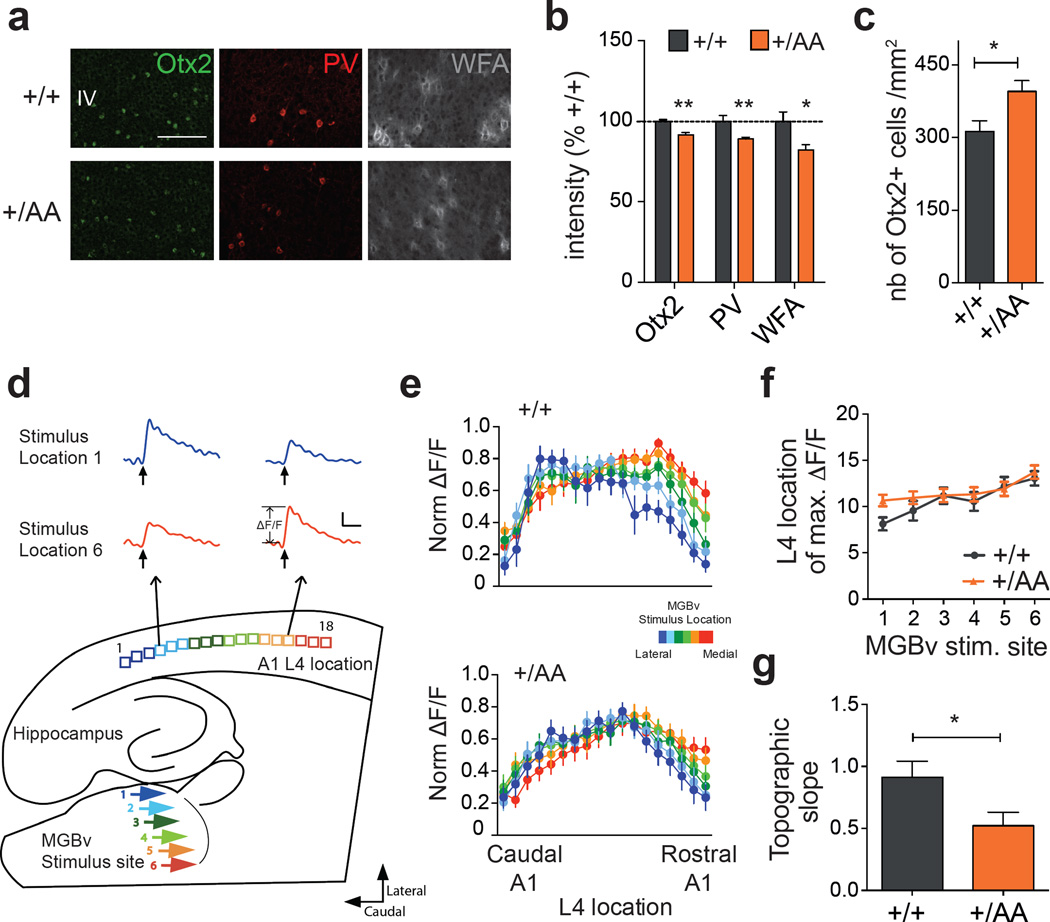
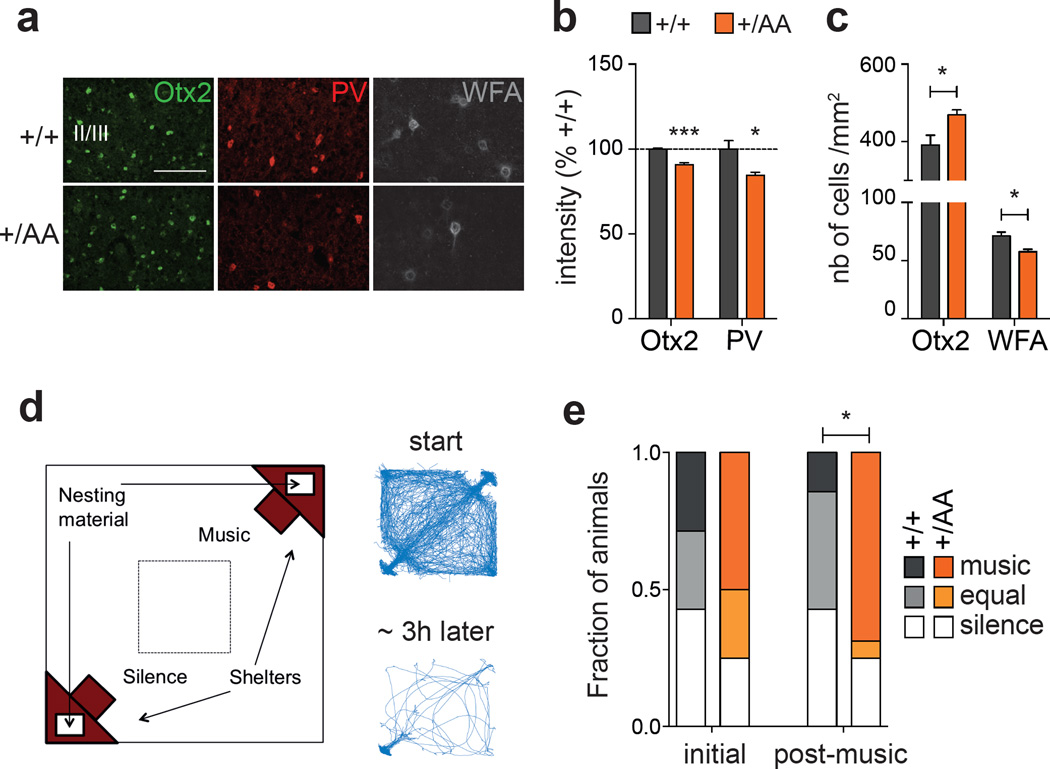
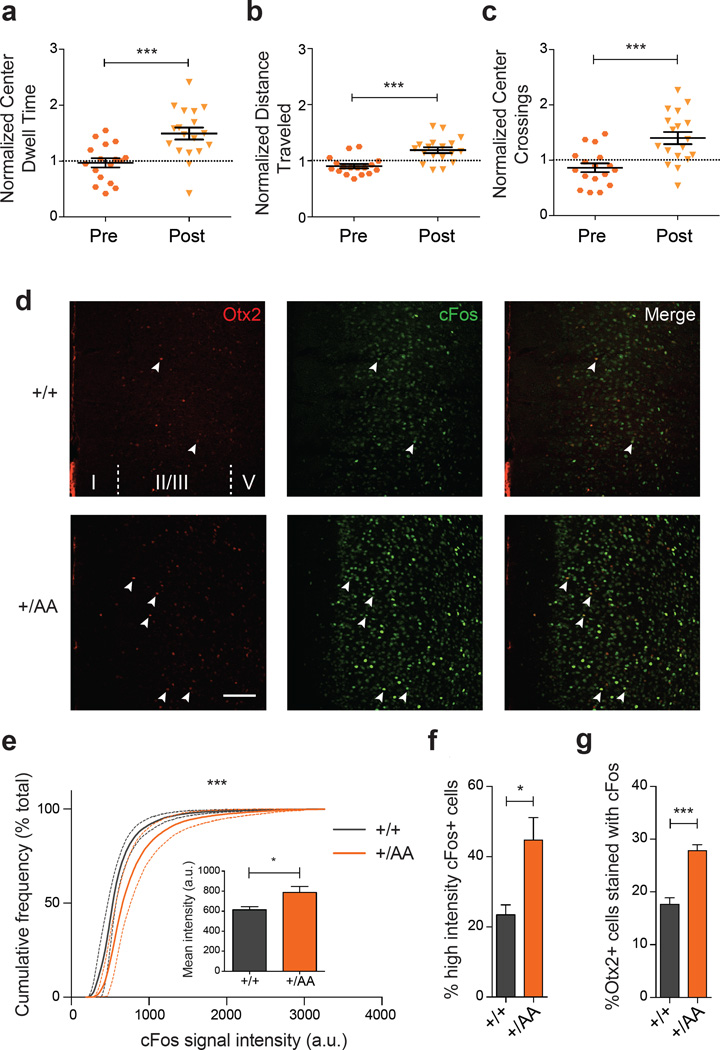
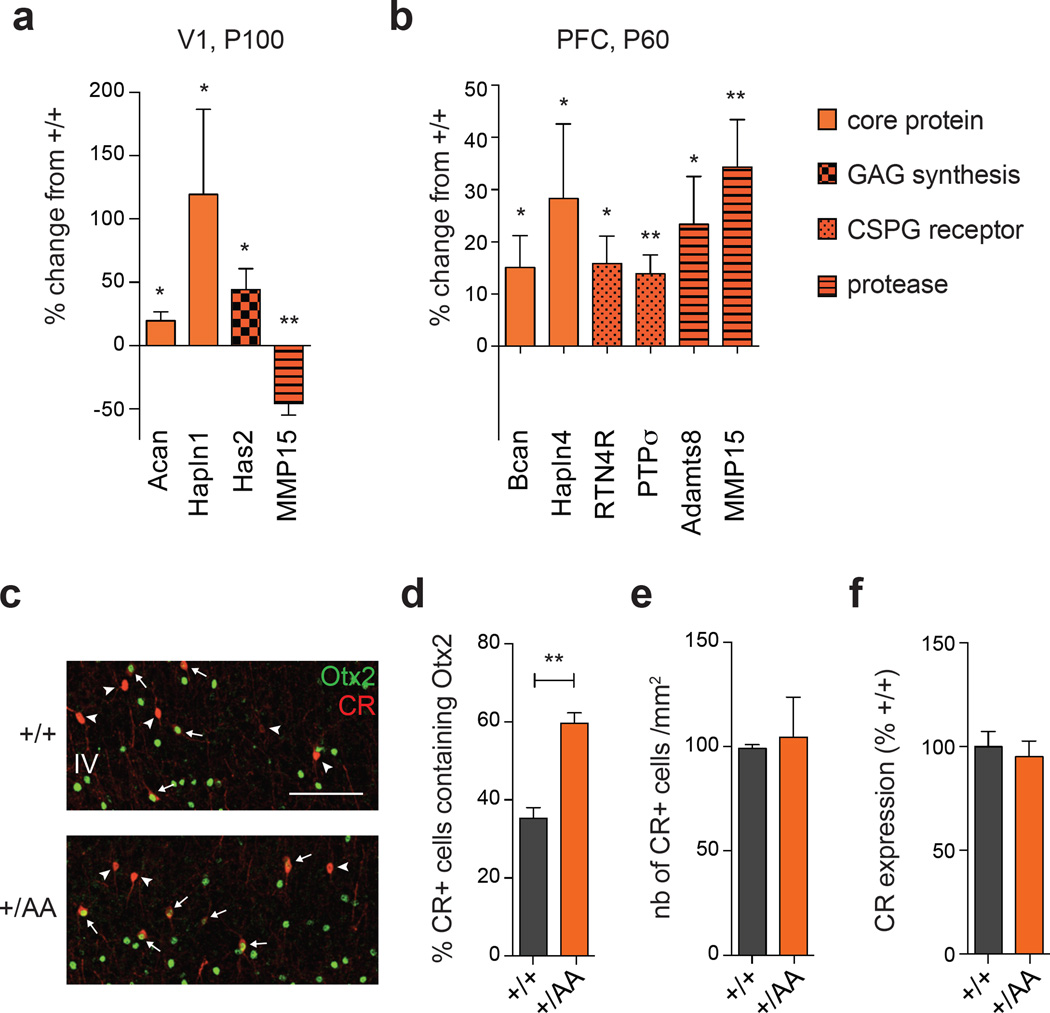
Accumulation of non-cell autonomous Otx2 homeoprotein in postnatal mouse visual cortex (V1) has been implicated in both the onset and closure of critical period (CP) plasticity. Here, we show that a genetic point mutation in the glycosaminoglycan recognition motif of Otx2 broadly delays the maturation of pivotal parvalbumin-positive (PV+) interneurons not only in V1 but also in the primary auditory (A1) and medial prefrontal cortex (mPFC). Consequently, not only visual, but also auditory plasticity is delayed, including the experience-dependent expansion of tonotopic maps in A1 and the acquisition of acoustic preferences in mPFC, which mitigates anxious behavior. In addition, Otx2 mis-localization leads to dynamic turnover of selected perineuronal net (PNN) components well beyond the normal CP in V1 and mPFC. These findings reveal widespread actions of Otx2 signaling in the postnatal cortex controlling the maturational trajectory across modalities. Disrupted PV+ network function and deficits in PNN integrity are implicated in a variety of psychiatric illnesses, suggesting a potential global role for Otx2 function in establishing mental health.


Conflict of interest statement

Conflict of Interest

The authors declare no financial interest related to this work.

Figures

Figure 1
Figure 1
Delayed PV+ cell maturation and visual cortical plasticity in Otx2+/AA mice. (a) A GAG-binding motif is found between the N-terminal (Nter) and the homeodomain of Otx2. The ‘RK’ doublet is mutated to ‘AA’ in the resulting AA mutant. (b) Representative images of WFA (staining for PNN) and Otx2 co-labeling in primary visual cortex (V1) layer IV (L4) at P30 (scale bar: 100 µm), comparing +/+ (WT) and +/AA (heterozygous Otx2+/AA). (c-e) Quantification of Otx2 immunostaining intensity (arbitrary unit, a.u.) in V1 L4 WFA+ cells from P20 to P100 (c, N=3–5 mice per group), total number of Otx2+ cells at P60 (d, N=9–12 mice per group) and percentage of Otx2+ cells not stained with WFA at P60 (e, N=9–12 mice per group). (f, g) WFA staining intensity (a.u.) per pixel (f) and PV staining intensity (a.u.) per cell (g) in V1 L4, quantified from P14 to P200 (N=3–10 mice per group). Shaded area indicates WT ocular dominance critical period. (h) Visual acuity measurements of Otx2+/AA at P30, P100 and P200, with or without short-term (4-day) monocular deprivation (MD; N=4–5 mice per group). (All values: mean ± SEM; t-test; *p < 0.05, **p < 0.01, ***p < 0.001).
Figure 2
Figure 2
Delayed auditory plasticity in Otx2+/AA mice. (a) Representative images of Otx2, PV and WFA staining in primary auditory cortex (A1) layer IV (L4) at P20 (scale bar: 100 µm). (b, c) Staining intensity of Otx2, PV and WFA (b, N=4–7 mice per group) and number of Otx2+ cells (c, N=5–8 mice per group) in A1 L4 at P20. (d) Illustration of thalamocortical brain slice preparation to study auditory plasticity (representative traces from a WT slice, scale bar: 100 msec, 0.05 ΔF/F). (e) Normalized (norm.) maximal ΔF/F across L4 loci in response to different ventral medial geniculate body (MGBv) stimulus sites for WT (N=13, p<0.0001 for stimulus location, 2-way ANOVA) and Otx2+/AA (N=18, p=0.0986 for stimulus location) mice exposed to a 7 kHz tone between P16–20. (f-g) Topographic slope calculated from location of maximal ΔF/F across L4 loci in response to different MGBv stimulus sites 1–6. (All values: mean ± SEM; t-test; *p < 0.05, **p < 0.01).
Figure 3
Figure 3
Altered experience-dependent acoustic preference in adult Otx2+/AA mice. (a) Representative images of Otx2, PV and WFA immunostaining in prefrontal cortex (mPFC) supragranular layers at P60 (scale bar: 100 µm). (b, c) Staining intensity of Otx2 and PV (b, N=4 mice per group) and number of Otx2+ and WFA+ cells (c, N=4–5 mice per group) in supragranular layers of the infra- and pre-limbic regions of mPFC at P60. (d) Typical traces of activity of a mouse inside the arena at the start (first 30 min) and at the end (last 30 min of the 3 h experiment) of the acoustic preference behavior assay. (e) Adult (P60) mice were passively exposed to music for 2 weeks and tested for acoustic preference. Cumulative frequency distribution of WT (N=7) and Otx2+/AA mice (N=16) before (initial) and after (post-music) two-week music exposure. (All values: mean ± SEM; *p < 0.05, ***p < 0.001).
Figure 4
Figure 4
Anxiolysis and recruitment of mPFC circuits following music exposure in Otx2+/AA mice. (a-c) Open field behavior in the first 30 minutes reflecting exploratory anxiety are compared before (Pre) and after (Post) two-week exposure of Otx2+/AA mice to music. Several parameters are compared: (a) duration of time spent at the center of the open field, (b) total distance traveled in the field, and (c) number of times crossing the center of the open field. All data are normalized to WT littermates conditions (N=17 mice per genotype). (d-g) Immunofluorescence staining of Otx2 and cFos in mPFC reveals circuit activation after 1h of music exposure. (d) Representative images of Otx2 and cFos staining in mPFC at P60 (scale bar: 100 µm , cortical layers I-V are labeled). cFos signal intensity between genotypes is compared under several parameters: (e) cumulative frequency plot, (inset) mean intensity (arbitrary unit, a.u.), (f) percentage of high intensity cFos+ cells. (g) Percentage of Otx2+ cells co-localized with cFos staining (indicated by arrowheads in (d) (N=5 mice per genotype). (All values: mean ± SEM; t-test in a-c and f-g, K-S test in e; *p<0.05, ***p<0.001).
Figure 5
Figure 5
PNN turnover and ectopic Otx2 accumulation in Otx2+/AA mice. (a-b) PNN genes whose expression is changed between Otx2+/AA and WT mice in V1 at P100 (a) and in PFC at P60 (b). Results are represented by the percentage change from WT mice (N=5 mice per group). Acan, aggrecan; Bcan, brevican; Hapln, hyaluronan and proteoglycan binding link protein; Has, hyaluronan synthase; Adamts, a disintegrin and metalloproteinase with thrombospondin motifs; RTN4R, reticulon 4 receptor; MMP, matrix metalloproteinase; PTPσ, receptor-type protein tyrosine phosphatase σ. (c-e) Ectopic Otx2 accumulation in Calretinin (CR)+ cells. (c) Representative images of Otx2 and CR co-labeling in V1 layer IV (L4) at P60 (scale bar: 100µm). (d) Percentage of CR+ cells accumulating Otx2 in V1 L4 at P60. (e) Total number of CR+ cells in V1 L4 at P60 (N=3 mice per group). (f) CR gene expression in V1 (N=6 mice per group). (All values: mean ± SEM; t-test; *p<0.05, **p<0.01).

References

    1. Hensch TK. Critical period plasticity in local cortical circuits. Nature reviews Neuroscience. 2005;6(11):877–888. - PubMed
    1. Hubel DH, Wiesel TN. The period of susceptibility to the physiological effects of unilateral eye closure in kittens. The Journal of physiology. 1970;206(2):419–436. - PMC - PubMed
    1. Wang BS, Sarnaik R, Cang J. Critical period plasticity matches binocular orientation preference in the visual cortex. Neuron. 2010;65(2):246–256. - PMC - PubMed
    1. Sanke RF. Amblyopia. American family physician. 1988;37(2):275–278. - PubMed
    1. Fagiolini M, Hensch TK. Inhibitory threshold for critical-period activation in primary visual cortex. Nature. 2000;404(6774):183–186. - PubMed

Publication types

MeSH terms