. 2017 Feb 13:8:14431.
doi: 10.1038/ncomms14431.

Induced p53 loss in mouse luminal cells causes clonal expansion and development of mammary tumours

Affiliations

Induced p53 loss in mouse luminal cells causes clonal expansion and development of mammary tumours

Luwei Tao et al. Nat Commun. .

Abstract

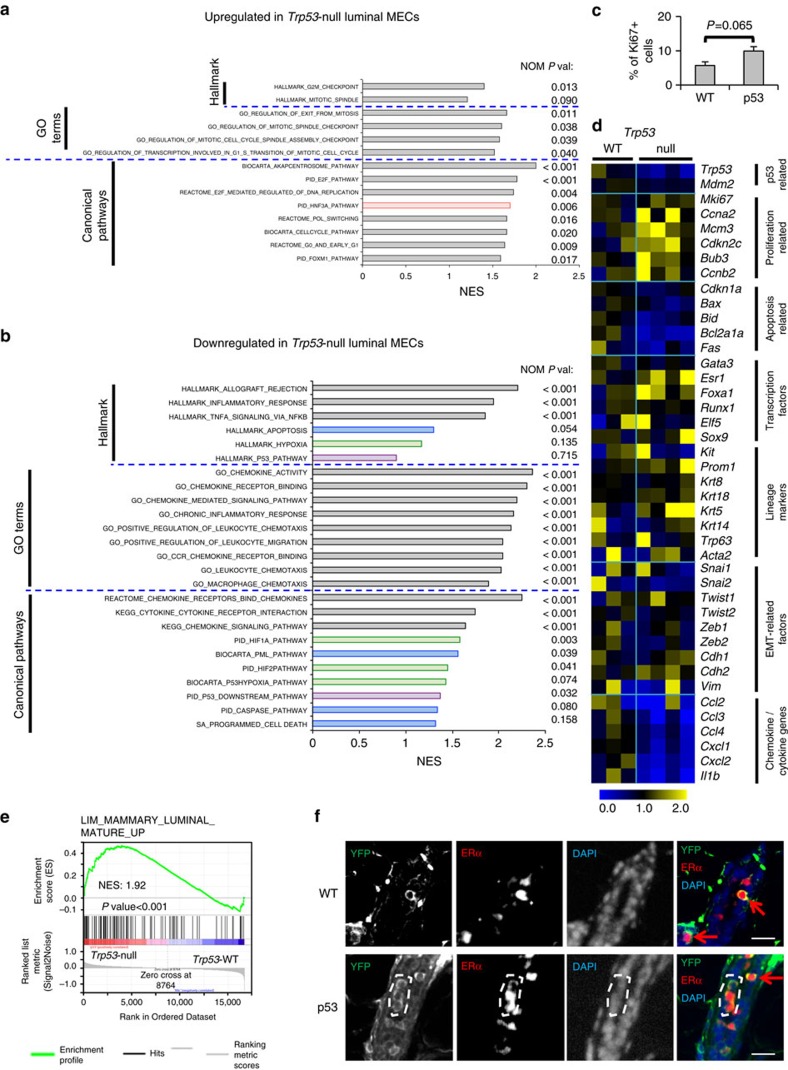
Most breast cancers may have a luminal origin. TP53 is one of the most frequently mutated genes in breast cancers. However, how p53 deficiency contributes to breast tumorigenesis from luminal cells remains elusive. Here we report that induced p53 loss in Krt8+ mammary luminal cells leads to their clonal expansion without directly affecting their luminal identity. All induced mice develop mammary tumours with 9qA1 (Yap1) and/or 6qA2 (Met) amplification(s). These tumours exhibit a mammary stem cell (MaSC)-like expression signature and most closely resemble claudin-low breast cancer. Thus, although p53 does not directly control the luminal fate, its loss facilitates acquisition of MaSC-like properties by luminal cells and predisposes them to development of mammary tumours with loss of luminal identity. Our data also suggest that claudin-low breast cancer can develop from luminal cells, possibly via a basal-like intermediate state, although further study using a different luminal promoter is needed to fully support this conclusion.


Conflict of interest statement

The authors declare no competing financial interests.

Figures

Figure 1
Figure 1. Induced loss of p53 in luminal cells leads to their clonal expansion.
(a) Schematic diagrams of lineage tracing: Cre (either from transient expression from intradcutally injected Ad-K8-Cre or upon tamoxifen-induced activation of K8-CreER)-mediated excision of either a floxed transcriptional Stopper cassette (STOP) in the R26Y reporter, or floxed exons 2–10 in the Trp53L allele, leads to YFP expression and disruption of Trp53 simultaneously (Pulse). The induced females were analysed on chasing for various time periods. (b) Representative co-IF picture showing YFP (green) and Cre (red) staining on a MG section from a Trp53L/L;R26Y female 3 days after Ad-K8-Cre injection. Trp53L/L;R26Y females (n=3); R26Y females (n=3). Scale bar, 20 μm. (c) FACS analysis showing YFP-marked NCL cells, Sca1+ ER+ LPs and Sca1 ER LPs, 3 days after injection of Ad-K8-Cre to R26Y MGs. (d) Quantification for the three luminal subpopulations shown in c (n=3). (e) Co-IF staining showing presence of YFP-marked MECs (green cells, red arrows) 3 days after Ad-K8-Cre injection (representing the initial labelling pattern, left), or on either a short-term (middle) or long-term chase (right). Staining for the basal marker Keratin 14 (K14) was used to indicate basal MECs (red cells). On a long-term chase, examples of extensive expansion of YFP+ Trp53-null ductal luminal cells (lower right panels, red arrow) and alveolar luminal cells (lower right panels, yellow arrows) were shown; corresponding YFP-marked ductal (upper right panels, red arrows) and alveolar (upper right panels, yellow arrow) luminal cells from WT control mice were also shown. Scale bars, 20 μm. (f) Quantification of percentages of YFP-marked single-cell and multi-cell clones in MGs of Trp53L/L;R26Y (p53) or R26Y-only females (WT) as shown in e (initial labelling: n=4 for WT, n=3 for p53; short-term chase: n=7 for WT, n=4 for p53). P value: NS, not significant, two-tailed Student's t-test. (g) Quantification of the numbers and types of YFP-marked clones in MGs of the injected Trp53L/L;R26Y (p53, n=5) or R26Y-only females (WT, n=4) after long-term chase, as shown in e. In both f,g at least 10 ducts per section were counted. Data represent mean±s.e.m.
Figure 2
Figure 2. Induced loss of p53 in luminal cells does not directly alter their luminal identity.
(a) FACS analysis of MGs from virgin females with the indicated genotypes 3 weeks after intraductal injection of Ad-K8-Cre showing YFP-marked MECs were largely restricted to the luminal gate. Ba, basal gate; Lin, lineage markers (including CD45, CD31 and Ter119); Lu, luminal gate. (b) FACS analysis showing YFP-marked MECs from K8-CreER;Trp53L/L;R26Y (n=4) or K8-CreER;R26Y (n=3) females 4 weeks after tamoxifen administration. Note in both types of mice, YFP+ MECs were restricted to the luminal gate. Ba, basal gate; Lu, luminal gate. (c) Quantification of percentages of YFP+ populations 3–4 weeks after injection of Ad-K8-Cre to Trp53L/L;R26Y females (p53) or matched R26Y-only females (WT). Data represent four independent experiments. In each experiment (one WT, one p53), the percentage of YFP+ cells in the p53 experimental female was normalized to that in the WT control female (=1) from the same experiment. (d) Co-IF staining of K8 (white), K14 (red) and YFP (green) on MG sections from Trp53L/L;R26Y (n=5) or R26Y-only (n=4) virgin females >5 months after intradcutal injection of Ad-K8-Cre. Each channel of the co-IF staining is shown. Scale bars, 50 μm. (e) Quantification of percentages of cells in the luminal or basal gate in a. Data represent mean±s.e.m. from three independent experiments (one WT, one p53 in each experiment). P value: NS, not significant, two-tailed Student's t-test. Data represent mean±s.e.m.
Figure 3
Figure 3. Microarray analysis and validation of luminal MECs on induced loss of p53.
(a) GSEA results showing upregulation of proliferation-related (grey-shaded) and FOXA1 (HNF3A)-related (red-shaded) gene sets from the H (Hallmark), C2 (canonical pathways) and C5 (Gene Ontology (GO) terms) collections of the GSEA MSigDB v5.2 in YFP+ Trp53-null MECs from K8-CreER;Trp53L/L;R26Y females (n=4) compared with YFP+ WT MECs from K8-CreER;R26Y females (n=3), 4 weeks after tamoxifen induction. (b) GSEA results showing downregulation of immune (grey-shaded), hypoxia (green-shaded), p53 pathway/targets (purple-shaded) and apoptosis (blue-shaded)-related gene sets in YFP+ Trp53-null MECs. In a,b normalized enrichment score (NES) and nominal P value (NOM p-val) are shown for each gene set. (c) Percentages of Ki67+ cells among YFP-marked MECs in Trp53L/L;R26Y females (p53, n=3) or R26Y-only females (WT, n=3) 3–4 weeks after Ad-K8-Cre injection. Representative YFP/Ki67 co-staining pictures are shown in Supplementary Fig. 1b. At least 10 ducts per section were counted. Data represent mean±s.e.m. (d) Heatmap showing expression levels of select genes in different categories in YFP+ Trp53-null MECs compared with matched YFP+ WT MECs. For each gene, the expression value from each sample was normalized to the mean of WT samples (=1) and the resulted relative expression value (that is, fold change to the mean of WT) was shown on the heatmap. (e) GSEA result showing significant enrichment of an ER+ mature luminal cell gene set (from ref. 36) in Trp53-null MECs in relation to WT controls. NES and nominal P value are shown. (f) Representative co-IF pictures showing YFP (green) and ERα (red) staining for MGs from Trp53L/L;R26Y females (p53, n=4) or R26Y-only females (WT, n=4) 3–4 weeks after Ad-K8-Cre injection. An YFP+ multi-cell clone comprised of two ER+ cells and one ER cells is highlighted. Individual YFP+ER+ cells are indicated by red arrows. Scale bars, 20 μm.
Figure 4
Figure 4. Induced loss of p53 in luminal cells leads to development of mammary tumours with loss of luminal identity.
(a) Kaplan–Meier survival curves showing all Trp53L/L females (n=9) injected with Ad-K8-Cre or K8-CreER;Trp53L/L females (n=4) induced by tamoxifen (2 mg per mouse, one injection) developed mammary tumours with a similar latency. (b,c) Co-IF staining (for YFP, K8, K14, left and middle panels) and immunohistochemical (IHC) staining (for Claudin 3 and E-Cadherin, right panels) showing that most mammary tumours developed in cohorts in a were YFP+ mammary tumours that were largely negative for K8 and K14, and were negative for Claudin 3 and E-Cadherin (b, Type 1). In addition, a small number of mammary tumours developed in cohorts in a were YFP+;K8+;K14+;Claudin 3+;E-Cadherin+ mammary tumours (c, Type 2). Scale bars, 50 μm. (d,e) Heatmaps summarizing GSEA results (plotted as NES, from Supplementary Data 1), based on comparisons of microarray data of each tumour to those of Trp53-WT luminal MECs and to gene sets representing human (d) and murine (e) intrinsic subtypes. The gene sets were extracted from Pfefferle et al. (Human intrinsic subtypes were based on the UNC308 data set and Combined855 data set). (f) Heatmap showing upregulation of EMT-related genes and downregulation of E-Cadherin gene (Cdh1) and Claudin genes in Type 1 (and to a lessor gene, in Type 2 (E8)) tumours. For each gene, the expression value from each sample was normalized to the mean of WT samples (=1) and the resulting relative expression value (that is, fold change to the mean of WT) was shown on the heatmap. (g) GSEA plot showing significant enrichment of a MaSC-related gene set based on Lim et al in all tumours in relation to Trp53-WT luminal MECs (that is, cellular origin). NES and nominal P value are shown.
Figure 5
Figure 5. SNP array analysis showing recurrent genomic lesions in Type 1 and 2 mammary tumours.
(a) Left: a recurrent genomic lesion (∼1.15 Mb amplicon) on chromosome 9qA1 was identified in several Type 1 tumours (E2, E4, E5, E9). Right: a recurrent genomic lesion (amplicon spanning chromosome 6qA1-6qA2) encompassing Cav2, Cav1 and Met was identified in tumours E8 and E9. In all plots, relative signal intensity of each probe is shown as the strength of each probe from each tumour sample minus that from the WT control MGs. (b) Top: the recurrent 1.15Mb amplicon on chromosome 9qA1 encompasses multiple Mmp and Birc genes, as well as the Hippo pathway-related Yap1 gene; heatmap from microarray confirmed high expression levels of multiple genes (for example, Yap1) in this amplicon in tumours E2, E4, E5 and E9 (as in a); it also revealed several additional tumours (TB208, TB209, TB239-2) with potential amplification of this region. Bottom: the recurrent amplicon on chromosome 6qA1-6qA2 encompasses Cav2, Cav1 and Met; heatmap from microarray confirmed high expression levels of multiple genes (for example, Met) in this amplicon in tumours E8 and E9 (as in a); it also revealed several additional tumours (E7, TB239-2) with potential amplification of this region. In both heatmaps, expression values were normalized to mean of WT samples (=1). (c) A common amplicon on chromosome 3 identified only in a subset of Type 1 tumours (E4, E5). (d) A common amplicon on chromosome 1 identified only in tumours E8 and E9. A potential BLBC-related oncogene Akt3 in this amplicon is indicated.
Figure 6
Figure 6. PCR analyses confirming recurrent genomic lesions in Type 1 and 2 mammary tumours.
(ac) qRT-PCR (top, normalized to expression levels of Gapdh) and genomic PCR (bottom, normalized to the Lsd1 gene body, which exhibits no amplification based on SNP analysis) analyses showing excellent correlation of Yap1 (a) and Met (b) overexpression with amplification of their corresponding genes in multiple tumours developed in the Ad-K8-Cre/Trp53L/L and K8-CreER;Trp53L/L (tamoxifen) models. In a, two tumours (E7, E8) with no Yap1 overexpression/amplification are highlighted in red. In b, five tumours (E3, E7, E8, E9 and TB239-2) with both Met overexpression and gene amplification are highlighted in red. The PCR analyses also show correlation of Akt3 overexpression with its gene amplification in tumours E8 and E9 (highlighted in red) (c). In ac, five tumours analysed in Fig. 5a are indicated by arrows. Data represent mean±s.e.m.

Similar articles

Cited by

References

    1. Simpson P. T., Reis-Filho J. S., Gale T. & Lakhani S. R. Molecular evolution of breast cancer. J. Pathol. 205, 248–254 (2005). - PubMed
    1. Cancer Genome Atlas Network. Comprehensive molecular portraits of human breast tumours. Nature 490, 61–70 (2012). - PMC - PubMed
    1. Perou C. M. et al. Molecular portraits of human breast tumours. Nature 406, 747–752 (2000). - PubMed
    1. Sorlie T. et al. Gene expression patterns of breast carcinomas distinguish tumor subclasses with clinical implications. Proc. Natl Acad. Sci. USA 98, 10869–10874 (2001). - PMC - PubMed
    1. Sorlie T. et al. Repeated observation of breast tumor subtypes in independent gene expression data sets. Proc. Natl Acad. Sci. USA 100, 8418–8423 (2003). - PMC - PubMed

Publication types