. 2017 Feb 13:8:14181.
doi: 10.1038/ncomms14181.

Protective role of fructokinase blockade in the pathogenesis of acute kidney injury in mice

Affiliations

Protective role of fructokinase blockade in the pathogenesis of acute kidney injury in mice

Ana Andres-Hernando et al. Nat Commun. .

Abstract

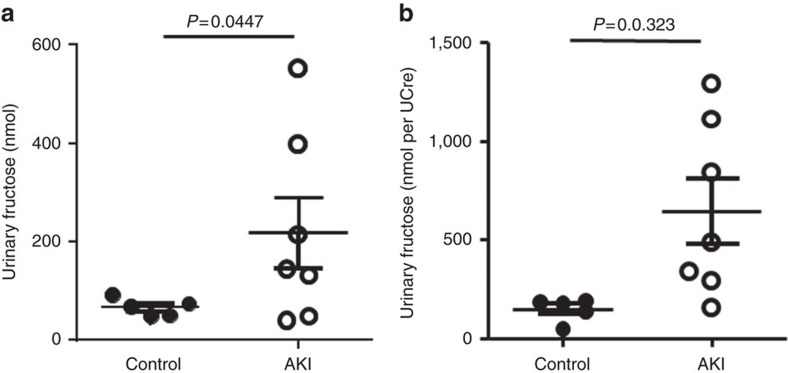
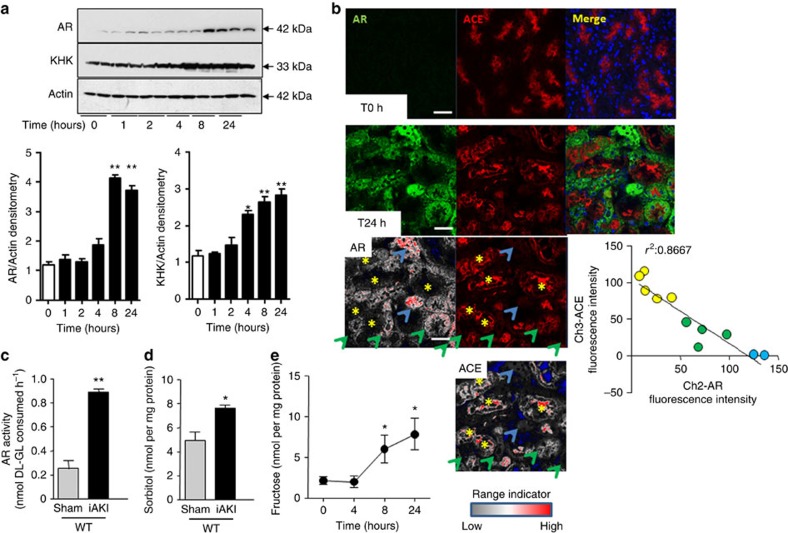
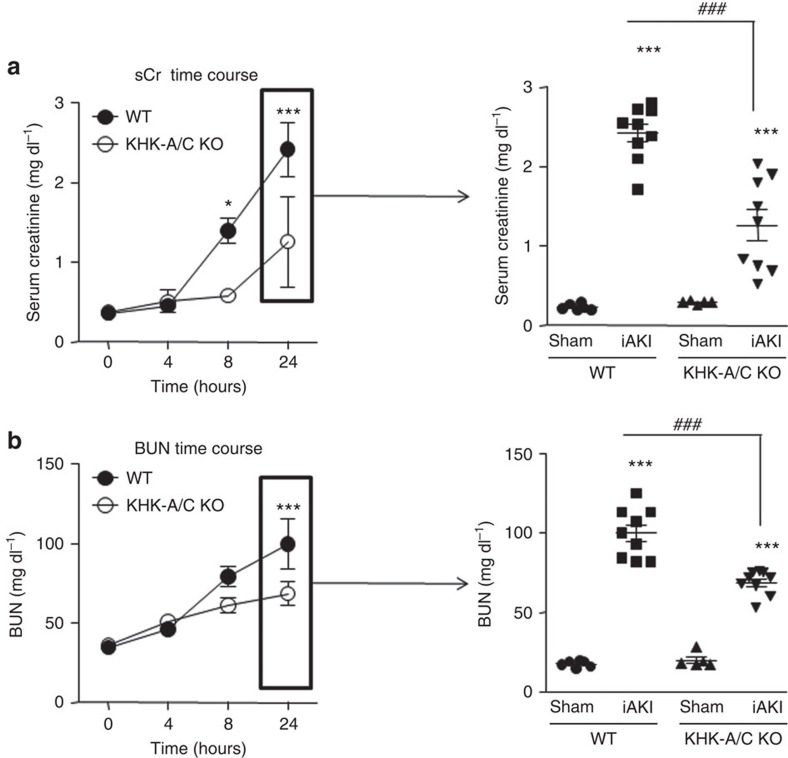
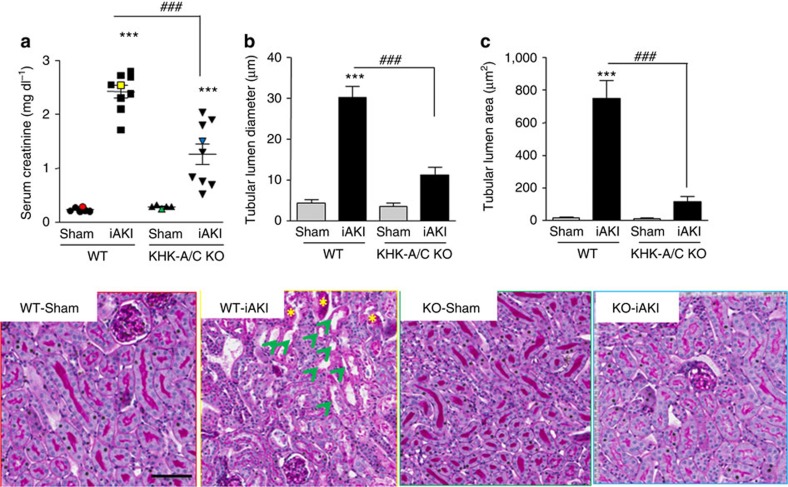
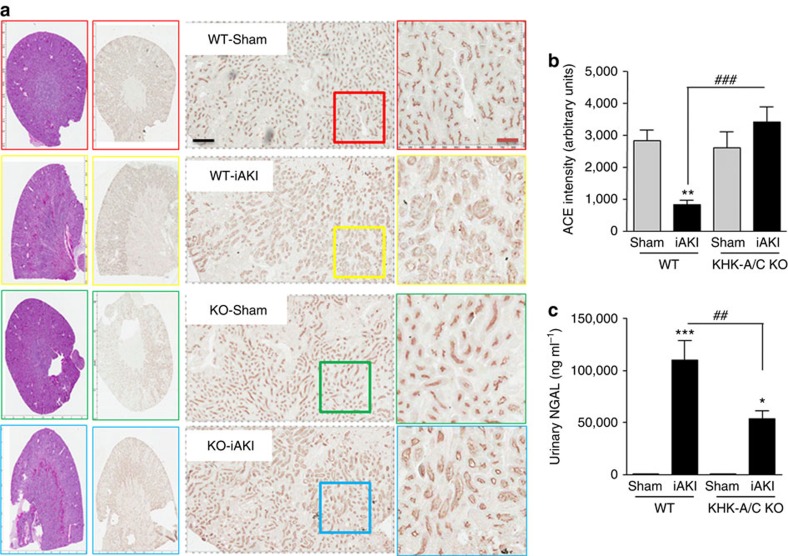
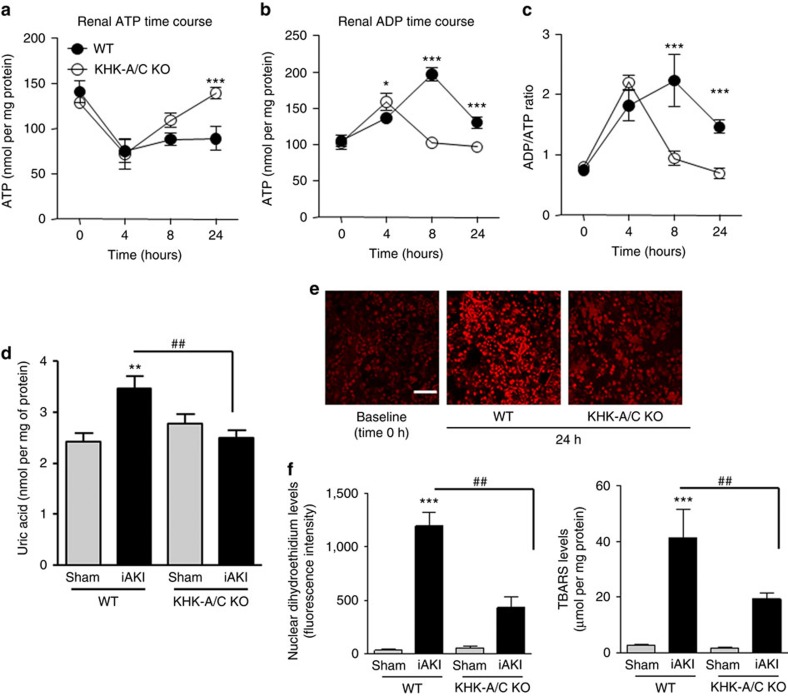
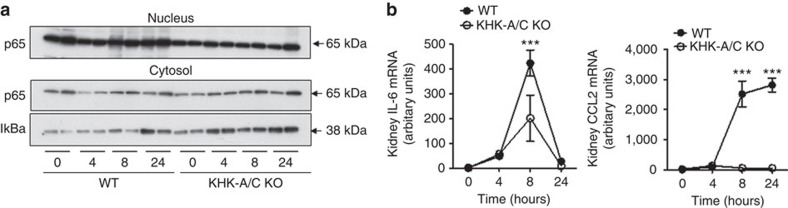
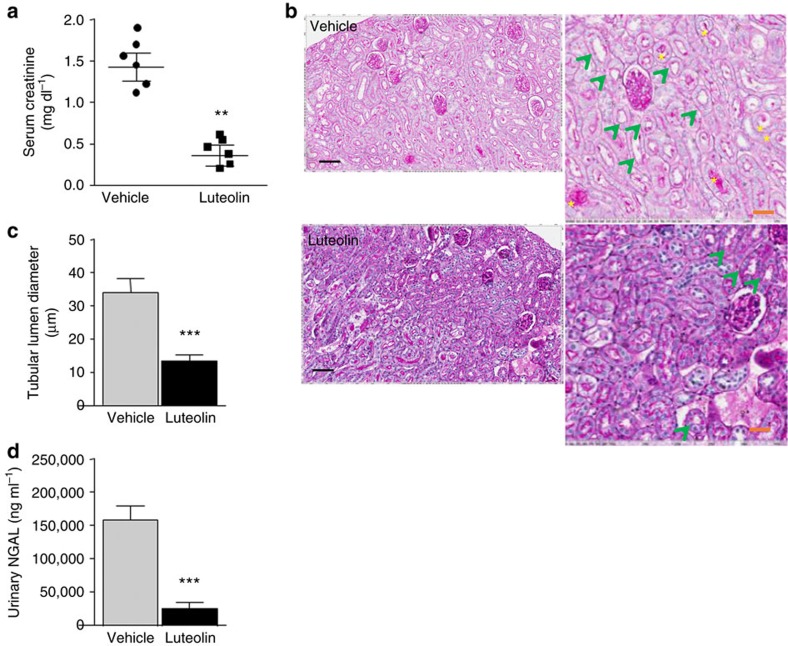
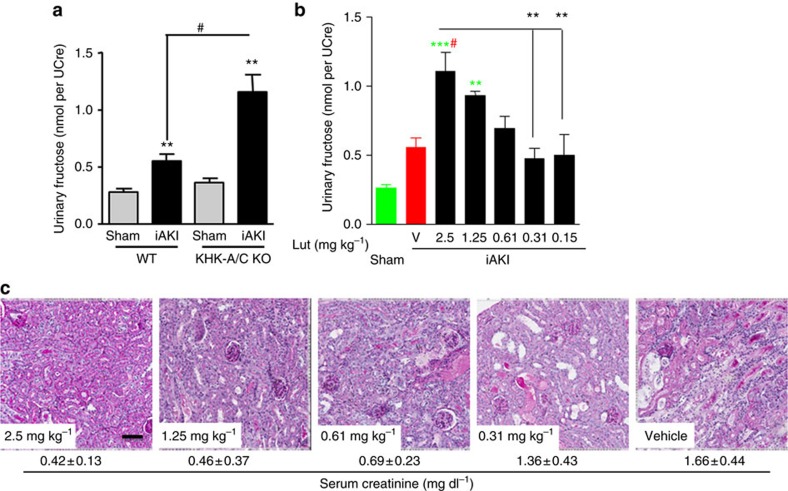
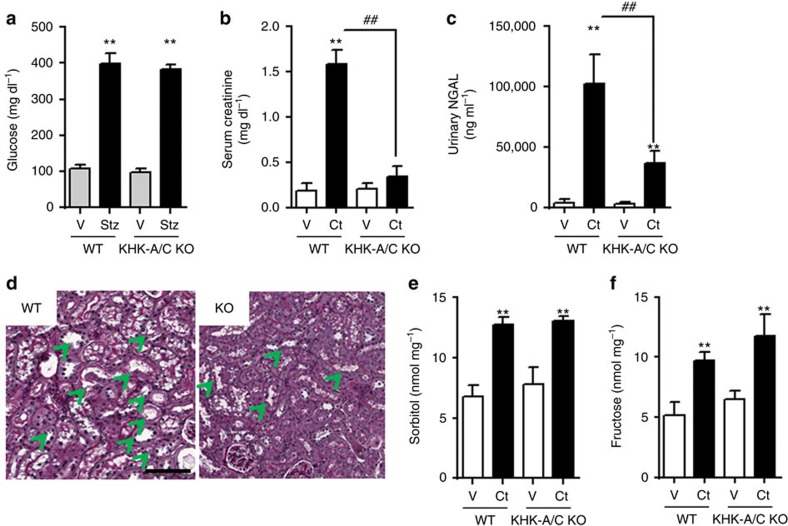
Acute kidney injury is associated with high mortality, especially in intensive care unit patients. The polyol pathway is a metabolic route able to convert glucose into fructose. Here we show the detrimental role of endogenous fructose production by the polyol pathway and its metabolism through fructokinase in the pathogenesis of ischaemic acute kidney injury (iAKI). Consistent with elevated urinary fructose in AKI patients, mice undergoing iAKI show significant polyol pathway activation in the kidney cortex characterized by high levels of aldose reductase, sorbitol and endogenous fructose. Wild type but not fructokinase knockout animals demonstrate severe kidney injury associated with ATP depletion, elevated uric acid, oxidative stress and inflammation. Interestingly, both the renal injury and dysfunction in wild-type mice undergoing iAKI is significantly ameliorated when exposed to luteolin, a recently discovered fructokinase inhibitor. This study demonstrates a role for fructokinase and endogenous fructose as mediators of acute renal disease.


Conflict of interest statement

R.J.J. has grants with Amway and Danone and is on the Scientific Advisory Board of Amway. R.J.J. also has authored two lay books on sugar (fructose) and its role in obesity and metabolic syndrome (The Sugar Fix, Rodale, 2008 and The Fat Switch, mercola.com, 2012). M.A.L., T.I. and R.J.J. have patents and patent application related to the blockade of fructokinase in the prevention and treatment of sugar-induced metabolic syndrome and renal disease. M.A.L., M.T.L., C.R.-J., M.F.W. and R.J.J. are members of Colorado Research Partners, LLC, a company focused on the development of fructokinase inhibitors. All other authors declare no competing financial interests.

Figures

Figure 1
Figure 1. Elevated urinary fructose excretion in human subjects with acute kidney injury (AKI).
Urinary fructose levels total (a) or normalized to creatinine (b) in human subjects undergoing acute kidney injury (n=5–7). Each sample was measured in triplicates and average for each subject was calculated for statistical analysis and displayed in the figure.
Figure 2
Figure 2. Activation of the polyol pathway in the kidney cortex of mice undergoing iAKI.
(a) Protein expression and densitometry of aldose reductase (AR) and fructokinase (ketohexokinase, KHK) in kidney cortex extracts at different time points post-ischaemic insult (uncropped blots is presented as Supplementary Fig. 1). Statistical analysis was performed with ANOVA with ad hoc analysis by Bonferroni's method to compare all columns. (b) Top: Representative fluorescent staining of the kidney cortex for aldose reductase (AR, green) and the brush border marker ACE (red) at baseline and 24 h post-ischaemic insult. Bottom: Confocal quantitation and plot for AR and ACE staining. Blue arrows indicate tubules with high AR/low ACE expression, while yellow asterisks represent tubules with low AR/high ACE expression. Scale bar: 100 μm. (c) Cortical AR activity at baseline and 24 h post-ischaemic insult (two-tailed t-test statistical analysis). (d) Cortical sorbitol levels at baseline and 24 h post-ischaemic insult (two-tailed t-test statistical analysis). (e) Time-course analysis of fructose levels in mice undergoing iAKI for 24 h (ANOVA with ad hoc analysis by Bonferroni's method to compare all columns). n=6 animals per group with two different studies. Data indicate mean s.e.m. *P<0.05, **P<0.01 versus baseline or control.
Figure 3
Figure 3. Ameliorated renal dysfunction in fructokinase knockout mice undergoing iAKI.
(a) Left: time-course analysis of serum creatinine (sCr) levels in wild type (WT) and fructokinase-deficient (KHK-A/C KO) mice undergoing iAKI for 24 h. Right: serum creatinine levels at 24 h in the same animals or sham control. (b) Left: time-course analysis of blood urea nitorgen (BUN) levels in wild type (WT) and fructokinase-deficient (KHK-A/C KO) mice undergoing iAKI for 24 h. Right: serum creatinine levels at 24 h in the same animals or sham control. n=5–9 animals per group with two different studies. Statistical analysis was performed with ANOVA with ad hoc analysis by Bonferroni's method to compare all columns. Data indicate mean±s.e.m. ***P<0.001 versus baseline or within the same group. ###P<0.001.
Figure 4
Figure 4. Ameliorated renal injury in fructokinase knockout mice undergoing iAKI.
(a) Serum creatinine and representative periodic acid-Schiff-stained images of sham operation and mice (wild type (WT) or fructokinase deficient (KHK-A/C KO) undergoing iAKI) (colour denotes animal selected from each group). (b) Tubular lumen diameter in the same groups of animals. (c) Tubular lumen area in the same groups of animals. Data indicate mean±s.e.m. ***P<0.001 versus baseline or within the same group. n=5–9 animals per group with two different studies. ###P<0.001. Green arrows denote tubules with significant dilatation. Statistical analysis was performed with ANOVA with ad hoc analysis by Bonferroni's method to compare all columns. Yellow asterisks: cast formation in tubes. Scale bar: 100 μm.
Figure 5
Figure 5. Reduced brush border loss and NGAL excretion in fructokinase knockout mice undergoing iAKI.
(a) Representative images of ACE staining—brush border marker—of sham operation and mice (wild type (WT) or fructokinase deficient (KHK-A/C KO) undergoing iAKI). (b) Intensity quantitation of ACE staining in the same groups of animals. (c) Urinary NGAL levels in the same groups of animals. Data indicate mean±s.e.m. *P<0.05, **P<0.01 and ***P<0.001 versus baseline or within the same group. n=5–9 animals per group with two different studies ###P<0.001, ##P<0.01. Statistical analysis was performed with ANOVA with ad hoc analysis by Bonferroni's method to compare all columns. Scale bar: black 500 μm, red 100 μm.
Figure 6
Figure 6. Reduced renal oxidative stress in fructokinase knockout mice undergoing iAKI.
(a) Time-course analysis of cortical ATP levels in wild type (WT) and fructokinase-deficient (KHK-A/C KO) mice undergoing iAKI for 24 h. (b) Time-course analysis of cortical ADP levels in wild type (WT) and fructokinase-deficient (KHK-A/C KO) mice undergoing iAKI for 24 h. (c) ADP/ATP ratio in the same conditions. (d) Cortical uric acid levels at 24 h in the same groups of animals. (e) Top: Representative images of the oxidative stress marker, dihydroethidium (DHE) at baseline and 24 h post iAKI in wild type (WT) and fructokinase-deficient (KHK-A/C KO) mice. Bottom: Representative quantitation of DHE in the same groups of animals. Scale bar: 100 μm. (f) Cortical thiobarbituric acid reactive substance levels at 24 h in the same groups of animals. n=5–9 animals per group with two different studies. Data indicate mean±s.e.m. For (ac): *P<0.05, **P<0.01 and ***P<0.001 between WT and KHK-A/C KO. For (df): **P<0.01 and ***P<0.001 versus baseline or within the same group. ##P<0.01. Statistical analysis was performed with ANOVA with ad hoc analysis by Bonferroni's method to compare all columns.
Figure 7
Figure 7. Reduced renal inflammation in fructokinase knockout mice undergoing iAKI.
(a) Representative western blot demonstrating nuclear and cytosolic expression of the NF-κB subunit p65 and their regulator IkBa (uncropped blots are presented as shown in Supplementary Fig. 2). (b) Time-course analysis of mRNA levels of the proinflammatory cytokine il-6 and the chemokine ccl2 in wild type (WT) and fructokinase-deficient (KHK-A/C KO) mice undergoing iAKI. Data indicate mean±s.e.m. ***P<0.001 between WT and KHK-A/C KO. n=5–9 animals per group with two different studies. Statistical analysis was performed with ANOVA with ad hoc analysis by Bonferroni's method to compare all columns.
Figure 8
Figure 8. Improved renal dysfunction in luteolin-receiving mice before ischaemic insult.
(a) Serum creatinine levels in vehicle and luteolin-treated wild-type mice at 24 h post-ischaemic insult. (b) Representative periodic acid-Schiff-stained images in the same groups as in a. Scale bar: black 300 μm, red 100 μm. (c) Tubular lumen area in the same groups as in a. (d) Urinary NGAL levels in the same groups as in a. Data indicate mean±s.e.m. **P<0.01 and ***P<0.001. n=6 animals per group. Statistical analysis by two-tail t-test. Green arrows denote tubules with significant dilatation. Yellow asterisks: cast formation in tubes.
Figure 9
Figure 9. Improved renal dysfunction in luteolin-receiving mice after ischaemic insult.
(a) Urinary fructose—normalized to creatinine—levels in wild type (WT) and fructokinase-deficient (KHK-A/C KO) mice at 24 h post sham operation or ischaemic acute kidney injury (iAKI). (b) Dose–response effect of vehicle (V) or luteolin (Lut) in 24 h urinary fructose production in mice undergoing iAKI. (c) Representative periodic acid-Schiff-stained images of the same groups as in (b) (below indicate average±s.d. of serum creatinine obtained for each group). Data indicate mean±s.e.m. **P<0.01 and ***P<0.001 versus baseline or within the same group. #P<0.05. Statistical analysis was performed with ANOVA with ad hoc analysis by Bonferroni's method to compare all columns. Green colour denotes statistical difference versus sham. Red colour denotes statistical difference versus vehicle. n=3 animals per dose. Scale bar: 100 μm.
Figure 10
Figure 10. Ameliorated renal dysfunction and injury in fructokinase knockout mice undergoing CIN.
(a) Serum glucose levels in control and streptozocin injected wild type (WT) and fructokinase-deficient (KHK-A/C KO) mice at 2 weeks post injection. (b) Serum creatinine, (c) urinary NGAL and (d) histology/ periodic acid-Schiff staining. Scale bar: 100 μm. (d) Renal cortical sorbitol and (e) renal cortical fructose levels in 2-week diabetic animals receiving either vehicle (V) or contrast (Ct) for 24 h. n=5–9 animals per group. Data indicate mean±s.e.m. **P<0.01 versus baseline or within the same group. ##P<0.01. Statistical analysis was performed with ANOVA with ad hoc analysis by Bonferroni's method to compare all columns. Green arrows denote tubules with significant dilatation.

Comment in

References

    1. Star R. A. Treatment of acute renal failure. Kidney Int. 54, 1817–1831 (1998). - PubMed
    1. Chertow G. M., Burdick E., Honour M., Bonventre J. V. & Bates D. W. Acute kidney injury, mortality, length of stay, and costs in hospitalized patients. J. Am. Soc. Nephrol. 16, 3365–3370 (2005). - PubMed
    1. Simmons E. M. et al.. Plasma cytokine levels predict mortality in patients with acute renal failure. Kidney Int. 65, 1357–1365 (2004). - PubMed
    1. Elahi M. M., Lim M. Y., Joseph R. N., Dhannapuneni R. R. & Spyt T. J. Early hemofiltration improves survival in post-cardiotomy patients with acute renal failure. Eur. J. Cardiothorac. Surg. 26, 1027–1031 (2004). - PubMed
    1. Liangos O. et al.. Epidemiology and outcomes of acute renal failure in hospitalized patients: a national survey. Clin. J. Am. Soc. Nephrol. 1, 43–51 (2006). - PubMed

Publication types

MeSH terms