. 2017 Feb 13:8:14405.
doi: 10.1038/ncomms14405.

Abnormal degradation of the neuronal stress-protective transcription factor HSF1 in Huntington's disease

Affiliations

Abnormal degradation of the neuronal stress-protective transcription factor HSF1 in Huntington's disease

Rocio Gomez-Pastor et al. Nat Commun. .

Abstract

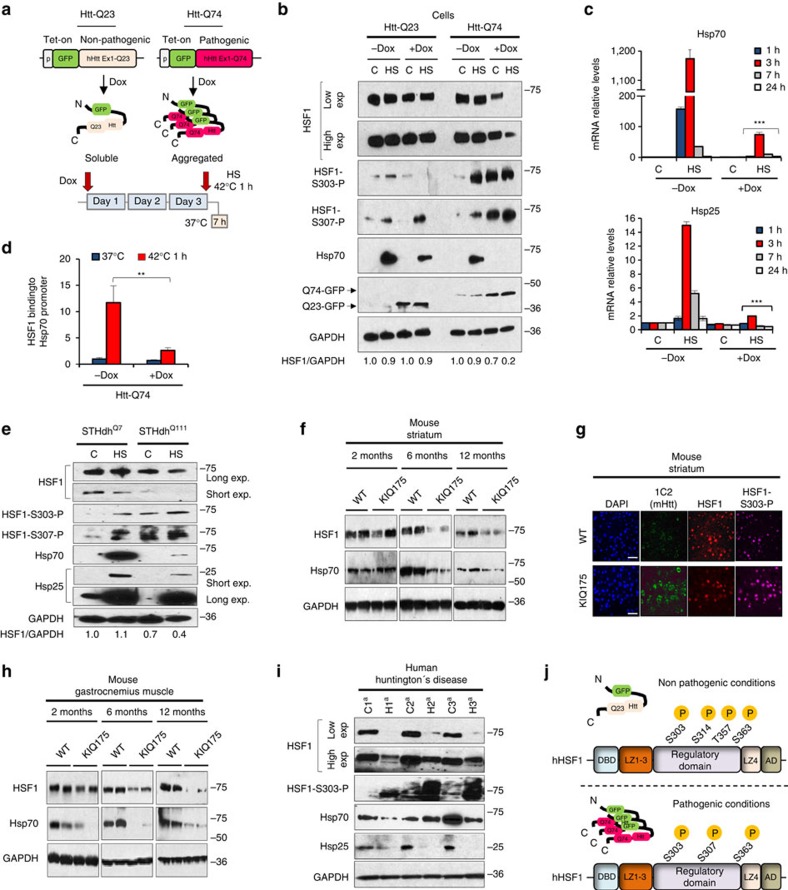
Huntington's Disease (HD) is a neurodegenerative disease caused by poly-glutamine expansion in the Htt protein, resulting in Htt misfolding and cell death. Expression of the cellular protein folding and pro-survival machinery by heat shock transcription factor 1 (HSF1) ameliorates biochemical and neurobiological defects caused by protein misfolding. We report that HSF1 is degraded in cells and mice expressing mutant Htt, in medium spiny neurons derived from human HD iPSCs and in brain samples from patients with HD. Mutant Htt increases CK2α' kinase and Fbxw7 E3 ligase levels, phosphorylating HSF1 and promoting its proteasomal degradation. An HD mouse model heterozygous for CK2α' shows increased HSF1 and chaperone levels, maintenance of striatal excitatory synapses, clearance of Htt aggregates and preserves body mass compared with HD mice homozygous for CK2α'. These results reveal a pathway that could be modulated to prevent neuronal dysfunction and muscle wasting caused by protein misfolding in HD.


Conflict of interest statement

D.J.T. is a founder of Chaperone Therapeutics and a member of the SAB.

Figures

Figure 1
Figure 1. HSF1 levels are decreased and P-Ser303/307 increased in HD.
(a) Diagram of the PC12-HttQ23 and Htt-Q74 proteins and experimental design. (b) Cells expressing either Htt-Q23 or Htt-Q74 were cultivated at 37 °C (c) in the presence of tetracycline (Dox) for 3 days to induce expression, exposed to heat shock 1 h at 42 °C, allowed to recover at 37 °C for 7 h (HS) and protein extracts immunoblotted with the indicated antibodies. HSF1 bands were quantitated using Quantity One image software (BioRad) and values normalized using GAPDH as loading control and referenced to control at 37 °C (c) in the absence of −Dox. (c) qRT-PCR analysis of the Hsp70 and Hsp25 genes in Htt-Q74-expressing cells as in B. HS (+Dox) group was compared with HS (−Dox) group. Error bars represent means±s.e.m., n=4. Unpaired t-test, ***P<0.001. (d) Analysis of Hsp70 promoter occupancy by HSF1. Error bars represent means±s.e.m., n=3. Unpaired t-test, **P<0.01. (e) Mouse-derived striatal STHdhQ7 and STHdhQ111 cells were cultured at 33 °C (c), heat shocked at 42 °C 1 h with recovery at 33 °C for 7 h and immunoblotted with the indicated antibodies. HSF1 was quantified using Quantity One image software and normalized using GAPDH as loading control and referenced to control at 37 °C in the non-pathogenic STHdhQ7. (f) Striatal samples from Wild type (WT) C57BL/6 or KIQ175 mice at 2, 6 and 12 months analysed by immunoblotting (n=4). (g) Dorsal striatal sections from WT and KIQ175 mice (n=3) at 6 months assayed by immunohistochemistry (IHC) for mHtt aggregation (1C2), HSF1 and HSF1-S303 phosphorylation using DAPI staining as control. Scale bar: 10 μm. (h) Gastrocnemius muscle extracts from WT and KI175 mice (n=4) of the indicated age, immunoblotted for HSF1, Hsp70 and GAPDH. (i) Protein extracts from HD patient striatum (Supplementary Table 1) and controls immunoblotted with indicated antibodies. (j) HSF1 phosphoproteomic analysis under non-pathogenic (−Dox) and pathogenic (+Dox) conditions in hsf1−/− MEF inducible cell line expressing GFP-Htt-Q74 expressing HSF1. See Supplementary Fig. 8 for uncropped immunoblots. HSF1 represented by the Regulatory domain, DBD; DNA binding domain; LZ1-3 and LZ4; leucine zipper domains.
Figure 2
Figure 2. Proteasomal HSF1 degradation in HD is mediated by Phospho-S303/S307.
(a,b) PC12 cells expressing Htt-Q74 for 1, 2 or 3 days followed by Heat Shock (HS) and recovery as indicated. Control and HS in the absence of Dox correspond to cells incubated during 3 days at 37 °C. (c) Htt-Q74 cells Dox-induced or not for 3 days and exposed to 2 μM 17-AAG and/or MG132 (5 μM) for 6 h and extracts immunoblotted with the indicated antibodies. (d) Diagram of the effects of 17-AAG and MG132 treatment and Htt-Q74 expression in HSF1. (e) Htt-Q74 cells transfected with human influenza haemagglutinin-ubiquitin (HA-Ub) plasmid Dox induced or not and treated with 5 μM MG132 treatment for 6 h. Whole-cell extract and HA immunoprecipitated (IP:HA) and HSF1 immunoprecipitated samples (IP:HSF1) were immunoblotted as indicated. (f) Transcript levels for indicated E3 ligases evaluated by qRT-PCR from striatum of WT and KIQ175 mice at 6 months. Error bars represent±s.e.m., (n=3). Unpaired t-test, *P<0.05. (g) Human striatum samples from HD patients and controls and (h) Mouse striatum from 12 months old WT and KIQ175 mice were immunoblotted for HSF1 and Fbxw7. (i) Fbxw7 siRNA in STHdhQ7 and STHdhQ111 cells using scrambled RNA (Scr) as control. HSF1 was quantified using Quantity One image software and normalized using GAPDH as loading control and referenced to control at 37 °C in the non-pathogenic STHdhQ7. (j) hsf1−/− MEFs transfected with WT HSF1 or S303A mutant and Fbxw7-FLAG; samples immunoprecipitated with anti-FLAG and HSF1 detected. (k) hsf1−/− MEFs expressing Dox-inducible Htt-Q74-GFP transfected with WT HSF1 or HSF1-S303A HS and 1 h recovery at 37 °C for 7 h. HSF1 was quantified using Quantity One image software and normalized using GAPDH as loading control and referenced to control (−Dox) expressing WT HSF1. See Supplementary Fig. 9 for uncropped immunoblots.
Figure 3
Figure 3. CK2 kinase modulates human HSF1 activity and stability in yeast.
(a) Experimental design of humanized HSF1 yeast screen for kinase inhibitors that promote yeast HSF1-dependent growth. (b) Yeast cells expressing human HSF1 cultivated with ser-thr kinase inhibitors and growth (OD600 nm) monitored over 4 days. Data presented correspond to results at 20 nM concentration. Similar results were obtained at other tested drug concentrations from 2 nM to 20 μM. DMSO was negative control and HSF1A used as positive control. (a=Ser/Thr kinases, b=Try kinases). Error bars represent±s.e.m., (n=4). (c) Yeast CK2 holoenzyme subunit composition and function. (d) Experimental design of humanized HSF1 yeast screen for CKB1 deletion that promote yeast HSF1-dependent growth. (e) WT and CKB1 mutant strain (ckb1Δ) grown in SC-His or 5-FOA medium for 3 days at 30 °C. (f) Protein extracts from WT (CKB1) and mutant strain (ckb1Δ) immunoblotted for human HSF1 using Pgk as loading control. (g) Summary of human HSF1 phosphorylation sites mediated by recombinant CK2α, CK2α′ or CK2 holoenzyme in vitro and analysed by phosphoproteomics, where (+) indicates detection of phosphorylation, DBD; DNA binding domain; LZ1-3 and LZ4; leucine zipper domains. (h) Yeast expressing WT human HSF1, S303A or S303/S307A mutants grown in glucose with DMSO or 10 μM TID43 and OD600 nm monitored over 4 days. Statistical significance was measured 4 days of growth. Error bars represent±s.e.m., (n=3). Unpaired t-test; NS, no significant; *P<0.05, ***P<0.001.
Figure 4
Figure 4. Mammalian CK2 inhibition ameliorates HSF1 degradation and mHtt aggregation and death in a cellular HD model.
(a) Mammalian CK2 holoenzyme subunit composition and function. (b) Htt-Q74 cells treated with CK2 kinase inhibitors TID43 or (c) Emodin 24 h before Htt-Q74 induction with Dox and heat shocked at 42 °C for 1 h followed by recovery at 37 °C for 7 h and extracts analysed by immunoblotting for Hsp70 and GAPDH. (d) Htt-Q74 cells treated with 5 μM TID43 and immunoblotted for HSF1 and P-HSF1-S303. (e) Fluorescent images for GFP-Htt-Q74 analysed microscopically in cells treated with DMSO or 1 μM TID43 as described in B. Scale bar: 200 μm. (f) Quantification of cells containing GFP-Htt-Q74 aggregates from E expressed as percentage of total number of cells evaluated. Error bars represent±s.e.m., (n=500 cells). Unpaired t-test **P<0.05. (g) hsf1−/− MEFs expressing Dox-inducible Htt-Q74-GFP transfected with pcDNA or WT HSF1 and incubated with 1 μM TID43 24 h before Htt-Q74-GFP induction followed by heat shock at 42 °C during 1 and 7 h recovery at 37 °C. Cell viability expressed as % of viable cells under control conditions at 37 °C. Error bars represent±s.e.m., (n=3). Unpaired t-test n.s., no significant, *P<0.05, **P<0.01). (h) Htt-Q74 cells were transfected with siRNA against CK2β regulatory subunit or (i) CK2α and/or CK2α′ catalytic subunits using scrambled siRNA (Scr) as control 24 h before Htt-Q74 induction during 2 days followed by heat shock at 42 °C 1 h and recovery at 37 °C, 7 h. HSF1 was quantitated as in (F2H). All immunoblots shown for each panel contain the samples from the same membrane and were cropped to show only relevant data. See Supplementary Fig. 10 for uncropped immunoblots.
Figure 5
Figure 5. CK2α′ abundance is elevated in Huntington's disease.
(a) CK2α, CK2α′ and CK2β protein levels in Htt-Q74 expressing cells under control (c) or heat shock conditions at 42 °C for 1 h (HS). CK2 subunit abundance was quantified using Quantity One image software normalized using GAPDH as loading control. CK2α′ ratio is shown and referenced to control (−Dox) cells. (b) CK2α, CK2α′ and CK2β striatal mRNA levels from WT and KIQ175 mice at 6 months of age. The value given for the amount of mRNA in the control group (WT) was set as 1. Error bars represent mean±s.e.m., (n=4 animals). Values for the KIQ175 group were compared to the WT group. Statistical significance was measured by two-tailed unpaired t-test *P<0.05. (c) Protein levels for CK2α, CK2α′ and CK2β in the striatum and (d) gastrocnemius muscle of WT and KIQ175 mice at 6 months of age (n=4). (e) Coronal section of the striatum of WT and KIQ175 at 6 months of age, showing co-localization of CK2α′ (red) with Ctip2 (green) and Fox1p (magenta) labelled MSNs in merged image. Scale bar: 10 μm. (f) CK2α, CK2α′ and CK2β qRT-PCR analysis and (g) protein levels in the striatum of HD patients and sex-age matched controls from 3 biospecimen banks (Supplementary Table 1). The value given for the amount of mRNA in the control group (C) was set as 1 for each gene. Error bars represent mean±s.e.m., (n=7). One-tailed unpaired t-test *P<0.05, **P<0.05, NS, no significant. Values for the Huntington's disease (HD) group were compared to the control (C) group. CK2α′ bands from immunoblots were quantified using Quantity One image software (BioRad) and the protein values were normalized using GAPDH as loading control and referenced to the corresponding age-sex-matched control patient. See Supplementary Fig. 11 for uncropped immunoblots.
Figure 6
Figure 6. Decreased abundance of HSF1 and increased levels of CK2α′ and Fbxw7 in mouse striatal neurons and differentiated human iPSCs expressing polyQ-expanded Htt.
(a) Mouse STHdh Q7 and Q111 cells were cultured at 33 °C for 48 h. (b) Human iPSC from 33Q (Control) and 60Q (HD) individuals were differentiated into MSNs for 54 days as previously described, and transferred to minimal differentiation medium with (+) or without (−) BDNF for 48 h. Protein samples were immunoblotted for the indicated proteins. See Supplementary Fig. 12 for uncropped immunoblots.
Figure 7
Figure 7. CK2α′ heterozygosity increases HSF1 abundance and activity in HD mice.
(a) Mouse breeding scheme to generate WT, KIQ175, CK2α′ +/− and KIQ175/CK2α′ +/− mice. (b) CK2α, CK2α′ and CK2β mRNA levels from KIQ175 and KIQ175/CK2α′ +/− striatum at 6 months. Data was normalized to GAPDH and referenced to WT. (c) Chaperones Hsp70 and Hsp25 and (d) Mitochondrial activity-related genes PGC-1α, CYCS, NDUFS3 and TFAM mRNA levels from the striatum of KIQ175 and KIQ175/CK2α′+/− at 6 months. (e) Immunoblots of striatum from KIQ175, WT, KIQ175/CK2α′+/− and CK2α′+/− at 6 months. (f) WT and mutant Htt immunoblot analysis from striatum of KIQ175, WT, KIQ175/CK2α′+/− and CK2α′+/− at 6 months. Long and Short exposures are presented. mRNA data shows fold change compared to the control group (WT; Supplementary Fig. 6) which values were set as 1. Error bars represent mean±s.e.m., (n=3 animals). Unpaired t-test *P<0.05, **P<0.05. Values for the KIQ175/CK2α′(+/−) group were compared to the KIQ175 group. See Supplementary Fig. 12 for uncropped immunoblots.
Figure 8
Figure 8. CK2α′ heterozygosity ameliorates biochemical and neurobiological defects in KI175 HD mice.
(a,b) Dendrite spine number and morphology of MSNs in the dorsal-striatum of KIQ175 and KIQ175/CK2α′+/− at 6 months. Scale bar, 10 μm. Error bars indicate mean±s.e.m., (n=12 cells/animal, 3 animals/genotype). Unpaired t-test *P<0.05, **P<0.01. (c) Excitatory synapse input in the dorsal striatum. (d) Immunostaining of the cortico-striatal pre-synaptic marker (VGlut1, red), the thalamo-striatal pre-synaptic marker (VGlut2, red) and the post-synaptic marker PSD95 (green) in the dorsal-striatum of KIQ175, WT, KIQ175/CK2α′+/−, and CK2α′+/− at 6 months. Scale bar, 10 μM. (e) Quantification of VGlut1-PSD95 and (f) VGlut2-PSD95 co-localized synaptic puncta from B. Error bars indicate mean±s.e.m., (n=3 animals per genotype, 3 sections per animal, 15 sections per scan). Unpaired t-test *P<0.05, **P<0.01. (g,h) Size and body weight of KIQ175 (n=6), WT (n=8), KIQ175/CK2α′+/− (n=11) and CK2α′+/− (n=11) at 6 months. Error bars indicate±s.e.m. Unpaired t-test *P<0.05.
Figure 9
Figure 9. Model for HSF1 degradation in Huntington's Disease.
mHtt expression increases the abundance sof CK2α′ kinase and the Fbxw7 Fbox protein. CK2α′ phosphorylates HSF1 S303 and S307, inactivating HSF1 transcriptional activity and recruiting the Fbxw7 E3 ligase. The E3 ligase complex ubiquitinylates HSF1, targeting the protein for proteasomal degradation. Decreased HSF1 levels compromise the expression of HSF1 target genes that are essential for coping with misfolded and aggregated mHtt in Huntington's Disease and for neuronal function and survival.

References

    1. The Huntington's Disease Collaborative Research Group. A novel gene containing a trinucleotide repeat that is expanded and unstable on Huntington's disease chromosomes. Cell 72, 971–983 (1993). - PubMed
    1. Novak M. J. & Tabrizi S. J. Huntington's disease. BMJ 340, c3109 (2010). - PubMed
    1. Saudou F. & Humbert S. The biology of huntingtin. Neuron 89, 910–926 (2016). - PubMed
    1. Sassone J., Colciago C., Cislaghi G., Silani V. & Ciammola A. Huntington's disease: the current state of research with peripheral tissues. Exp. Neurol. 219, 385–397 (2009). - PubMed
    1. Landles C. & Bates G. P. Huntingtin and the molecular pathogenesis of Huntington's disease. Fourth in molecular medicine review series. EMBO Rep. 5, 958–963 (2004). - PMC - PubMed

Publication types

Substances