

Reassessment of Non-Monosynaptic Excitation from the Motor Cortex to Motoneurons in Single Motor Units of the Human Biceps Brachii
- PMID: 28194103
- PMCID: PMC5276998
- DOI: 10.3389/fnhum.2017.00019
Reassessment of Non-Monosynaptic Excitation from the Motor Cortex to Motoneurons in Single Motor Units of the Human Biceps Brachii
Abstract
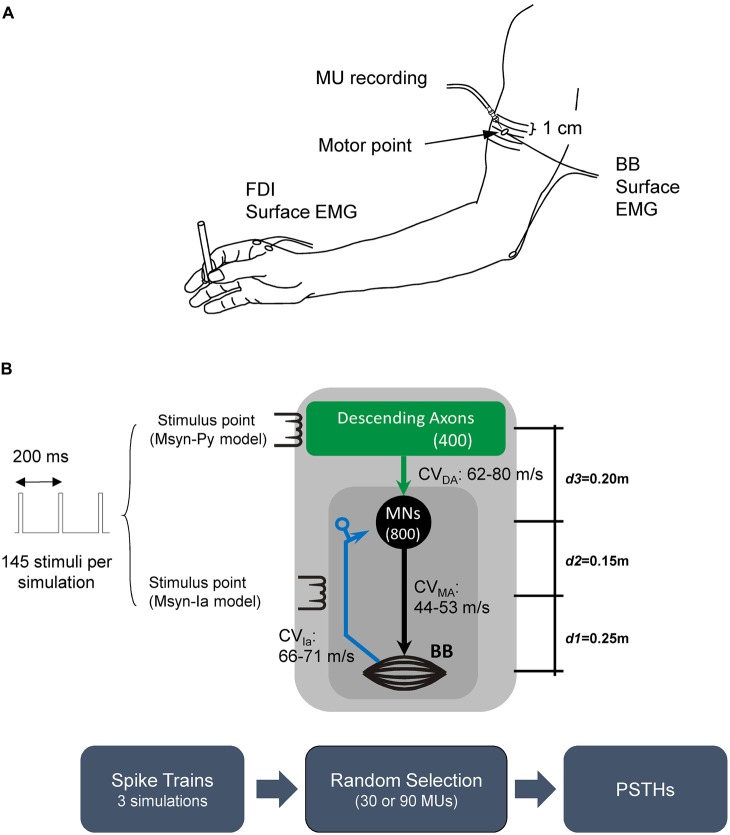
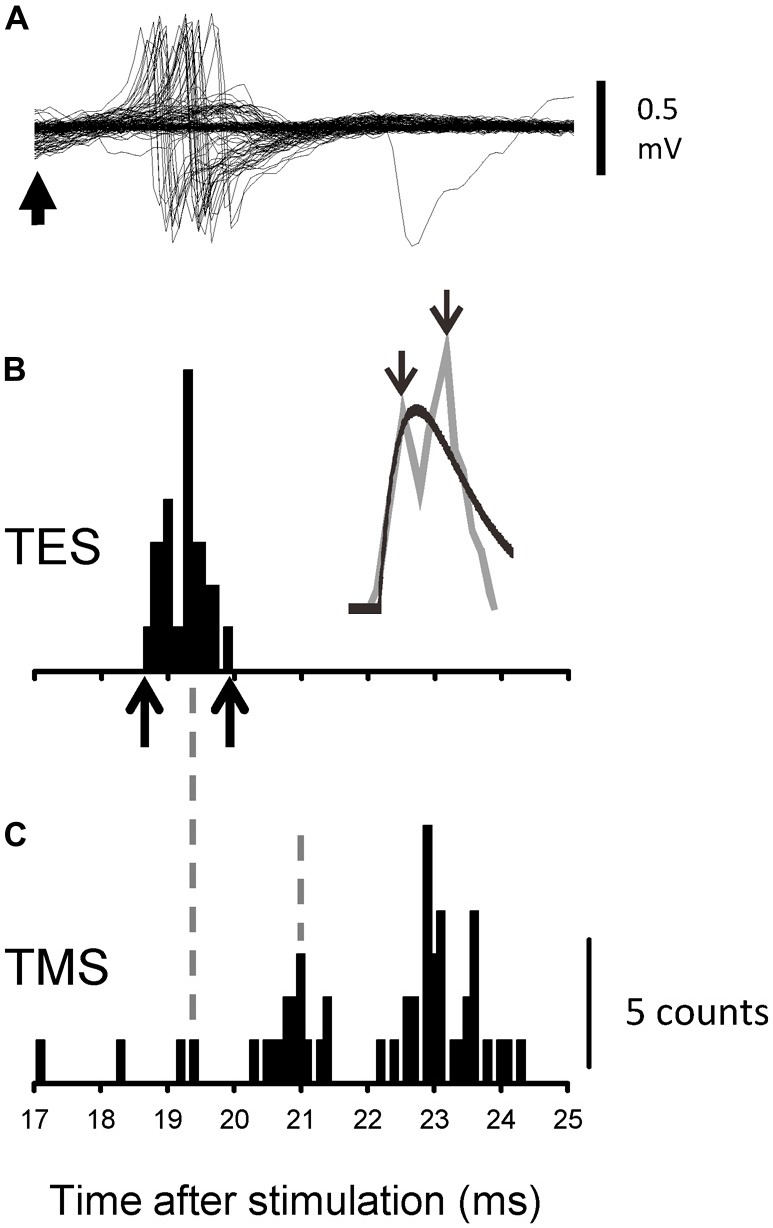
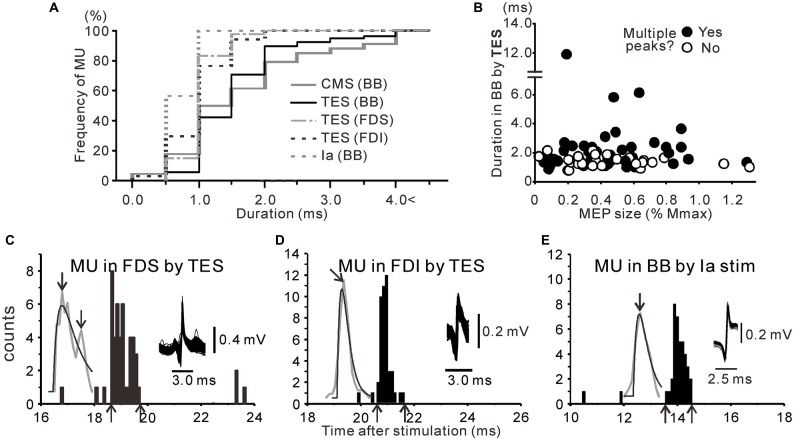
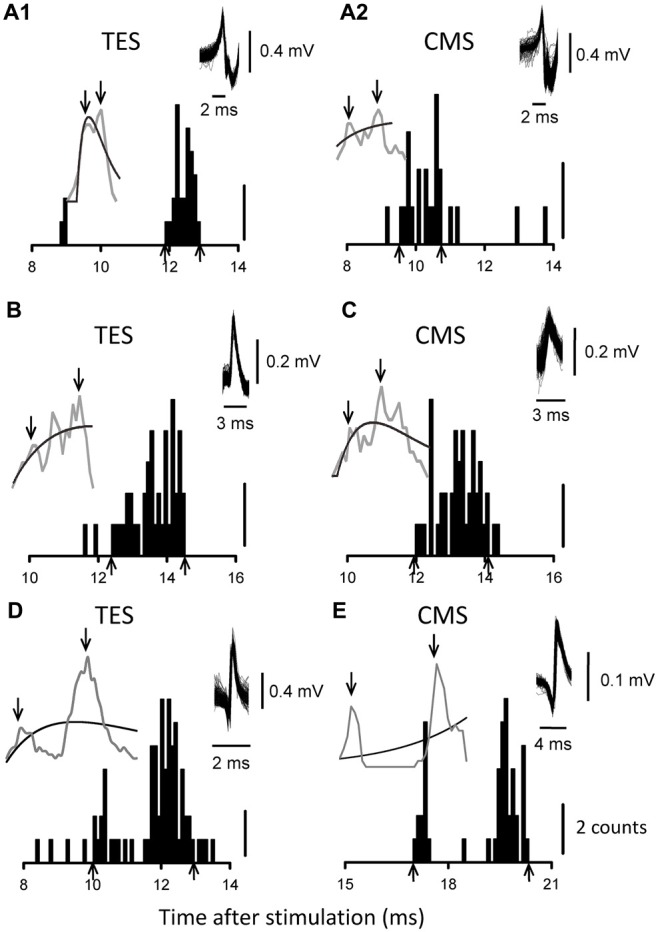
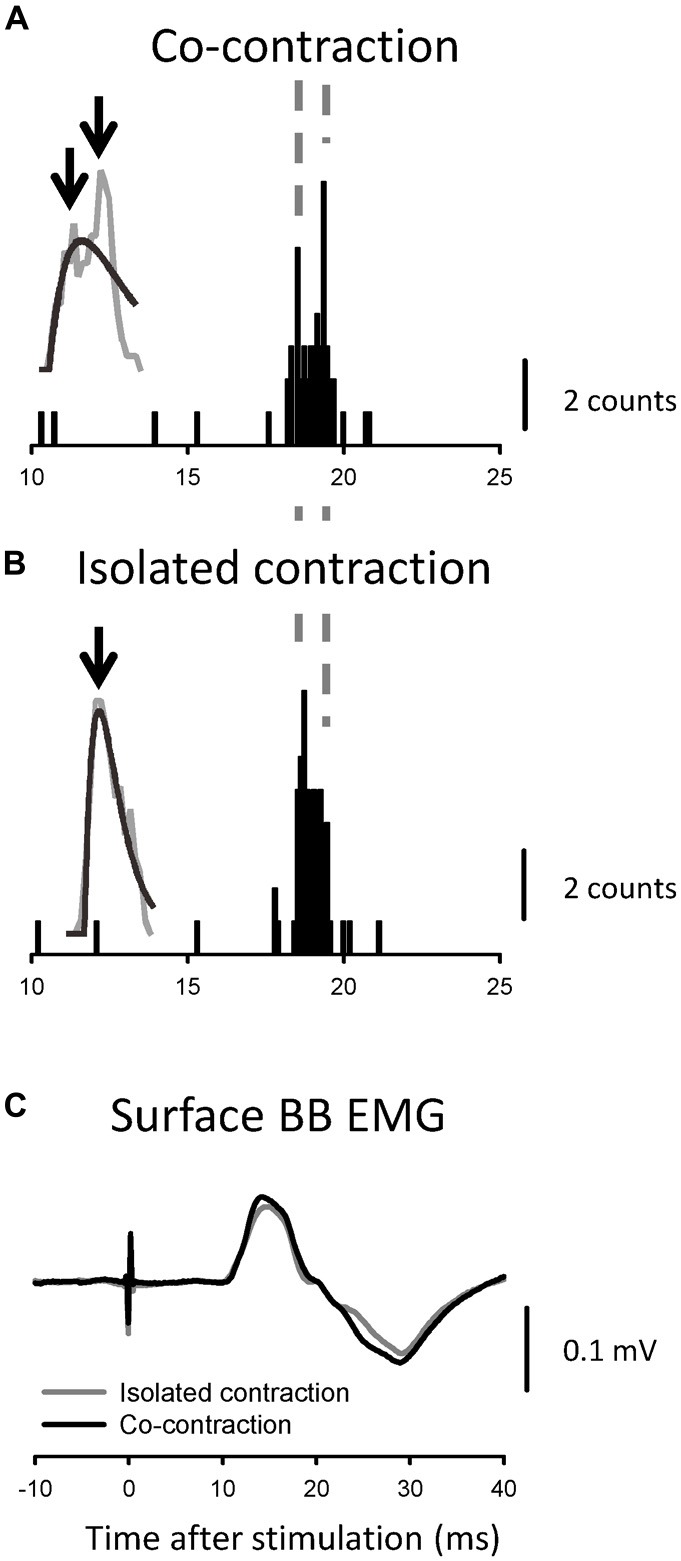
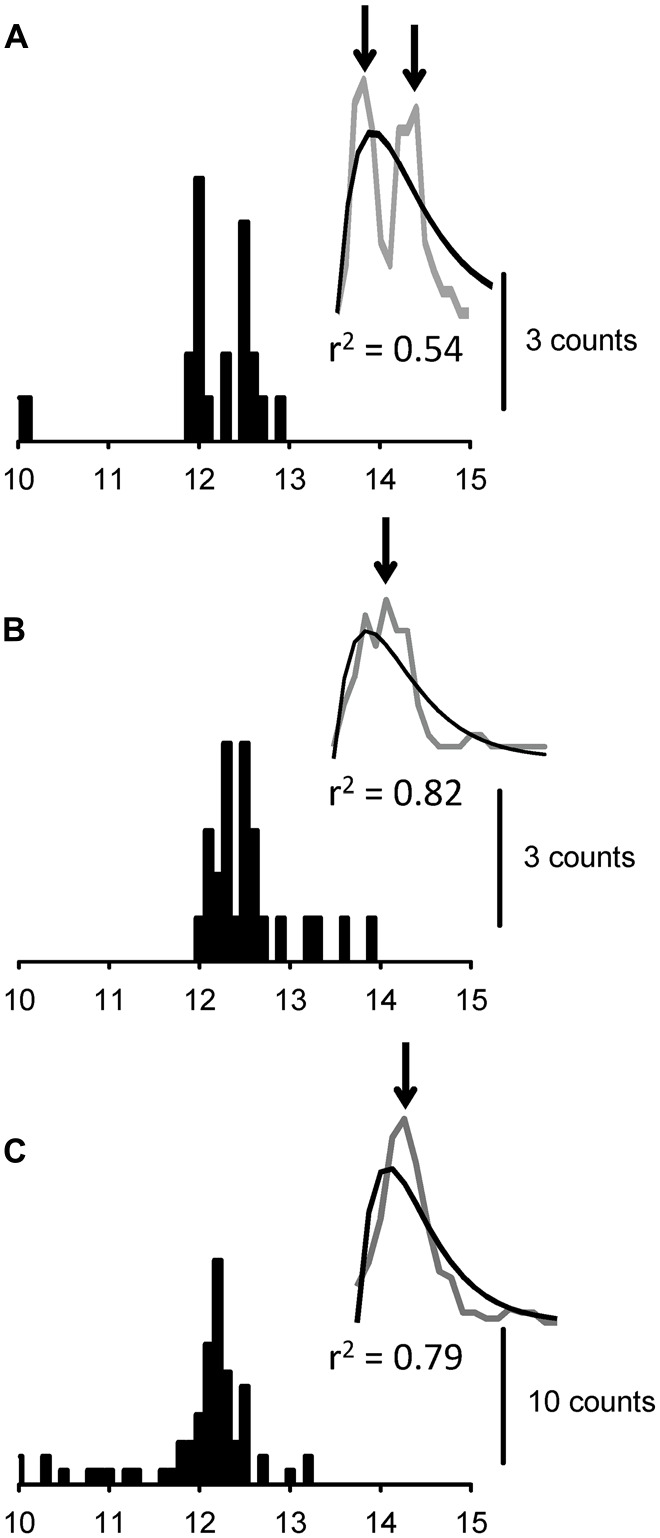
Corticospinal excitation is mediated by polysynaptic pathways in several vertebrates, including dexterous monkeys. However, indirect non-monosynaptic excitation has not been clearly observed following transcranial electrical stimulation (TES) or cervicomedullary stimulation (CMS) in humans. The present study evaluated indirect motor pathways in normal human subjects by recording the activities of single motor units (MUs) in the biceps brachii (BB) muscle. The pyramidal tract was stimulated with weak TES, CMS, and transcranial magnetic stimulation (TMS) contralateral to the recording side. During tasks involving weak co-contraction of the BB and hand muscles, all stimulation methods activated MUs with short latencies. Peristimulus time histograms (PSTHs) showed that responses with similar durations were induced by TES (1.9 ± 1.4 ms) and CMS (2.0 ± 1.4 ms), and these responses often showed multiple peaks with the PSTH peak having a long duration (65.3% and 44.9%, respectively). Such long-duration excitatory responses with multiple peaks were rarely observed in the finger muscles following TES or in the BB following stimulation of the Ia fibers. The responses obtained with TES were compared in the same 14 BB MUs during the co-contraction and isolated BB contraction tasks. Eleven and three units, respectively, exhibited activation with multiple peaks during the two tasks. In order to determine the dispersion effects on the axon conduction velocities (CVs) and synaptic noise, a simulation study that was comparable to the TES experiments was performed with a biologically plausible neuromuscular model. When the model included the monosynaptic-pyramidal tract, multiple peaks were obtained in about 34.5% of the motoneurons (MNs). The experimental and simulation results indicated the existence of task-dependent disparate inputs from the pyramidal tract to the MNs of the upper limb. These results suggested that intercalated interneurons are present in the spinal cord and that these interneurons might be equivalent to those identified in animal experiments.
Keywords: humans; motor unit; primary motor cortex (M1); pyramidal tract; transcranial electrical stimulation (TES); transcranial magnetic stimulation (TMS).
Figures
Similar articles
-
Visual information increases the indirect corticospinal excitation via cervical interneurons in humans.J Neurophysiol. 2021 Mar 1;125(3):828-842. doi: 10.1152/jn.00425.2020. Epub 2021 Jan 27. J Neurophysiol. 2021. PMID: 33502947
-
Evaluation of transcranial magnetic stimulation for investigating transmission in descending motor tracts in the rat.Eur J Neurosci. 2007 Feb;25(3):805-14. doi: 10.1111/j.1460-9568.2007.05326.x. Eur J Neurosci. 2007. PMID: 17328776
-
Investigation into non-monosynaptic corticospinal excitation of macaque upper limb single motor units.J Neurophysiol. 2001 Oct;86(4):1573-86. doi: 10.1152/jn.2001.86.4.1573. J Neurophysiol. 2001. PMID: 11600621
-
Investigating human motor control by transcranial magnetic stimulation.Exp Brain Res. 2003 Sep;152(1):1-16. doi: 10.1007/s00221-003-1537-y. Epub 2003 Jul 17. Exp Brain Res. 2003. PMID: 12879177 Review.
-
Noninvasive stimulation of the human corticospinal tract.J Appl Physiol (1985). 2004 Apr;96(4):1496-503. doi: 10.1152/japplphysiol.01116.2003. J Appl Physiol (1985). 2004. PMID: 15016794 Review.
Cited by
-
Pairing Transcranial Magnetic Stimulation and Loud Sounds Produces Plastic Changes in Motor Output.J Neurosci. 2023 Apr 5;43(14):2469-2481. doi: 10.1523/JNEUROSCI.0228-21.2022. Epub 2023 Mar 1. J Neurosci. 2023. PMID: 36859307 Free PMC article.
-
Vestibular stimulation-induced facilitation of cervical premotoneuronal systems in humans.PLoS One. 2017 Apr 7;12(4):e0175131. doi: 10.1371/journal.pone.0175131. eCollection 2017. PLoS One. 2017. PMID: 28388686 Free PMC article.
-
Bilateral Reflex Fluctuations during Rhythmic Movement of Remote Limb Pairs.Front Hum Neurosci. 2017 Jul 5;11:355. doi: 10.3389/fnhum.2017.00355. eCollection 2017. Front Hum Neurosci. 2017. PMID: 28725191 Free PMC article.
-
Evidence for Subcortical Plasticity after Paired Stimulation from a Wearable Device.J Neurosci. 2021 Feb 17;41(7):1418-1428. doi: 10.1523/JNEUROSCI.1554-20.2020. Epub 2021 Jan 13. J Neurosci. 2021. PMID: 33441436 Free PMC article.
-
Hand Dexterity Impairment in Patients with Cervical Myelopathy: A New Quantitative Assessment Using a Natural Prehension Movement.Behav Neurol. 2018 Jul 4;2018:5138234. doi: 10.1155/2018/5138234. eCollection 2018. Behav Neurol. 2018. PMID: 30073036 Free PMC article.
References
-
- Alstermark B., Isa T., Ohki Y., Saito Y. (1999). Disynaptic pyramidal excitation in forelimb motoneurons mediated via C3–C4 propriospinal neurons in the Macaca fuscata. J. Neurophysiol. 82, 3580–3585. - PubMed
-
- Alstermark B., Lundberg A. (1992). “The C3–C4 propriospinal system: target-reaching and food-taking,” in Muscle Afferents and Spinal Control of Movement, eds. Jami L., Pierrot-Deseilligny E., Zytnicki D. (Oxford, UK: Pergamon Press; ), 327–354.
LinkOut - more resources
Full Text Sources
Other Literature Sources