. 2015 Jun 30:2015:7.
doi: 10.1186/s13637-015-0025-6. eCollection 2015 Dec.

MOBAS: identification of disease-associated protein subnetworks using modularity-based scoring

Affiliations

MOBAS: identification of disease-associated protein subnetworks using modularity-based scoring

Marzieh Ayati et al. EURASIP J Bioinform Syst Biol. .

Abstract

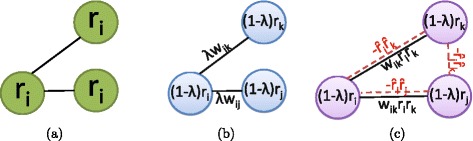
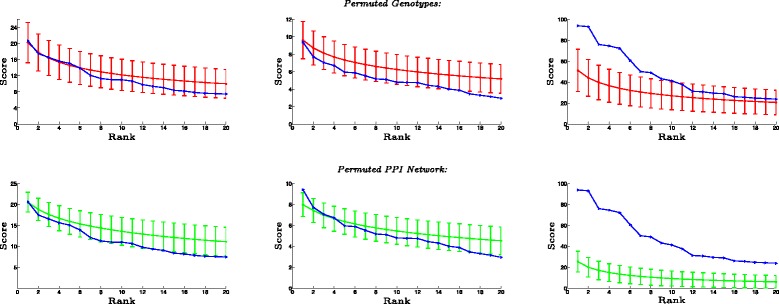
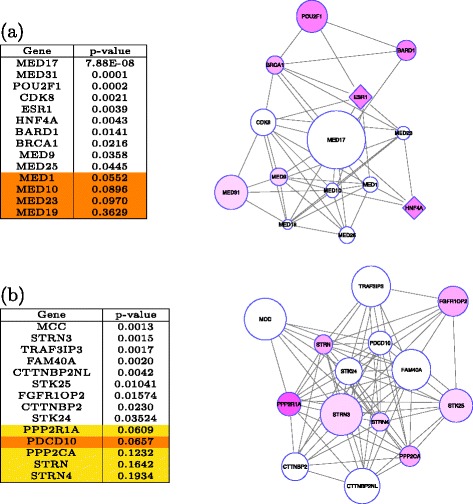
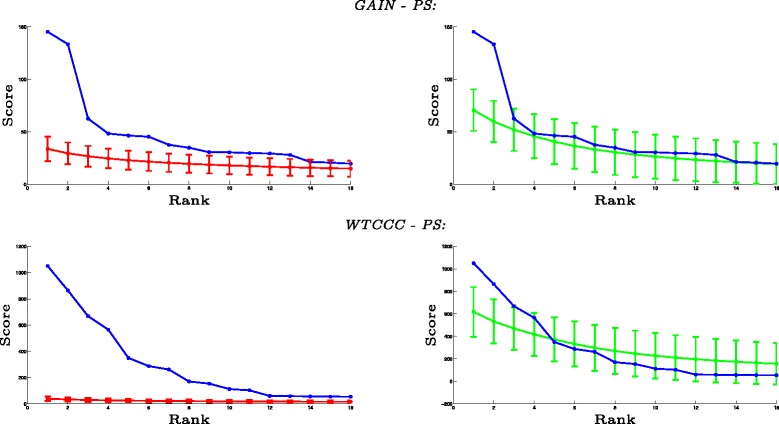
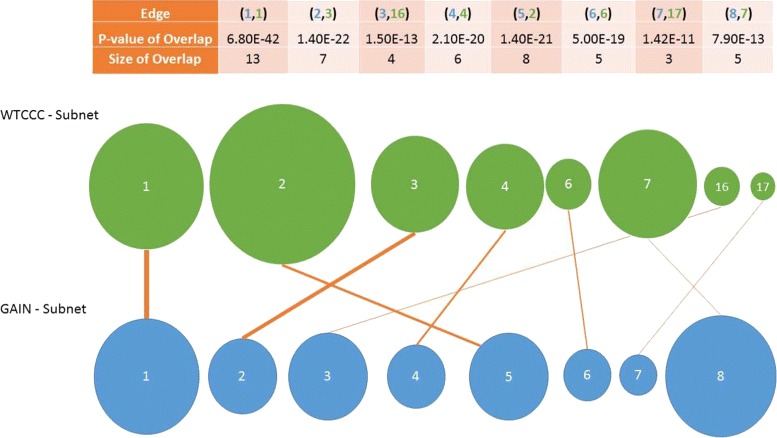
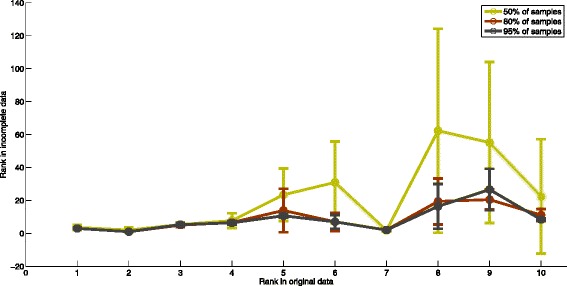
Network-based analyses are commonly used as powerful tools to interpret the findings of genome-wide association studies (GWAS) in a functional context. In particular, identification of disease-associated functional modules, i.e., highly connected protein-protein interaction (PPI) subnetworks with high aggregate disease association, are shown to be promising in uncovering the functional relationships among genes and proteins associated with diseases. An important issue in this regard is the scoring of subnetworks by integrating two quantities: disease association of individual gene products and network connectivity among proteins. Current scoring schemes either disregard the level of connectivity and focus on the aggregate disease association of connected proteins or use a linear combination of these two quantities. However, such scoring schemes may produce arbitrarily large subnetworks which are often not statistically significant or require tuning of parameters that are used to weigh the contributions of network connectivity and disease association. Here, we propose a parameter-free scoring scheme that aims to score subnetworks by assessing the disease association of interactions between pairs of gene products. We also incorporate the statistical significance of network connectivity and disease association into the scoring function. We test the proposed scoring scheme on a GWAS dataset for two complex diseases type II diabetes (T2D) and psoriasis (PS). Our results suggest that subnetworks identified by commonly used methods may fail tests of statistical significance after correction for multiple hypothesis testing. In contrast, the proposed scoring scheme yields highly significant subnetworks, which contain biologically relevant proteins that cannot be identified by analysis of genome-wide association data alone. We also show that the proposed scoring scheme identifies subnetworks that are reproducible across different cohorts, and it can robustly recover relevant subnetworks at lower sampling rates.

Keywords: Genome-wide association studies; Protein-protein interaction network; Statistical significance.


Figures

Fig. 1
Fig. 1
Illustration of existing and proposed scoring schemes. This figure shows the scoring schema for quantifying the disease association of protein subnetworks: a NODE-BASED scoring, b LINEAR COMBINATION of node scores and edge scores, c the proposed MODULARITY-BASED (MOBAS) scoring scheme. For each method, the score of subnetwork is computed as an aggregate of all quantities in the figure
Fig. 2
Fig. 2
Statistical significance of subnetworks. Statistical significance of high-scoring subnetworks identified using NODE-BASED scoring (first column), LINEAR COMBINATION of node scores and edge scores (second column), and MODULARITY-BASED (MOBAS) scoring (third column). The highest scoring 20 subnetworks identified using each scoring scheme are shown. The x-axis shows the rank of each subnetwork according to their score, and the y-axis shows its score. The blue curve shows the scores of the subnetworks identified on the WTCCC-T2D dataset. For each i on the x-axis, the red (green) curve and error bar in the first (second) row show the distribution of the scores of i highest scoring subnetworks in 100 datasets obtained by permuting the genotypes of the samples (permuting the interactions in the PPI networks while preserving node degrees)
Fig. 3
Fig. 3
Two significant subnetworks. a Top subnetwork and b second top subnetwork that are found to be significantly associated with T2D. The size of each node indicates the significance of the association of the corresponding protein with T2D (r v). The diamond nodes are those previously reported to be associated with T2D in the literature [28]. The intensity of purple coloring in the nodes indicates the number of computational disease gene prioritization methods [29] that identified the respective gene to be associated with T2D. The individual p values of each gene in the subnetwork are shown in the table left of the subnetwork. The genes with insignificant p value (p>0.05) that are known to be related to T2D are highlighted in yellow. The genes with insignificant p value and are not reported to be related to T2D are highlighted in orange. These genes are the candidates for further investigation
Fig. 4
Fig. 4
The statistical significance of high-scoring subnetworks using MOBAS on psoriasis dataset. The highest scoring 16 subnetworks identified using MOBAS are shown. The x-axis shows the rank of each subnetwork according to their score, and the y-axis shows its score. The first row shows the result of MOBAS on GAIN–PS dataset, and the second row shows the result on WTCCC–PS dataset. The blue curve shows the scores of the subnetworks identified on the dataset. For each i on the x-axis, the red (green) curve and error bar show the distribution of the scores of i highest scoring subnetworks in 100 datasets obtained by permuting the genotypes of the samples (permuting the interactions in the PPI networks while preserving node degrees)
Fig. 5
Fig. 5
Reproducibility of identified subnetworks using MOBAS in two independent datasets. The size of the circles represents the size of identified subnetwork. The thickness of the edges represents the significance of overlap between the two subnetwork based on hypergeometric distribution
Fig. 6
Fig. 6
Robustness of MOBAS. The relation between the rank of the subnetwork in original data with rank of the subnetworks in incomplete data in ten different runs. Different colors represent different percentages of missing samples

References

    1. Altshuler D, Daly MJ, Lander ES. Genetic mapping in human disease. Science. 2008;322(5903):881–888. doi: 10.1126/science.1156409. - DOI - PMC - PubMed
    1. Baranzini SE, Galwey NW, Wang J, Khankhanian P, Lindberg R, Pelletier D, Wu W, Uitdehaag BM, Kappos L, Polman CH, et al. Pathway and network-based analysis of genome-wide association studies in multiple sclerosis. Hum. Mol. Genet. 2009;18(11):2078–2090. doi: 10.1093/hmg/ddp120. - DOI - PMC - PubMed
    1. Jia P, Zheng S, Long J, Zheng W, Zhao Z. dmgwas: dense module searching for genome-wide association studies in protein–protein interaction networks. Bioinformatics. 2011;27(1):95–102. doi: 10.1093/bioinformatics/btq615. - DOI - PMC - PubMed
    1. Torkamani A, Topol EJ, Schork NJ. Pathway analysis of seven common diseases assessed by genome-wide association. Genomics. 2008;92(5):265–272. doi: 10.1016/j.ygeno.2008.07.011. - DOI - PMC - PubMed
    1. Wang K, Li M, Bucan M. Pathway-based approaches for analysis of genomewide association studies. Am. J. Hum. Genet. 2007;81(6):1278–1283. doi: 10.1086/522374. - DOI - PMC - PubMed

LinkOut - more resources