. 2017 Feb 14:8:14428.
doi: 10.1038/ncomms14428.

Foxa2 identifies a cardiac progenitor population with ventricular differentiation potential

Affiliations

Foxa2 identifies a cardiac progenitor population with ventricular differentiation potential

Evan Bardot et al. Nat Commun. .

Abstract

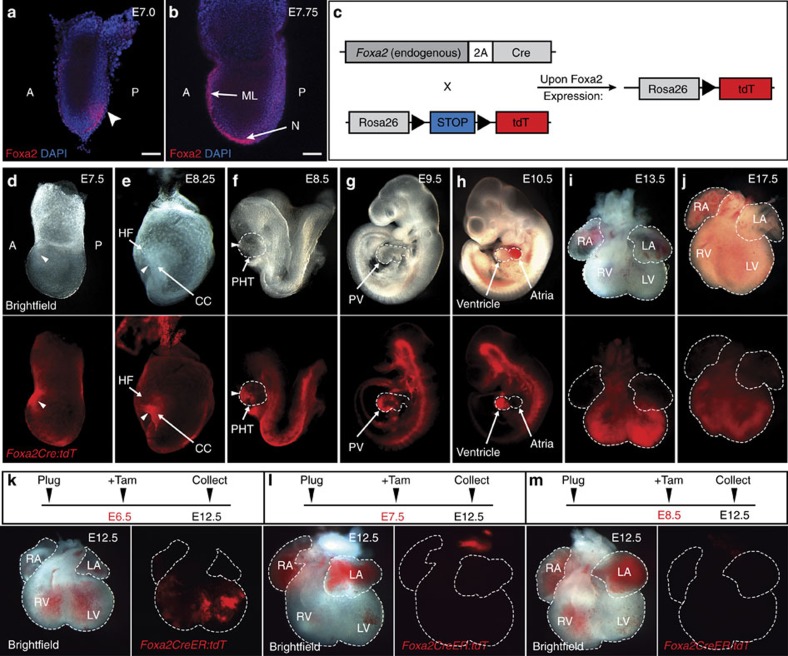
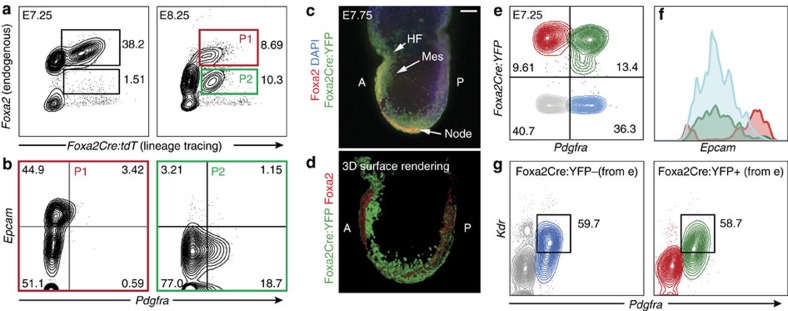
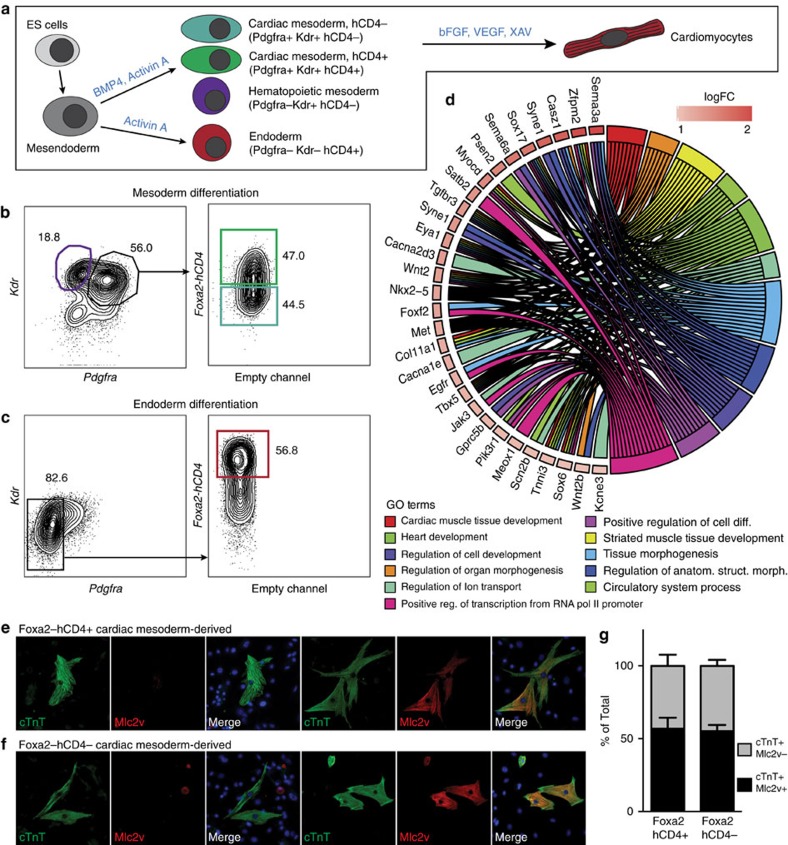
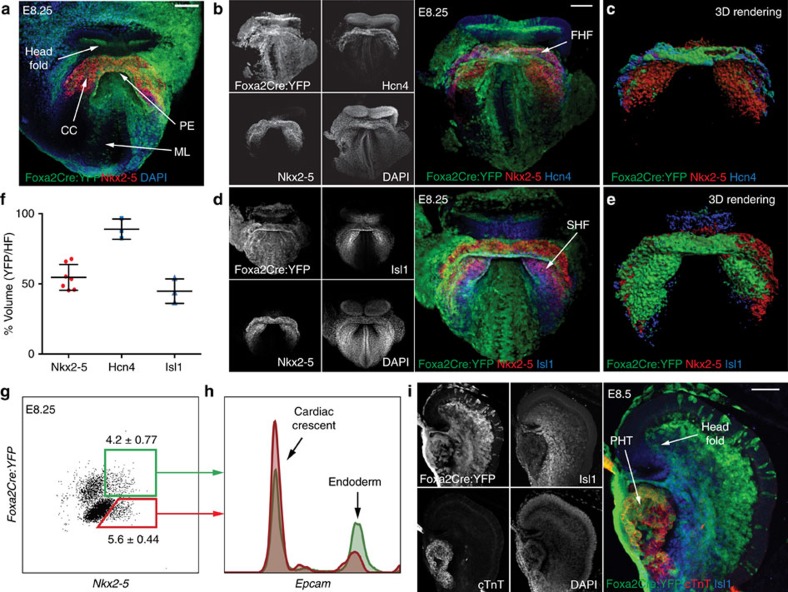
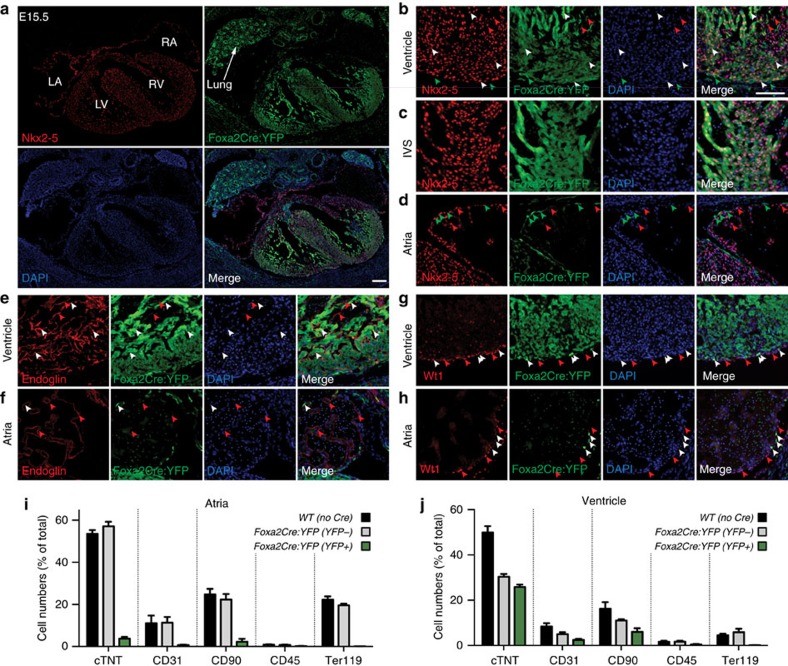
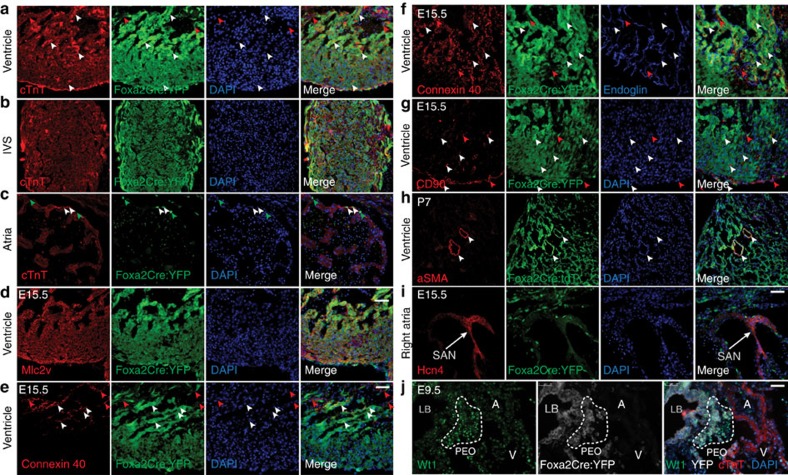
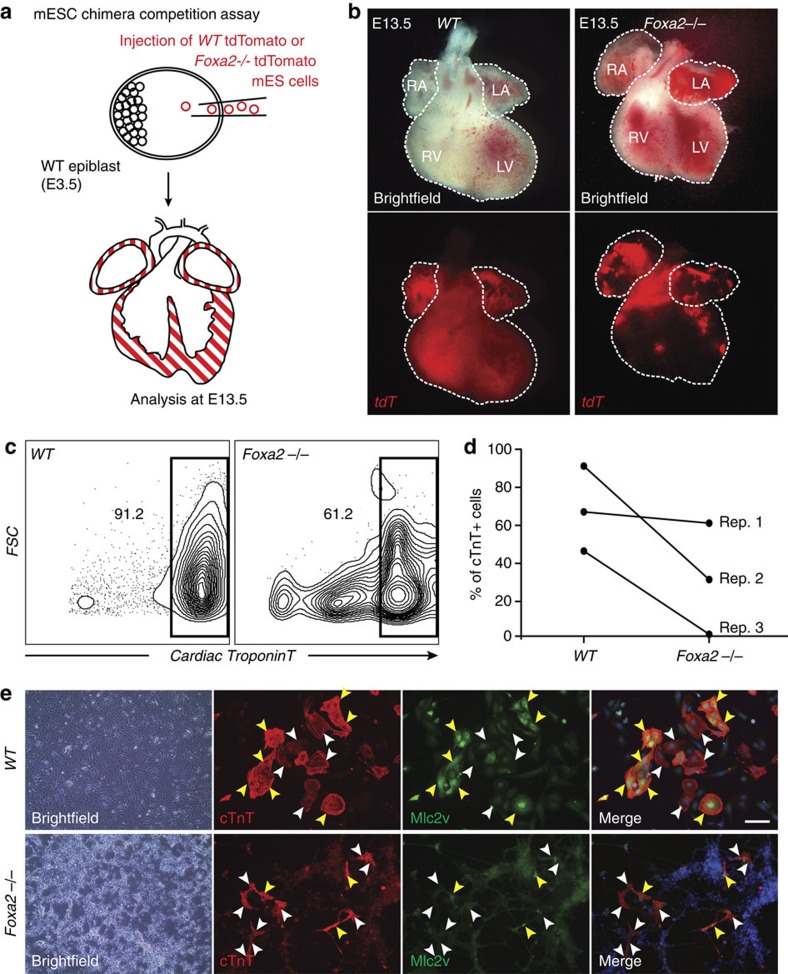
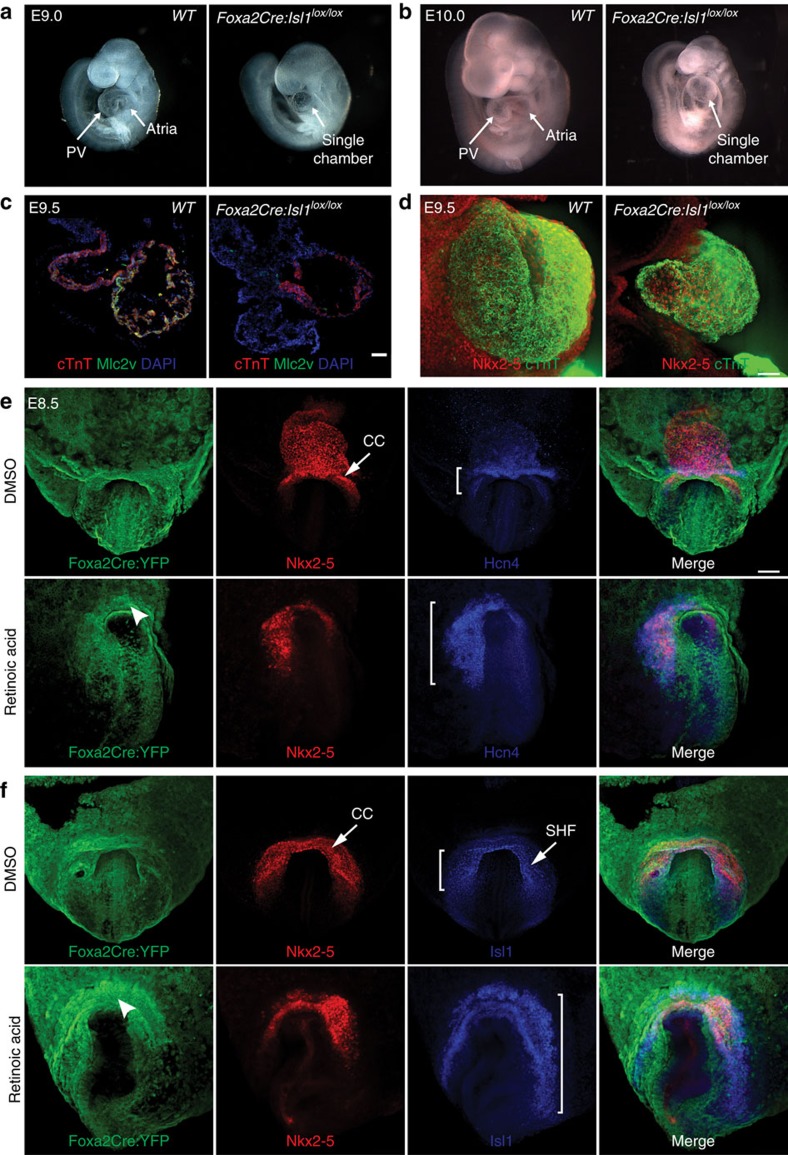
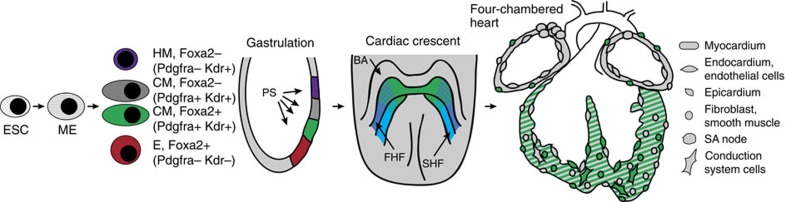
The recent identification of progenitor populations that contribute to the developing heart in a distinct spatial and temporal manner has fundamentally improved our understanding of cardiac development. However, the mechanisms that direct atrial versus ventricular specification remain largely unknown. Here we report the identification of a progenitor population that gives rise primarily to cardiovascular cells of the ventricles and only to few atrial cells (<5%) of the differentiated heart. These progenitors are specified during gastrulation, when they transiently express Foxa2, a gene not previously implicated in cardiac development. Importantly, Foxa2+ cells contribute to previously identified progenitor populations in a defined pattern and ratio. Lastly, we describe an analogous Foxa2+ population during differentiation of embryonic stem cells. Together, these findings provide insight into the developmental origin of ventricular and atrial cells, and may lead to the establishment of new strategies for generating chamber-specific cell types from pluripotent stem cells.


Conflict of interest statement

The authors declare no competing financial interests.

Figures

Figure 1
Figure 1. Lineage tracing of Foxa2-expressing cells during mouse development.
(a,b) Representative confocal images of WMIF of E7.0 (a) and E7.75 (b) embryos with antibodies against Foxa2. Embryos were counterstained with 4,6-diamidino-2-phenylindole (DAPI) to label nuclei. Arrowhead shows the presumptive cardiogenic region of the PS. Scale bars, 75 μm. (c) Schematic of the Foxa2 lineage-tracing system that results in permanent labelling of all cells that express Foxa2 during development. (dj) Whole-mount imaging of Foxa2Cre lineage-tracing embryos (dh) or dissected hearts (i,j). Foxa2Cre embryos crossed with R26-tdT show labelling of the ventricular portion of the developing heart tube and heart. (km) Whole-mount imaging of dissected hearts of Foxa2CreER;tdT embryos. Tam (0.05 mg g−1) was injected at E6.5 (k), E7.5 (l) or E8.5 (m) and embryos were collected at E12.5. Dashed lines outline the heart tube (fh) or the heart chambers (im). A, anterior; CC, cardiac crescent; HF, head folds; LA, left atria; LV, left ventricle; ML, midline; N, node; P, posterior; PHT, primitive heart tube; PV, primitive ventricle; RA, right atria; RV, right ventricle.
Figure 2
Figure 2. Foxa2 expression marks a transient progenitor population during gastrulation that gives rise to CM.
(a) Flow cytometry analysis of dissociated E7.25 (left) or E8.25 (right) Foxa2Cre:tdT embryos. Cells were stained with antibodies against endogenous Foxa2, which was compared with the Foxa2Cre:tdT lineage tracing marker. (b) Foxa2+tdT+(P1, left panel) and Foxa2-tdT+(P2, right panel) cells from E8.25 embryos were further analysed with antibodies against Epcam (endoderm) and Pdgfra (mesoderm). (c) Confocal z-projection of E7.75 Foxa2Cre:YFP embryo analysed by WMIF using antibodies against YFP and Foxa2. Scale bar, 75 μm. (d) Three-dimensional (3D) surface rendering of image shown in c generated using Imaris software. (eg) Flow cytometry analysis of dissociated E7.25 Foxa2Cre:YFP embryos with antibodies against Pdgfra, Epcam and Kdr. Cells were first gated based on expression of YFP and Pdgfra (e). The resulting quadrants were then plotted on a histogram for Epcam (f) to assess for endodermal identity of the cells. In addition, the YFP− (grey/blue) and YFP+ (green/red) cells were separately analysed for expression of the CM markers Pdgfra and Kdr (g). A, anterior; P, posterior; HF, head folds; Mes, mesoderm.
Figure 3
Figure 3. Foxa2+ CM cells can be identified and characterized during mESC differentiation.
(a) Schematic of mESC in vitro differentiation protocols to the cardiovascular and endoderm lineages. Mesoderm cells are generated through addition of Bmp4 and Activin A, whereas endoderm cells are generated through addition of high levels of Activin A. CM is specified to the cardiomyocyte lineage through addition of basic fibroblast growth factor (bFGF), vascular endothelial growth factor (VEGF) and XAV. (b,c) Fluorescence-activated cell sorting (FACS) strategies for the isolation of Foxa2+ and Foxa2− CM (green and teal gates, respectively), Kdrhigh haematopoietic mesoderm (purple gate) or Foxa2+ endoderm (red gate) at day 5 of differentiation. (d) Chord plot showing a selection of genes upregulated in Foxa2+ CM (over Foxa2− CM) present in the represented enriched GO terms. Outer ring shows log2 fold change (left, key at upper right) or GO term grouping (right, key below). Chords connect gene names with GO term groups. (e,f) IF analysis of differentiated cardiomyocytes generated from Foxa2+ (e) or Foxa2− (f) CM showing expression of cTnT and Mlc2v. Images show typical cells generated in each condition. (g) Quantification of experiments in (e/f) (n=3 differentiations, error bars reflect s.e.m.).
Figure 4
Figure 4. Foxa2-vCPs contribute to the FHF and SHF during heart morphogenesis.
(a) Confocal z-projection of E8.25 Foxa2Cre:YFP embryos analysed by WMIF using antibodies against YFP and Nkx2–5. (be) WMIF analysis of E8.25 Foxa2Cre:YFP embryos with antibodies against Hcn4 (b) or Isl1 (d), and three-dimensional (3D) surface renderings of the CC region as generated with Imaris software (c,e). Representative stage-matched embryos are shown. (f) Quantification of the volume of the 3D surface rendering showing the YFP volume as a percentage of the total CC (Nkx2–5), FHF (Hcn4) or SHF (Isl1). Error bars reflect s.d. (g) Flow cytometric analysis of dissociated E8.25 Foxa2Cre:YFP embryos with antibodies against Nkx2–5. (h) Analysis of Nkx2–5+YFP+ and Nkx2–5+YFP− cell based on Epcam expression. (i) WMIF analysis of E8.5 Foxa2Cre:YFP embryo with antibodies against Isl1 and cTnT. CC, cardiac crescent; FHF, first heart field; ML, midline; PE, pharyngeal endoderm; PHT, primitive heart tube; SHF, second heart field. Scale bars, 100 μm.
Figure 5
Figure 5. Contribution of Foxa2-vCPs to the major cardiovascular lineages.
(a) Heart sections from E15.5 Foxa2Cre:YFP embryos stained with antibodies against YFP and Nkx2–5 to label cardiomyocytes. Tile scan image showing heart and lung. (bh) IF analysis of E15.5 Foxa2Cre:YFP embryos using antibodies against YFP and Nkx2–5 (myocardium, bd), Endoglin (endocardium, e,f) or Wt1 (epicardium, g,h). Detailed areas of ventricle (b,e,g), interventricular septum (c) and atria (d,f,h) are shown. Arrowheads indicate cells that express the relevant lineage markers alone (red) or that co-express YFP and the relevant lineage marker (white). Images are representative examples from multiple experiments. (i,j) Flow cytometry analysis of dissociated cells of atrial (i) and ventricular (j) chambers of E13.5 Foxa2Cre:YFP hearts with antibodies against cTnT (cardiomyocytes), CD31 (endothelial), CD90 (mesenchymal, haematopoietic, fibroblast, epicardium), CD45 (leukocyte) and Ter119 (erythroid). Data are mean±s.e.m. of n=7 hearts. Scale bars, 100 μm. LA, left atria; LV, left ventricle; RA, right atria; RV, right ventricle.
Figure 6
Figure 6. Contribution of Foxa2-vCPs cells to the differentiated lineages in the heart.
(ai) IF analysis of E15.5 embryos (ag,i) or P7 hearts (h) using antibodies against YFP or tdT and cTnT (cardiomyocytes, ac) Mlc2v (ventricular-specific ion channel, d), Connexin 40 (conduction system, e), Connexin 40 and Endoglin (conduction and endothelial cells, f), CD90 (fibroblasts and epicardium, g), aSMA (smooth muscle, h) or Hcn4 (SA node, i). (j) IF analysis of E9.5 embryos with antibodies against Wt1 (PEO). Arrowheads indicate cells that express the relevant markers (red) or that co-express YFP and the relevant marker (white). Dashed line indicates the area of the PEO at E9.5. All images shown are representative of multiple experiments. A, atria; LB, liver bud; PEO, proepicardial organ; V, ventricle. Scale bars, 50 μm.
Figure 7
Figure 7. Foxa2 is necessary for the generation of ventricular cells during cardiac development.
(a) Schematic of mESC chimera competition assay. Fluorescently labelled WT or Foxa2−/− mESCs are injected into unlabelled WT blastocysts at E3.5. Embryos are collected at E13.5 and the distribution of tdT+ cells is observed. (b) Whole-mount imaging of typical WT (left) and Foxa2−/− (right) mESC-injected hearts at E13.5. (c) Flow cytometry analysis of cell populations differentiated from WT and Foxa2−/− mESC cells. Cells at day 10 of differentiation were dissociated and analysed by flow cytometry for the cardiac marker cTnT. (d) Quantification of c. Paired data are plotted for n=3 replicates. (e) Cells at day 10 of differentiation from WT and Foxa2−/− mESCs were plated and IF analysis was performed with antibodies against cTnT (red) and the ventricular-specific marker Mlc2v (green). Yellow arrowheads illustrate overlap of cTnT and Mlc2v. White arrowheads indicate cTnT cells that are not stained for Mlc2v. Scale bar, 50 μm. LA, left atria; LV, left ventricle; RA, right atria; RV, right ventricle.
Figure 8
Figure 8. Perturbation of the Foxa2-vCP population results in aberrant cardiac morphology.
(a,b) WT (left) and Foxa2Cre:Isl1lox/lox (right) embryos were imaged for morphological differences at E9.0 (a) and E10.0 (b). (c) IF analysis of cryosectioned E9.5 WT and Foxa2Cre:Isl1lox/lox embryos with antibodies against cTnT and Mlc2v. (d) WMIF and confocal z-projection of E9.5 WT and Foxa2Cre:Isl1lox/lox embryos with antibodies against Nkx2–5 and cTnT to label the growing heart tube. (e,f) WMIF analysis of E8.5 Foxa2Cre:YFP embryos injected at E7.5 with either dimethylsulfoxide (DMSO; vehicle control, top rows) or RA (65 mg kg−1, bottom rows) and labelled with antibodies against YFP, Nkx2–5 and either Hcn4 (e) or Isl1 (f). Brackets indicate expansion of heart field region after RA treatment. Images shown are representative (n=3 embryos for each stain). PV, primitive ventricle; CC, cardiac crescent; SHF, second heart field. Scale bars, 75 μm (c) or 100 μm (d,e).
Figure 9
Figure 9. Schematic illustrating the emergence and subsequent pattern of contribution of Foxa2-vCPs during cardiac development.
Foxa2-vCPs (indicated in green) emerge during gastrulation (E6.5–7.5). Progeny derived from the Foxa2-vCPs (continued in green) start expressing the CM markers Pdgfra and Kdr, and migrate to the anterior side of the embryo. In the CC, Foxa2-vCP progeny contribute to both the FHF and SHF, and are located primarily at the apex of the crescent. Finally, in the differentiated four-chambered heart, Foxa2-vCP progeny give rise to cardiomyocytes, endothelial cells and conduction system cells of the left and right ventricular chambers, and to epicardial cells of the entire heart.

References

    1. Buckingham M., Meilhac S. & Zaffran S. Building the mammalian heart from two sources of myocardial cells. Nat. Rev. Genet. 6, 826–835 (2005). - PubMed
    1. Meilhac S. M., Lescroart F., Blanpain C. & Buckingham M. E. Cardiac cell lineages that form the heart. Cold Spring Harb. Perspect. Med. 4, a013888 (2014). - PMC - PubMed
    1. Arias E., Kochanek K. D., Xu J. & Murphy S. L. Mortality in the United States, 2014. NCHS Data Brief 229, 1–8 (2015). - PubMed
    1. Bruneau B. G. & Srivastava D. Congenital heart disease: entering a new era of human genetics. Circ. Res. 114, 598–599 (2014). - PubMed
    1. Herion N. J., Salbaum J. M. & Kappen C. Traffic jam in the primitive streak: the role of defective mesoderm migration in birth defects. Birth Defects Res. A. Clin. Mol. Teratol. 100, 608–622 (2014). - PMC - PubMed

Publication types

MeSH terms

Substances