. 2017 Feb 14:8:14202.
doi: 10.1038/ncomms14202.

Regional cooling caused recent New Zealand glacier advances in a period of global warming

Affiliations

Regional cooling caused recent New Zealand glacier advances in a period of global warming

Andrew N Mackintosh et al. Nat Commun. .

Abstract

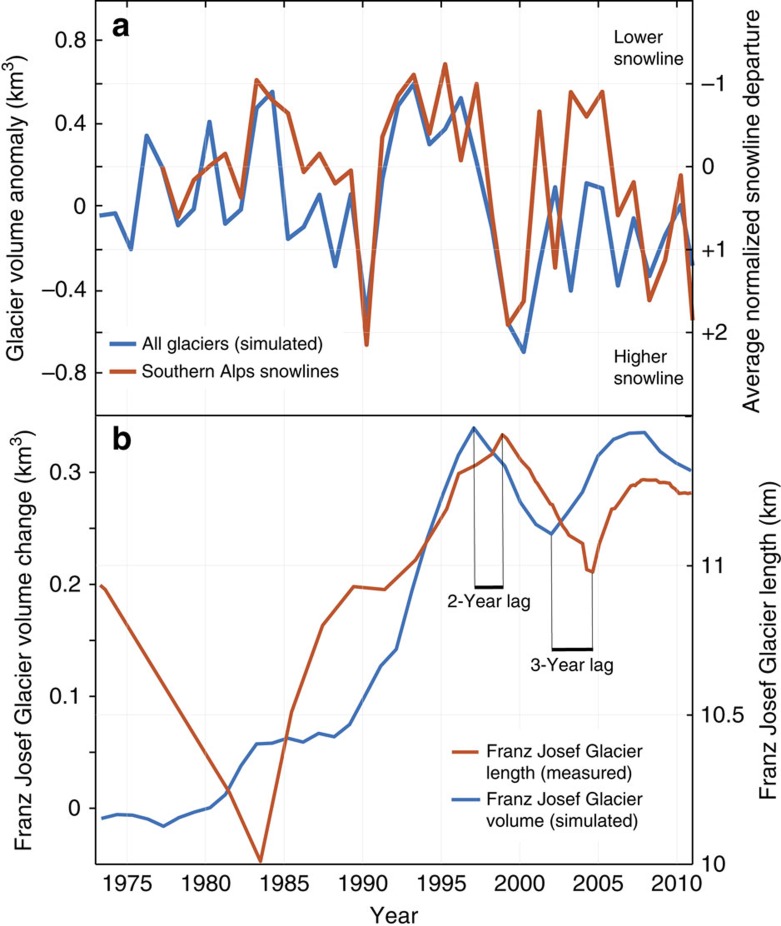
Glaciers experienced worldwide retreat during the twentieth and early twenty first centuries, and the negative trend in global glacier mass balance since the early 1990s is predominantly a response to anthropogenic climate warming. The exceptional terminus advance of some glaciers during recent global warming is thought to relate to locally specific climate conditions, such as increased precipitation. In New Zealand, at least 58 glaciers advanced between 1983 and 2008, and Franz Josef and Fox glaciers advanced nearly continuously during this time. Here we show that the glacier advance phase resulted predominantly from discrete periods of reduced air temperature, rather than increased precipitation. The lower temperatures were associated with anomalous southerly winds and low sea surface temperature in the Tasman Sea region. These conditions result from variability in the structure of the extratropical atmospheric circulation over the South Pacific. While this sequence of climate variability and its effect on New Zealand glaciers is unusual on a global scale, it remains consistent with a climate system that is being modified by humans.


Conflict of interest statement

The authors declare no competing financial interests.

Figures

Figure 1
Figure 1. Southern Hemisphere climatological features and New Zealand glaciers.
Most New Zealand glaciers are located in the Southern Alps, a mountain range extending for >500 km from north to south along the South Island of New Zealand. The Southern Alps are orientated perpendicular to the prevailing mid-latitude westerly winds and rise to ∼3,000 m. The climate of the South Island is influenced by processes to both the north and the south. To the north lies the subtropical ridge, South Pacific Convergence Zone and Inter Tropical Convergence Zone. To the south lies the core of the westerlies, the circumpolar trough and Antarctic sea ice. All of these features have the potential to influence atmospheric and oceanic conditions in the New Zealand region, and hence Southern Alps glacier mass balance. Sea surface temperature (SST) is from annual mean data, while sea ice data show peak concentration (%) reached in the austral spring. Other climatological features are plotted in their mean annual positions.
Figure 2
Figure 2. Historic length changes for four glaciers in New Zealand.
Franz, Fox, Stocking and Tasman glaciers (see Fig. 3 for glacier locations) retreated during the twentieth and early twenty first centuries. However, Franz Josef, Fox and Stocking glaciers also experienced periodic re-advances. In this paper we identify the climatological and glaciological drivers of the largest and most recent of these re-advances between 1983 and 2008 (marked by blue shading). The three glaciers that advanced are all steeply inclined and react swiftly and similarly to climate forcing. Fox and Franz Josef glaciers, both >10 km long, flow to the west and north from the major drainage divide (main divide) of the Southern Alps. Stocking Glacier is much shorter than Fox and Franz Josef glaciers, and flows to the east of the main divide. Tasman Glacier has a gentle slope and is the largest and thickest glacier in New Zealand. During the twentieth century, Tasman Glacier experienced continuous thinning, followed by ∼5 km of retreat via pro-glacial lake formation since the 1980s.
Figure 3
Figure 3. Model domain in the central Southern Alps of New Zealand.
The map shows the location of major glaciers, mean glacier mass balance (1972–2011), surface debris cover and pro-glacial lakes. The Southern Alps contain more than 3,000 glaciers, but the greatest volume of glacier ice in New Zealand is located within our model domain at 43°S, approximately centred on Aoraki/Mt Cook, New Zealand's highest mountain (3,724 m). Mass balance (metres of water equivalent per year) is shown in red (net melt) and blue colouring (net accumulation). Very large gradients in glacier mass balance exist within the model domain, depending on glacier elevation and location with respect to the major drainage divide (main divide). Franz Josef and Fox glaciers to the west and north of the main divide each show snow accumulation rates of ∼10 m, and melt rates of ∼20 m of water equivalent per year. Surface debris covers the lower portion of many glaciers including the Tasman, Hooker, Mueller and Murchison glaciers. Terminal lakes have grown rapidly at these glaciers since the 1980s.
Figure 4
Figure 4. Simulated mass balance and ice volume changes.
(a) Simulated mass balance and (b) simulated ice volume change in the central Southern Alps between 1972 and 2011 for the five largest glaciers within our model domain (from the ‘standard run'). Mass balance units are metres of water equivalent per year (m w.e.a−1). (a) All glaciers show significant interannual variability in glacier mass balance, with positive years in the mid-1980s, early to mid-1990s and mid-2000s. Mass balance at Fox, Franz Josef and Hooker glaciers was more positive overall, while mass balance of Tasman Glacier remained negative except for a few years in the 1990s. Murchison Glacier mass balance stayed negative for the entire period. Note that the mean mass balance for all glaciers (black line) is identical to that shown in Fig. 9 (standard run, all glaciers). (b) The lower panel shows how the cumulative effect of mass balance fluctuations results in glacier volume change for five glaciers in our model domain. Fox and Franz Josef glaciers gained volume overall, consistent with observations that they advanced between 1983 and 2008. Tasman and Murchison glaciers lost volume, again consistent with observations.
Figure 5
Figure 5. Comparison between modelled and observed glacier changes.
(a) Simulated interannual glacier volume anomaly (from the ‘standard run') versus the observed average normalized annual snowline departure based on 26 Southern Alps glaciers (Supplementary Fig. 1). (b) Simulated ice volume changes for Franz Josef Glacier versus observed glacier length. Simulated ice volume changes lead to measured glacier length by 2–3 years, in accordance with observations that Franz Josef Glacier reacts swiftly to climate forcing.
Figure 6
Figure 6. Diagnostic experiments with energy balance model.
Annual precipitation (a) and temperature (b) anomalies during the study period over the model grid. (c) The relative contributions of different components of the climate forcing to simulated glacier volume changes. These proportions are derived from the diagnostic experiments (d), which show the relative contribution of each climatic component to the cumulative glacier volume change. Overall, this figure demonstrates that reduced temperature (56%), rather than increased precipitation, made the largest contribution to glacier volume changes during this period. Precipitation contributed 27% overall, while the combined effect of wind, cloudiness and relative humidity resulted in 17% of the glacier volume change. Note that the cumulative glacier volume changes shown in d have been de-trended by removing the long-term ice loss signal. This is carried out by plotting each contribution relative to the control run, where all variables are held at their climatological mean values. Uncertainty bands in d relate to sensitivity experiments where model parameters are systematically varied (see Methods). These experiments show that the results are relatively insensitive to parameter choice. The results of a model simulation forced by downscaled temperature from climate re-analysis data are also shown. This simulation falls within the uncertainty envelope of our sensitivity tests, demonstrating that the temperature forcing used in our modelling is appropriately represented by climate re-analyses.
Figure 7
Figure 7. Climate anomalies for glacier mass gain and loss.
Composite patterns for upper (gain) and lower (loss) quintiles of Southern Alps glacier mass balance changes (Supplementary Table 4), for (a) 1,000 hPa geopotential height (analogous to atmospheric pressure near mean sea level) anomalies (z1000), (b) SST anomalies (SSTa), and (c) precipitable water content (PWC) anomalies. Glacier mass gain over cool and warm seasons, as well as the glacier year, is associated with low atmospheric height/pressure, low SST in the Tasman Sea, and slightly higher precipitation, especially in summer when it is less effective. Glacier mass loss is associated with high atmospheric height/pressure and high SST. The bottom panel (d) is a schematic diagram indicating significant differences in means (P<0.05) for climate indices associated with glacier mass gains and losses. We assessed whether the index favoured glacier mass loss (brown), gain (blue), or both (green) by examining the differences of means (absolute values and sign, Supplementary Table 5). If the difference of means were of approximately the same magnitude and opposite sign for gain and loss, then the index (and mass balance driver) was considered important for both. If an absolute magnitude of a mean index value exceeded its counterpart by a factor of two or more, then that index (and mass balance driver) was considered more important for either gain or loss. Regional climate indices and drivers shown include Tasman SST, Southern Oscillation Index (SOI), T synoptic type (‘T' type), Pacific South American pattern and Zonal Wave 3 (ZW3). Tasman SST has the strongest and most persistent association with glacier volume changes in the Southern Alps (see Supplementary Fig. 7).
Figure 8
Figure 8. Climate anomaly pattern that drove New Zealand glacier advances.
Lower-to-middle troposphere (a) and surface (b,c) climate anomalies for the South Pacific region. The anomalies depict the spatial patterns for the average mass balance gain composite minus the average mass balance loss composite, and hence represent the atmospheric and oceanic conditions that promoted glacier advances in New Zealand. SPCZ refers to the South Pacific Convergence Zone. Geopotential height contours are shown every 10 m (positive=solid; negative=dashed). Zonal wind (u-wind) anomaly is at the 500 hPa geopotential height level shown in a and the solid (dashed) line represents the location where there is a zone of maximum (minimum) westerly anomalous flow. Arrows in b show surface wind anomalies. All anomalies (except sea ice) are shown relative to climatology for the 1981–2010 period. Low temperatures at 850 hPa geopotential height (t850; ∼1,500 m above the sea level) extend over most of the South Pacific from southern Australia to South America. This pattern is also associated with increased sea ice concentration (%), and advancing outlet glaciers in East Antarctica directly south of New Zealand. In the Amundsen Sea sector of West Antarctica on the opposite side of this atmospheric and oceanic dipole, this climate pattern is associated with warmer air and higher SSTs and reduced sea ice concentration, and likely increases in sub-ice shelf melt rates at Pine Island Glacier.
Figure 9
Figure 9. Attribution of New Zealand glacier mass balance to natural and human causes.
Standard mass balance model run (black line, all glaciers) is plotted alongside modelled New Zealand glacier mass balance output from a global-scale glacier attribution study. Mass balance units are metres of water equivalent per year (m w.e.a−1). ‘Full forcings' (red) show the ensemble mean-specific mass balance and model range for New Zealand glaciers, calculated from 12 models that include both natural and anthropogenic forcings from the Coupled Model Intercomparison Project phase 5 (CMIP5). ‘Natural forcings' (green) show the same for CMIP5 models that include natural and omit anthropogenic forcings on climate. The standard run derived here shows a larger degree of interannual variability than either the ‘full forcing' or ‘natural forcing' runs. The standard run, however, is more consistent with ‘full forcing' mass balance simulation (Supplementary Table 6), suggesting that New Zealand glacier mass balance was influenced by anthropogenic climate change between 1980 and 2005.

References

    1. Zemp M. et al.. Historically unprecedented global glacier decline in the early 21st century. J. Glaciol. 61, 745–762 (2015).
    1. Hartmann D. L. et al.. in Climate Change 2013: the Physical Science Basis. Contribution of Working Group I to the Fifth Assessment Report of the Intergovernmental Panel on Climate Change eds Stocker T. F.et al.. Ch. 2 159–254Cambridge University Press (2013).
    1. Marzeion B., Cogley J. G., Richter K. & Parkes D. Attribution of global glacier mass loss to anthropogenic and natural causes. Science 345, 919–921 (2014). - PubMed
    1. Kapnick S. B., Delworth T. L., Ashfaq M., Malyshev S. & Milly P. C. D. Snowfall less sensitive to warming in Karakoram than in Himalayas due to a unique seasonal cycle. Nat. Geosci. 7, 834–840 (2014).
    1. Kaab A., Berthier E., Nuth C., Gardelle J. & Arnaud Y. Contrasting patterns of early twenty-first-century glacier mass change in the Himalayas. Nature 488, 495–498 (2012). - PubMed

Publication types