. 2017 May;242(1):113-125.
doi: 10.1002/path.4886. Epub 2017 Mar 28.

Molecular classification of urothelial carcinoma: global mRNA classification versus tumour-cell phenotype classification

Affiliations

Molecular classification of urothelial carcinoma: global mRNA classification versus tumour-cell phenotype classification

Gottfrid Sjödahl et al. J Pathol. 2017 May.

Abstract

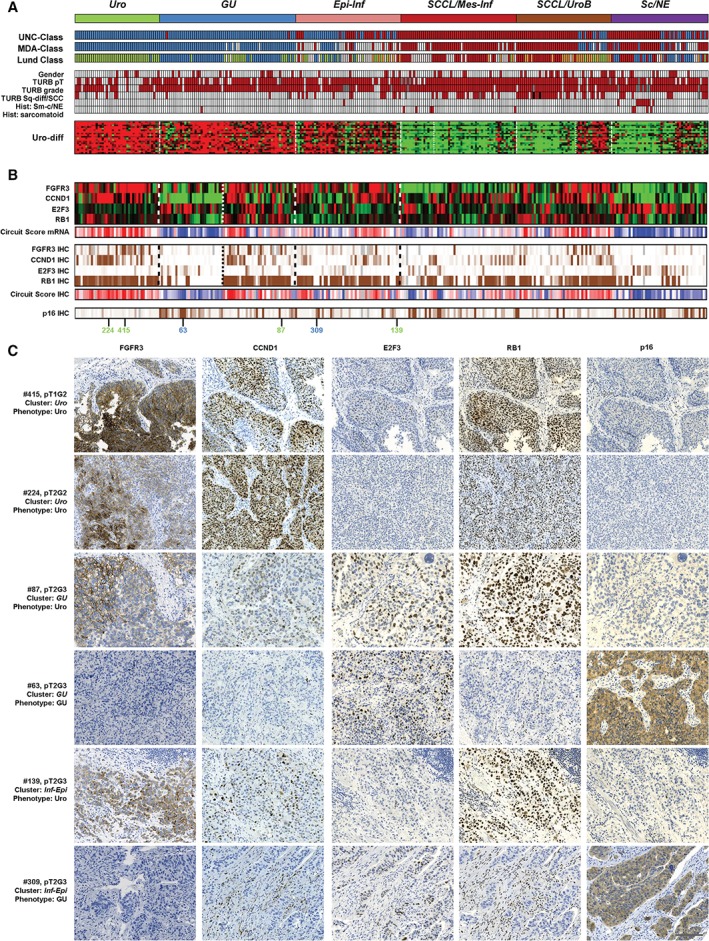
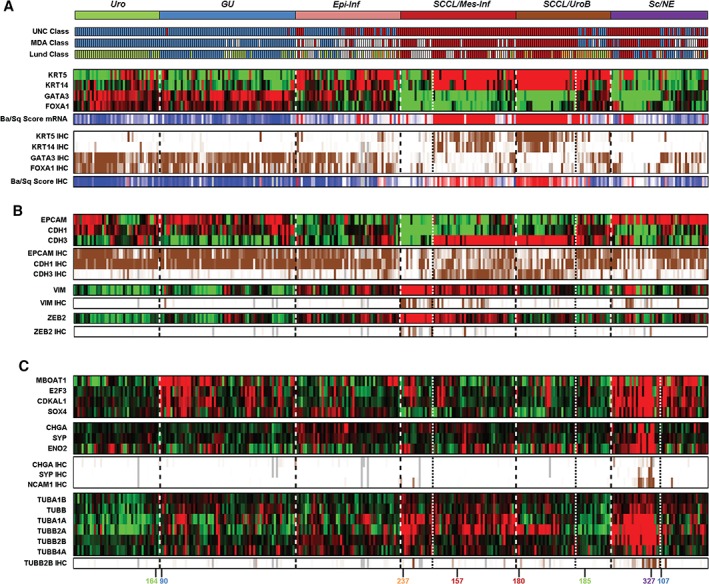
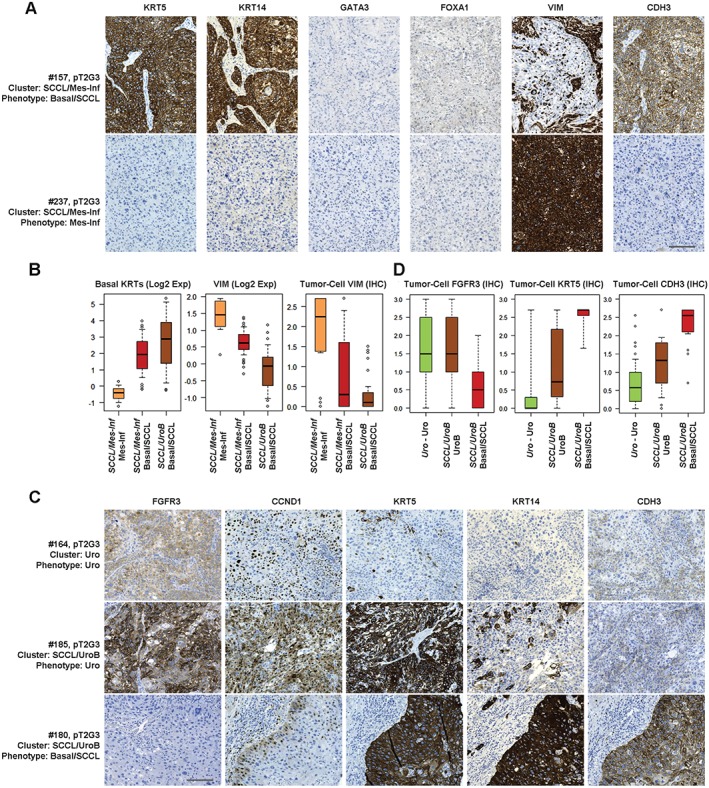
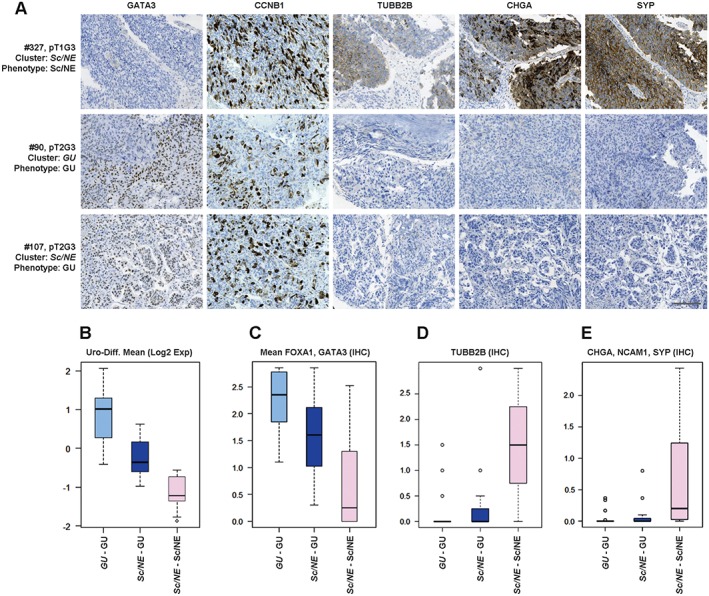
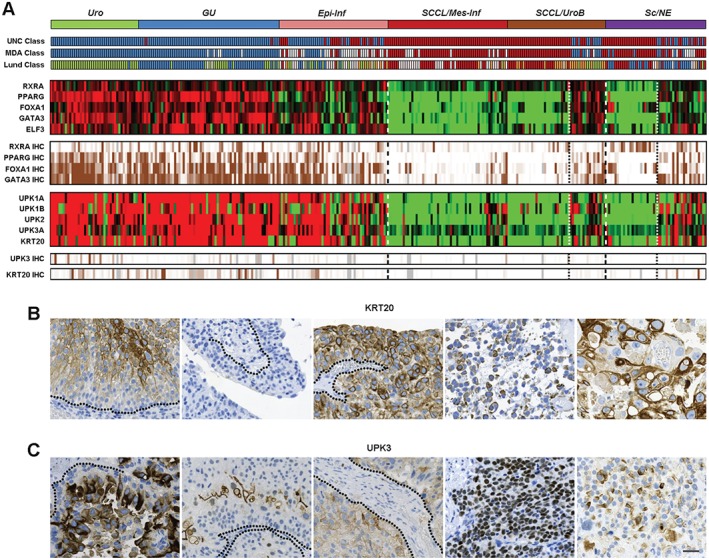
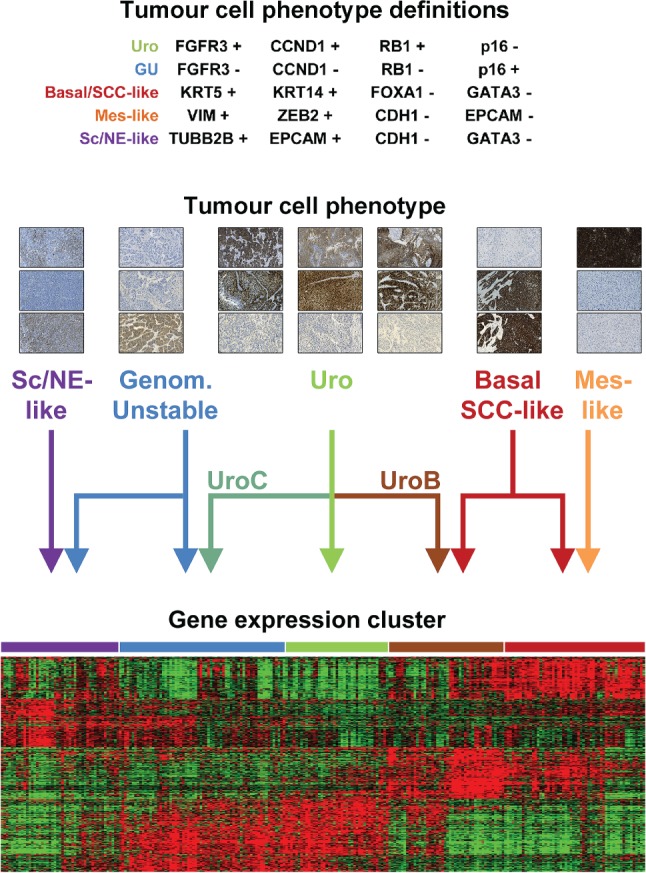
Global mRNA expression analysis is efficient for phenotypic profiling of tumours, and has been used to define molecular subtypes for almost every major tumour type. A key limitation is that most tumours are communities of both tumour and non-tumour cells. This problem is particularly pertinent for analysis of advanced invasive tumours, which are known to induce major changes and responses in both the tumour and the surrounding tissue. To identify bladder cancer tumour-cell phenotypes and compare classification by tumour-cell phenotype with classification by global gene expression analysis, we analysed 307 advanced bladder cancers (cystectomized) both by genome gene expression analysis and by immunohistochemistry with antibodies for 28 proteins. According to systematic analysis of gene and protein expression data, focusing on key molecular processes, we describe five tumour-cell phenotypes of advanced urothelial carcinoma: urothelial-like, genomically unstable, basal/SCC-like, mesenchymal-like, and small-cell/neuroendocrine-like. We provide molecular pathological definitions for each subtype. Tumours expressing urothelial differentiation factors show inconsistent and abnormal protein expression of terminal differentiation markers, suggesting pseudo-differentiation. Cancers with different tumour-cell phenotypes may co-cluster (converge), and cases with identical tumour-cell phenotypes may cluster apart (diverge), in global mRNA analyses. This divergence/convergence suggests that broad global commonalities related to the invasive process may exist between muscle-invasive tumours regardless of specific tumour-cell phenotype. Hence, there is a systematic disagreement in subtype classification determined by global mRNA profiling and by immunohistochemical profiling at the tumour-cell level. We suggest that a combination of molecular pathology (tumour-cell phenotype) and global mRNA profiling (context) is required for adequate subtype classification of muscle-invasive bladder cancer. © 2017 The Authors. The Journal of Pathology published by John Wiley & Sons Ltd on behalf of Pathological Society of Great Britain and Ireland.

Keywords: bladder cancer; molecular classification; pseudo-differentiation; tumour-cell phenotypes.


Figures

Figure 1
Figure 1
Consensus clustering and Uro‐diff‐positive tumours. (A) The identification of tumours with a dominating luminal character. Consensus clusters obtained by unsupervised clustering of mRNA expression data are shown at the top in relation to classifications obtained with the UNC, MDA and Lund algorithms, as well as clinical and pathological variables. The Uro‐diff signature heatmap shows that the majority of the Uro‐diff‐positive cases are of either the Uro, GU or Epi‐Inf gene expression subtypes. UNC class: blue, luminal; dark red, basal. MDA class: blue, luminal; white, TP53‐like; dark red, basal. Lund class: green, Uro; blue, GU; light brown, UroB; dark red, SCC‐like; white, infiltrated. Red colour indicates female gender, pathological stage ≥T2, pathological grade 3, signs of squamous differentiation, the presence of small‐cell/neuroendocrine histology, and the presence of sarcomatoid histology. Black boxes indicate two cases with pure SCC of the bladder; grey boxes indicate grey boxes indicate grade not determined. (B) Uro and GU phenotypes of the Uro‐diff‐positive subset are identified by the genomic circuit genes FGFR3, CCND1, RB1 and E2F3 at both mRNA level and the IHC level. For completeness, results are given for the whole dataset. Circuit scores were calculated by adding values for FGFR3, CCND1 and RB1, and subtracting that for E2F3, and are depicted in red (high, indicating Uro phenotype) and blue (low, indicating a GU phenotype). IHC scores were percentile‐mapped to a brown (high) and white (low) colour scale. CDKN2A (p16) is also given as an alternative IHC marker in the genomic circuit. Grey bars indicate missing data. Green numbers indicate cases with a Uro phenotype, and blue numbers indicate cases with a GU phenotype in (C). (C) Representative marker profiles of the Uro and GU tumour‐cell phenotypes in the Uro, GU and Epi‐Inf consensus clusters. Each row corresponds to one tumour for which case number (mapping to numbers in Figure 1B), pathological stage and grade, consensus cluster (italics) and tumour‐cell phenotype are given. Each column of images shows staining with the indicated marker. Four cases have identical Uro phenotypes (FGFR3+, CCND1+, RB1+, E2F3, and p16) regardless of stage (pT1 or higher) and consensus cluster (Uro, GU, and Epi‐Inf). Two cases shown have the opposite GU phenotype (FGFR3, CCND1, RB1, E2F3+, and p16+) found in the GU or in the Epi‐Inf cluster. Scale bar: 100 µm.
Figure 2
Figure 2
Uro‐diff‐negative tumours are of basal/SCC‐like, mesenchymal‐like or small‐cell/neuroendocrine‐like subtypes. (A) Identification of tumours with a basal/SCC‐like character. Consensus clusters obtained by unsupervised clustering of mRNA expression data are shown at the top in relation to classifications obtained with the UNC, MDA and Lund algorithms. Basal/SCC‐like tumours show high KRT5 and KRT14 expression, and low FOXA1 and GATA3 expression. This tumour‐cell phenotype was observed in both the SCCL/Mes‐Inf and the SCCL/UroB gene expression clusters. Individual markers and a ratio score (Ba/Sq score: red, high score and basal/SCC‐like; blue, low score and non‐basal/SCC‐like) are shown for mRNA and IHC levels. Note the KRT5, KRT14, GATA3 and FOXA1 small non‐basal/SCC‐like group included in the SCCL/Mes‐Inf gene expression consensus cluster. Heatmaps of gene expression are depicted in red (high) and green (low). IHC scores were percentile‐mapped to a brown (high) and white (low) colour scale. Dotted lines separate consensus tumour clusters, and fine dotted lines separate the Mes‐like, UroB and Sc/NE‐like subclusters. (B) Basal/SCC‐like cases express low levels of CDH1 and EPCAM, but high levels of CDH3, at both the mRNA level and the protein level. The KRT5, KRT14, GATA3 and FOXA1 group included in the SCCL/Mes‐Inf gene expression consensus cluster is distinct from the basal/SCC‐like cases in the same cluster by being negative for CDH1, EPCAM, and CDH3. The absence of all three, combined with positivity for VIM and ZEB2 at both the mRNA level and IHC level, identifies a subset of tumours with a mesenchymal‐like phenotype. (C) Dissecting tumour‐cell phenotypes in the Sc/NE consensus cluster. Almost all cases in the Sc/NE gene expression cluster show overexpression of the 6p22 amplicon genes MBOAT1, E2F3, CDKAL1, and SOX4. In contrast, only half of the cluster shows gene and protein expression of the small‐cell/neuroendocrine markers CHGA, SYP, ENO2, and NCAM1. In addition, the same set of tumours was found to have high mRNA expression of several tubulin isoforms (including tubulin β2B, for which IHC data are also shown). Numbers colour‐coded by phenotype indicate the cases for which IHC images are shown in Figures 3 and 4.
Figure 3
Figure 3
Minor subtypes co‐clustering with basal/SCCL tumours. (A) Representative marker profiles of the basal/SCC‐like and mesenchymal‐like tumour‐cell phenotypes in the SCCL/Mes‐Inf consensus cluster. Each row corresponds to one tumour for which case number (mapping to numbers in Figure 2C), pathological stage and grade, consensus cluster (italics) and tumour‐cell phenotype are given. Each column shows staining with the indicated marker. Despite clustering together, the basal/SCC‐like tumour cells (KRT5+, KRT14+, CDH3+, GATA3, FOXA1, and VIM) are clearly different in type from the mesenchymal‐infiltrated tumours, which are VIM+. Both phenotypes lack the urothelial differentiation markers GATA3 and FOXA1. Scale bar: 100 µm. (B) Box plots showing basal keratin (KRT4, KRT5, KRT6A, KRT6B, and KRT14) and VIM mRNA, and tumour‐cell VIM expression (IHC), in the Mes‐Inf subcluster as compared with basal/SCC‐like cases from the same cluster (SCCL/Mes‐Inf) or from the SCC‐like/UroB consensus cluster. (C) Representative marker profiles of the Uro (top), UroB (middle) and basal/SCC‐like (bottom) tumour‐cell phenotypes in the Uro and SCCL/UroB consensus clusters. Each row corresponds to one case for which case number (mapping to numbers in Figure 2C), pathological stage and grade, consensus cluster (italics) and tumour‐cell phenotype are given. Each column shows staining with the indicated marker. By global mRNA clustering, UroB tumours co‐cluster with basal/SCC‐like tumours. Phenotypic analysis shows that, although UroB tumours show more widespread expression of KRT5, KRT14 and CDH3 (P‐cadherin) than Uro tumours, they maintain expression of the typical Uro markers FGFR3 and CCND1. Scale bar: 100 µm. (D) Box plots showing tumour‐cell expression of FGFR3, KRT5 and CDH3 in Uro‐Uro, UroB and basal/SCC‐like samples. Note: the identical high expression of FGFR3 in Uro and UroB tumours, and the absence of expression in basal/SCC‐like tumours; the low KRT5 expression in Uro tumours, the highly variable expression in UroB tumours, and the high expression in basal/SCC‐like tumours; and the low CDH3 (P‐cadherin) expression in Uro tumours, intermediate expression in UroB tumours, and high expression in basal/SCC‐like tumours.
Figure 4
Figure 4
The Sc/NE consensus cluster is composed of tumours with Sc/NE‐like and GU tumour‐cell phenotypes. (A) Representative marker profiles of the Sc/NE and GU tumour‐cell phenotypes in the Sc/NE and GU consensus clusters. Each row corresponds to one tumour, with case number (mapping to numbers in Figure 2C), pathological stage and grade, consensus cluster (italics) and tumour‐cell phenotype given. Each column shows staining with the indicated marker. An IHC profile of a tumour from the Sc/NE consensus cluster (top row) shows a typical Sc/NE‐like profile; negative for GATA3, and positive for CCNB1, TUBB2B, CHGA, and SYP. A tumour with a typical GU phenotype from the GU consensus cluster (middle row) is positive for GATA3 and CCNB1, and negative for TUBB2B, CHGA and SYP. A tumour from the Sc/NE consensus cluster shows a typical GU tumour‐cell phenotype (bottom row). Scale bar: 100 µm. (B–E) Boxplots showing mean mRNA expression of (B) the Uro‐diff signature, (C) mean protein tumour‐cell expression of GATA3/FOXA1, (D) TUBB2B expression and (E) mean protein expression of CHGA/NCAM1/SYP in cases with a GU tumour‐cell phenotype from the GU consensus cluster, cases with a GU tumour‐cell phenotype from the Sc/NE cluster, and cases with an Sc/NE‐like tumour‐cell phenotype from the Sc/NE consensus cluster, respectively.
Figure 5
Figure 5
The normal terminal differentiation markers KRT20 and UPK3 are inconsistently and aberrantly expressed in Uro‐diff‐positive tumours, indicating pseudo‐differentiation. (A) The identification of tumours that express differentiation‐related transcription factors and differentiation readout markers. Consensus clusters obtained by unsupervised clustering of mRNA expression data are shown in relation to classifications obtained with the UNC, MDA and Lund classification algorithms. Expression (mRNA) of the indicated transcription factor genes and tumour‐cell protein expression determined by IHC are shown as heatmaps. Note the expression of urothelial regulatory factors in both UroB cases and GU cases in the Sc/NE consensus cluster. Similarly, expression (mRNA) of the terminal differentiation marker genes UPK1A, UPK1B, UPK2, UPK3A and KRT20, and tumour‐cell protein expression of UPK3 and KRT20, are shown. Heatmaps of gene expression are depicted in red (high), and green (low). IHC scores were percentile‐mapped to a brown (high) and white (low) colour scale. Dotted lines indicate the consensus cluster borders between Uro‐diff‐positive and Uro‐diff‐negative clusters and subclusters. (B) Examples of various forms of aberrant KRT20 protein expression. Each image represents an individual tumour. From the left: staining of intermediate cells; no staining of any cell layer; staining of all cell layers; staining of loosely attached cells with a very low cellular differentiation level; staining of pleomorphic, large cells with a low cellular differentiation level. (C) Examples of aberrant UPK3 protein expression. Each image represents an individual tumour. From the left: staining of intermediate cells; staining only of cells most distal to the tumour–stroma interface; staining of all cell layers; strong nuclear staining; cytoplasmic staining of cells with a low cellular differentiation level. In (B) and (C), dotted lines indicate basal membrane. Scale bar: 20 µm.
Figure 6
Figure 6
Tumour‐cell phenotype definitions and tumour‐cell phenotype relationships with gene expression clusters. IHC definitions of the urothelial‐like (Uro), genomically unstable (GU), basal/SCC‐like (SCC‐like), mesenchymal‐like (Mes‐like) and small‐cell/neuroendocrine‐like (Sc/NE‐like) phenotypes (see supplementary material for details). Example IHC images (from the top): Sc/NE‐like phenotype – TUBB2B, CDH1, and NCAM1; GU phenotype – FGFR3, CCND1, and CDKN2A (p16); Uro phenotype from cases in the three different clusters indicated by the arrows – FGFR3, CCND1, and CDKN2A (p16); Basal/SCC‐like phenotype – GATA3, KRT5, and KRT14; Mes‐like phenotype – VIM, EPCAM, and E‐cadherin. The heatmap shows the top 100 genes from each group (group mean) in a five‐class anova based on consensus clusters. Clusters were re‐ordered to correspond approximately to arrow positions. Gene order was determined by hierarchical clustering. The Epi‐Inf consensus cluster is omitted from the figure.

Comment in

References

    1. Sørlie T, Perou CM, Tibshirani R, et al Gene expression patterns of breast carcinomas distinguish tumor subclasses with clinical implications. Proc Natl Acad Sci USA 2001; 98 : 10869–10874. - PMC - PubMed
    1. Hayes DN, Monti S, Parmigiani G, et al Gene expression profiling reveals reproducible human lung adenocarcinoma subtypes in multiple independent patient cohorts. J Clin Oncol 2006; 24 : 5079–5090. - PubMed
    1. Marisa L, de Reyniès A, Duval A, et al Gene expression classification of colon cancer into molecular subtypes: characterization, validation, and prognostic value. PLoS Med 2013; 10 : e1001453. - PMC - PubMed
    1. Lerner SP, McConkey DJ, Hoadley KA, et al Bladder cancer molecular taxonomy: summary from a consensus meeting. Bladder Cancer 2016; 2 : 37–47. - PMC - PubMed
    1. Lindgren D, Sjödahl G, Lauss M, et al Integrated genomic and gene expression profiling identifies two major genomic circuits in urothelial carcinoma. PLoS One 2012; 7 : e38863. - PMC - PubMed

Publication types

MeSH terms