. 2017 Feb 14;12(2):e0172244.
doi: 10.1371/journal.pone.0172244. eCollection 2017.

Alterations in estrogen signalling pathways upon acquisition of anthracycline resistance in breast tumor cells

Affiliations

Alterations in estrogen signalling pathways upon acquisition of anthracycline resistance in breast tumor cells

Simon Chewchuk et al. PLoS One. .

Abstract

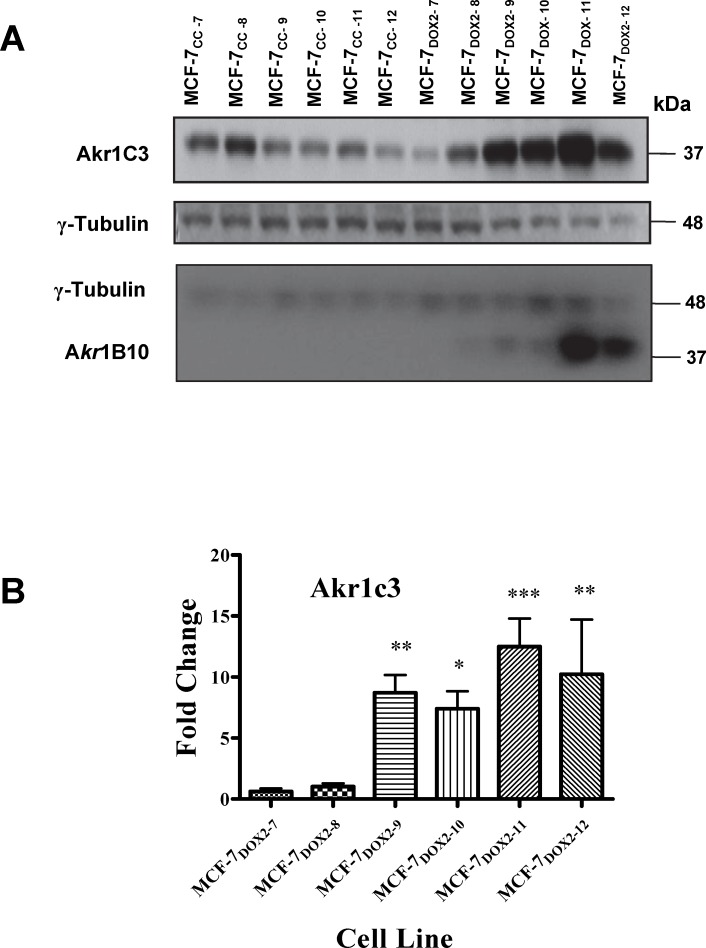
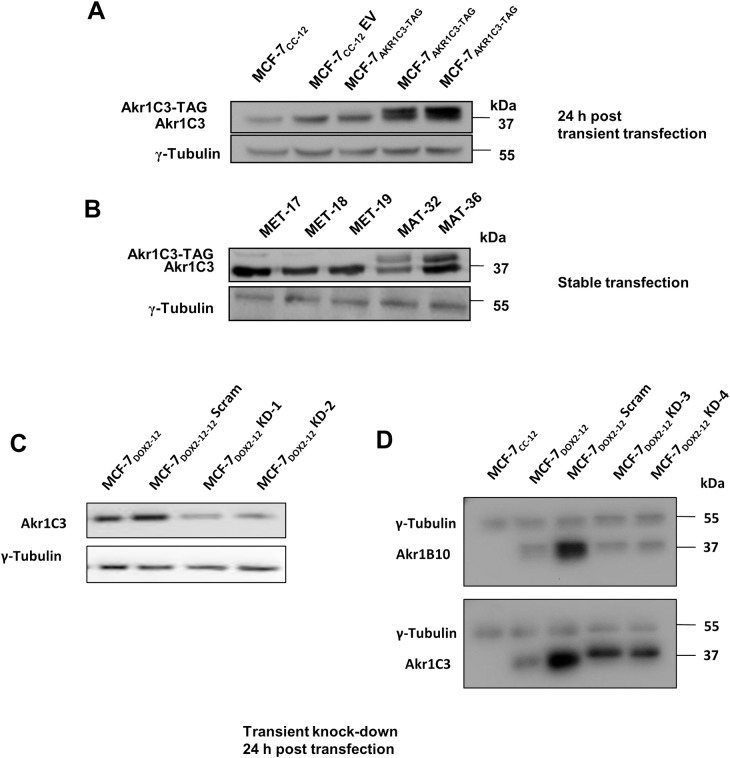
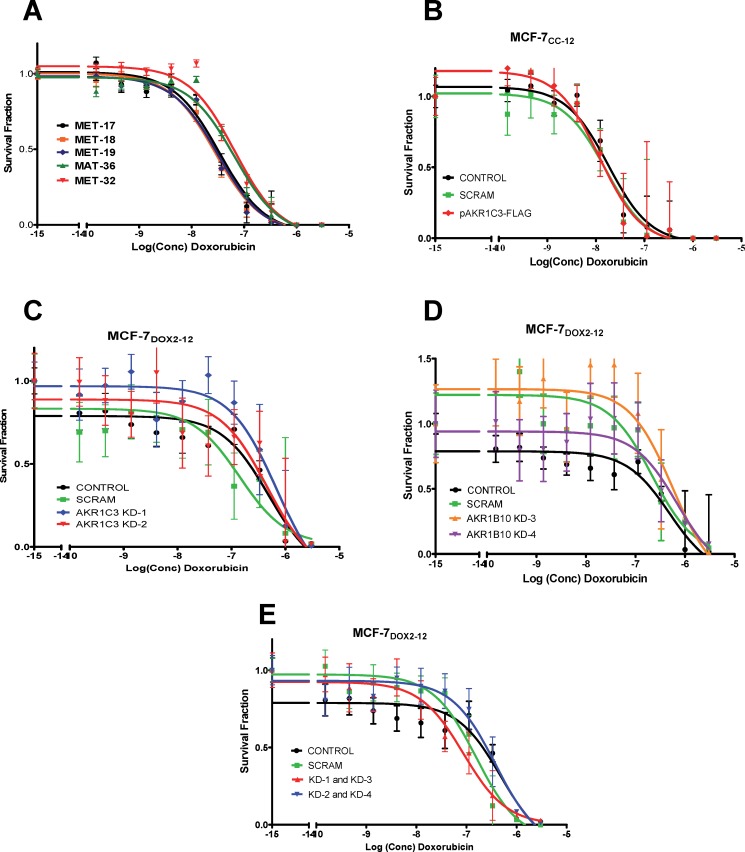
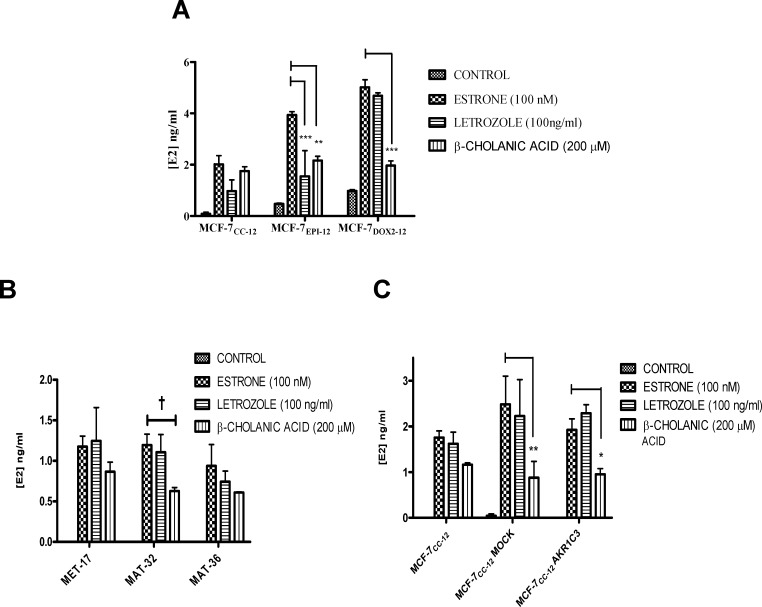
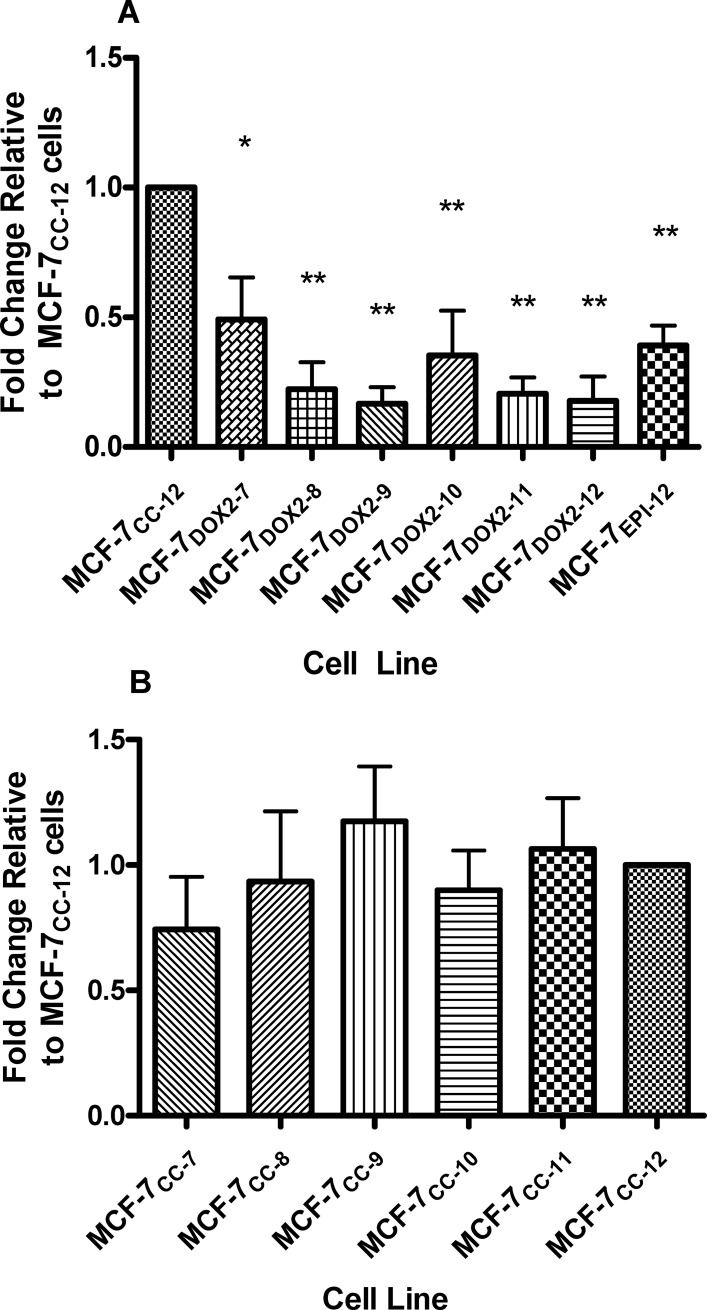
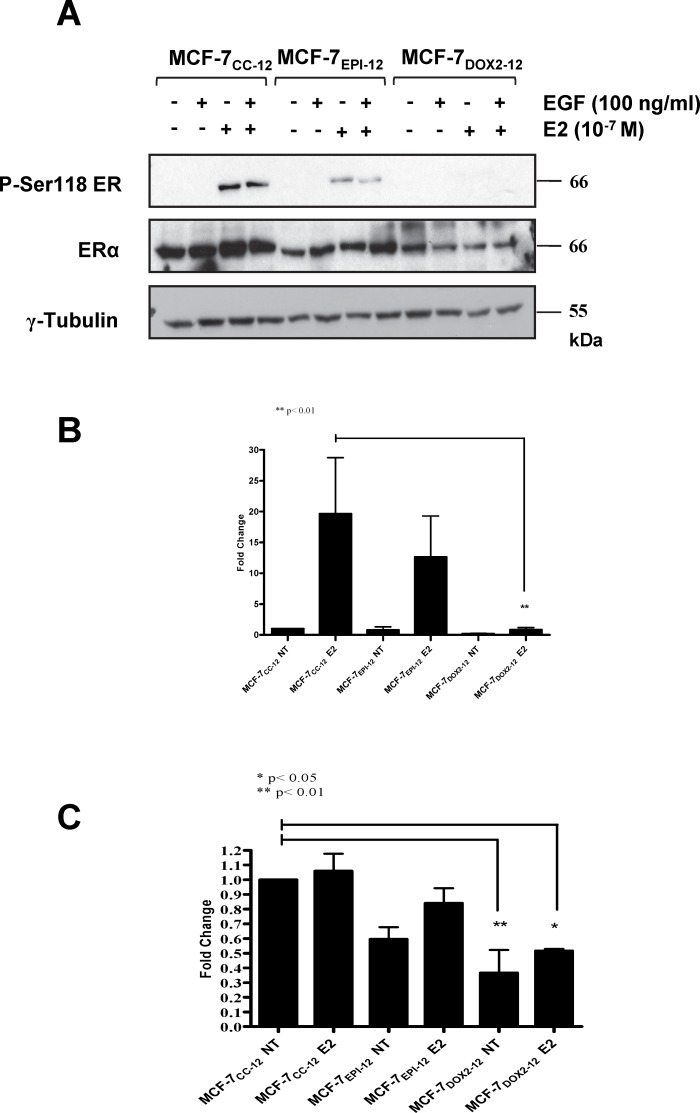
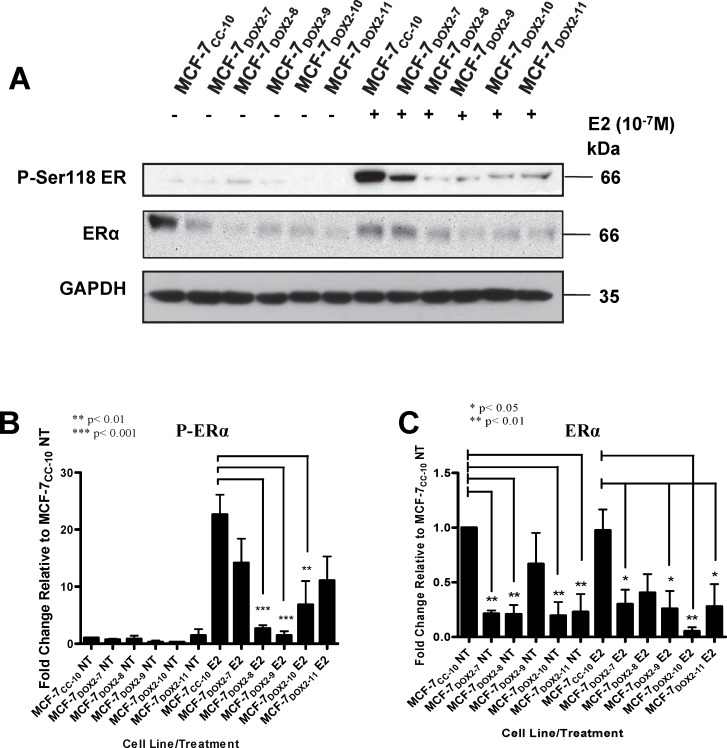
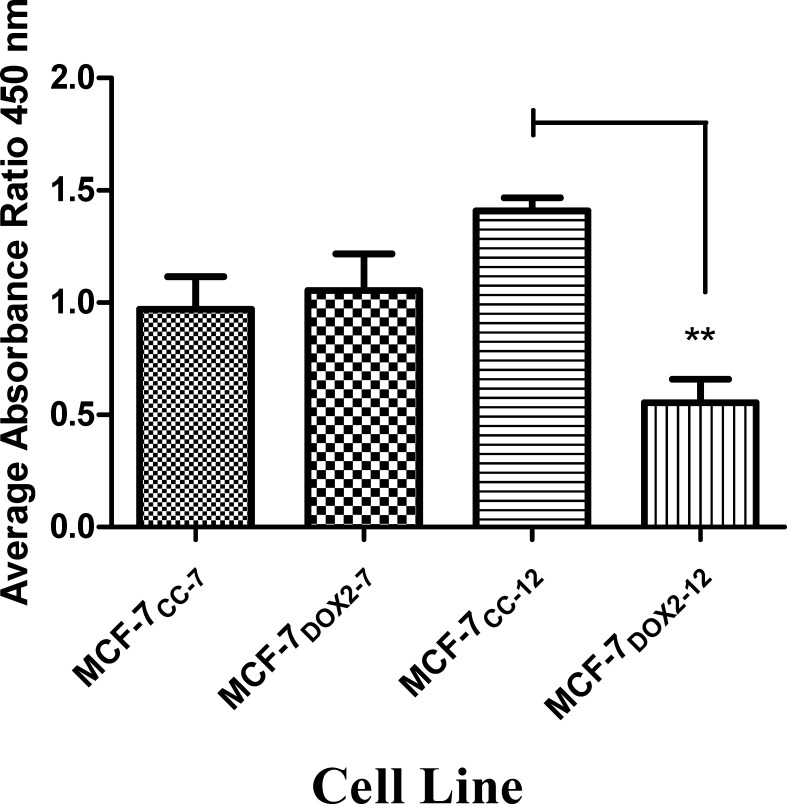
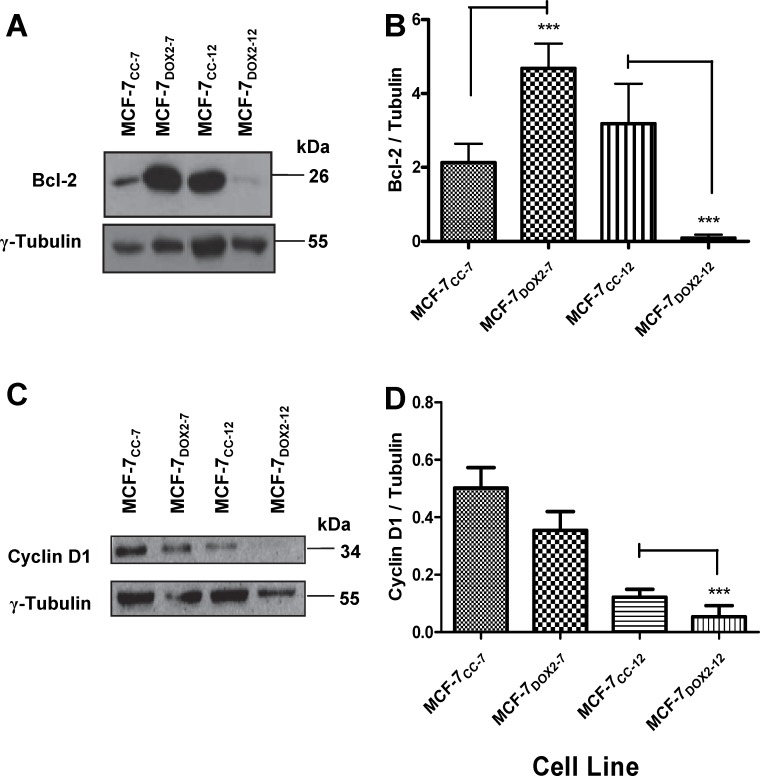
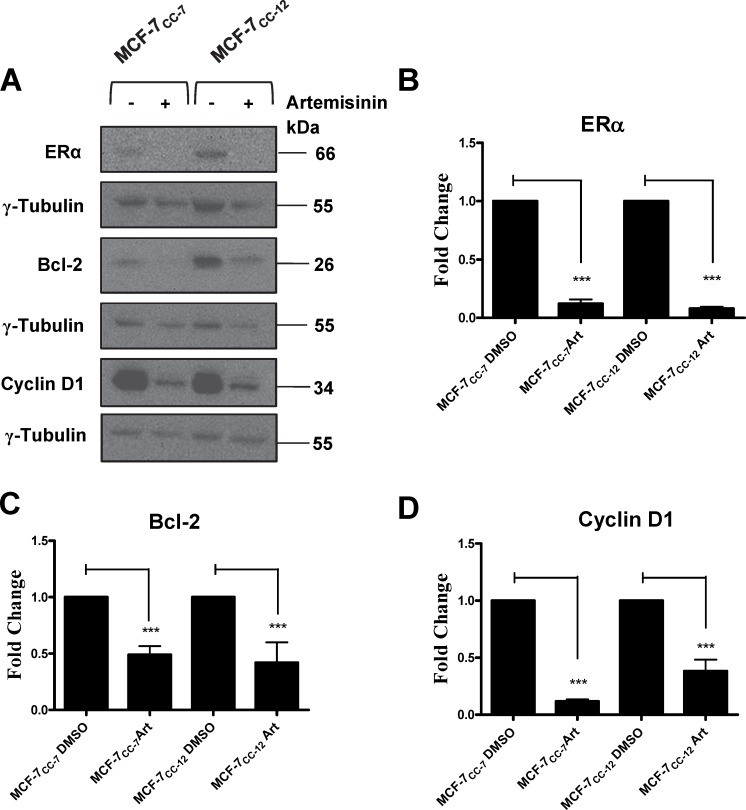
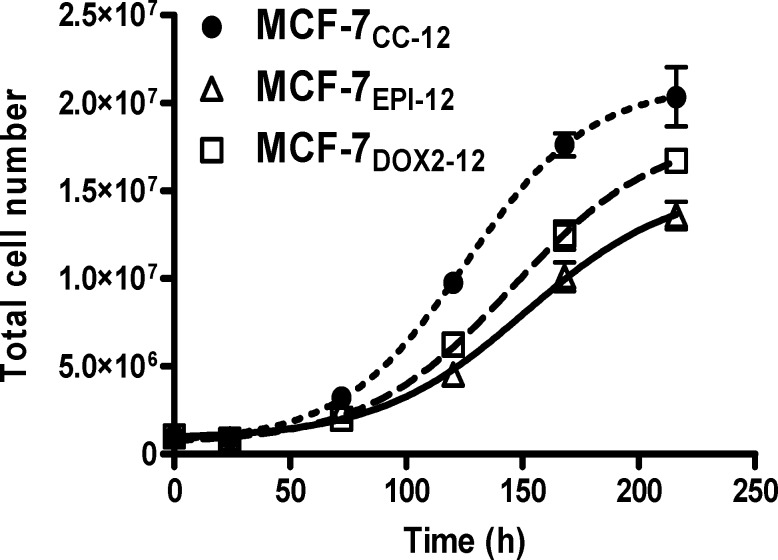
Intrinsic or acquired drug resistance is a major impediment to the successful treatment of women with breast cancer using chemotherapy. We have observed that MCF-7 breast tumor cells selected for resistance to doxorubicin or epirubicin (MCF-7DOX2 and MCF-7EPI cells, respectively) exhibited increased expression of several members of the aldo-keto reductase (AKR) gene family (in particular AKR1C3 and AKR1B10) relative to control MCF-7CC cells selected by propagation in the absence of drug. Normal cellular roles for the AKRs include the promotion of estrogen (E2) synthesis from estrone (E1) and the hydroxylation and detoxification of exogenous xenobiotics such as anthracycline chemotherapy drugs. While hydroxylation of anthracyclines strongly attenuates their cytotoxicity, it is unclear whether the enhanced AKR expression in the above anthracycline-resistant cells promotes E2 synthesis and/or alterations in E2 signalling pathways and whether such changes contribute to enhanced survival and anthracycline resistance. To determine the role of AKRs and E2 pathways in doxorubicin resistance, we examined changes in the expression of E2-related genes and proteins upon acquisition of doxorubicin resistance. We also assessed the effects of AKR overexpression or downregulation or the effects of activators or inhibitors of E2-dependent pathways on previously acquired resistance to doxorubicin. In this study we observed that the enhanced AKR expression upon acquisition of anthracycline resistance was, in fact, associated with enhanced E2 production. However, the expression of estrogen receptor α (ERα) was reduced by 2- to 5-fold at the gene transcript level and 2- to 20-fold at the protein level upon acquisition of anthracycline resistance. This was accompanied by an even stronger reduction in ERα phosphorylation and activity, including highly suppressed expression of two proteins under E2-dependent control (Bcl-2 and cyclin D1). The diminished Bcl-2 and cyclin D1 expression would be expected to reduce the growth rate of the cells, a hypothesis which was confirmed in subsequent cell proliferation experiments. AKR1C3 or AKR1B10 overexpression alone had no effect on doxorubicin sensitivity in MCF-7CC cells, while siRNA-mediated knockdown of AKR1C3 and/or AKR1B10 expression had no significant effect on sensitivity to doxorubicin in MCF-7DOX2 or MCF-7EPI cells. This suggested that enhanced or reduced AKR expression/activity is insufficient to confer anthracycline resistance or sensitivity to breast tumor cells, respectively. Rather, it would appear that AKR overexpression acts in concert with other proteins to confer anthracycline resistance, including reduced E2-dependent expression of both an important apoptosis inhibitor (Bcl-2) and a key protein associated with activation of cell cycle-dependent kinases (cyclin D1).


Conflict of interest statement

The authors have declared that no competing interests exist.

Figures

Fig 1
Fig 1. Assessment of Akr1c3 and Akr1b10 and γ-tubulin expression in various stable cell lines using immunblotting approaches.
(A) Representative immunoblots for assessing Akr1c3, Akr1b10 and γ-tubulin protein expression in extracts of unselected MCF-7CC cells or doxorubicin-selected MCF-7DOX2 cells (selection doses 7 through 12). Blots represent one 4 independent experiments. (B) Fold change in Akr1C3 levels relative to corresponding co-cultured control cell lines for doxorubicin-selected cell lines across selection doses 7 through 12 (based by densitometry). Fold changes are expressed as the average ± S.E.M. for 4 independent experiments. The significance of differences in Akr1c3 expression between the designated doxorubicin-elected cell line and its corresponding co-cultured control cell line was assessed using an ANOVA test, followed by a Bonferoni correction. * p< 0.05, ** p< 0.01, *** p< 0.001, **** p< 0.0001.
Fig 2
Fig 2. Assessment of Akr1c3, Akr1b10 and γ-tubulin expression in various stably and transiently transfected cell lines using immunblotting approaches.
A) Optimization of transfection using lipofectamine 2000. Lane 1 represents untreated MCF-7CC-12 cells, lane 2 is for identical cells transfected with an empty vector (pCMV-FLAG) in the presence of lipofectamine (1:2 ratio), while lanes 3, 4 and 5 are cells transfected with FLAG-tagged AKR1c3 expression vector (pCMV-AKR1C3-FLAG) at vector to lipofectamine ratios of 1:1, 1:1.5 and 1:2, respectively. B) A representative western blot assessing Akr1C3 protein expression in MCF-7CC-12 cells stably transfected with an empty vector (lanes 1, 2 and 3) or pAKR1C3-FLAG (lanes 4 and 5). C) A representative western blot assessing Akr1c3 protein expression in cells transfected with a random RNA sequence (scrambled) or with an AKR1C3-specific siRNAs (KD-1 and KD-2). D) A representative western blot assessing Akr1b10 and Akr1c3 protein expression in cells transfected with a scrambled siRNA or AKR1B10-specific siRNAs (KD-3 and KD-4).
Fig 3
Fig 3. Differences in sensitivity to doxorubicin, as measured using clonogenic assays for MCF-7CC-12 cells stably or transiently transfected with various constructs.
Survival curves are depicted for: (A) stable clones of MCF-7CC-12 cells transfected with pAKR1C3-FLAG, (B) MCF-7CC-12 cells, with or without transient transfection with the pAKR1C3-FLAG plasmid, (C) MCF-7DOX2-12 cells, with or without transient transfection with scrambled or AKR1C3-specific siRNAs, (D) MCF-7DOX2-12 cells, with or without transient transfection with scrambled or AKR1B10-specific siRNAs, (E) MCF-7DOX2-12 cells, with or without transient transfection with scrambled or both AKR1C3- and AKR1B10-specific siRNAs.
Fig 4
Fig 4. Degree of Production of Estradiol (E2) from Estrone (E1) in various cell lines under varying conditions.
(A) MCF-7DOX2-12, MCF-7EPI-12, and MCF-7CC-12 cells. (B) Clones of MCF-7CC-12 cells stably transfected with pAKR1C3-FLAG. (C) MCF-7CC-12 cells, with or without transient transfection with pAKR1C3-FLAG. Some cells were pre-treated with an AKR inhibitor (β-cholanic acid) or an aromatase inhibitor (Letrozole) for 1 h prior to the addition of 100 nM estrone. Estradiol levels were quantified using E2 ELISA kits. Bars represent the mean from 3 independent trials with technical duplicates ± S.E.M. Statistical analysis was done using an ANOVA test, followed by a Bonferoni correction. * p< 0.05, ** p< 0.01, *** p< 0.001.
Fig 5
Fig 5. Differences in ESR1 transcript levels in various cell lines, as determined by quantitative PCR (Q-PCR).
(A) ESR1 transcript levels in MCF-7 cells selected for survival in increasing concentrations (doses) of doxorubicin or epirubicin (relative to MCF-7CC-12 cells). Data for doxorubicin selection doses 7 through 12 and for epirubicin at selection dose 12 are depicted. (B) A similar approach was used to quantify ESR1 transcript levels in MCF-7 cells selected in the absence of drug to similar passage numbers as MCF-7DOX2 cells (selected to dose levels 7 through 12. All ESR1 expression values were normalized to the expression of transcripts for ribosomal protein S28. Values depicted represent the mean ± S.E.M. for three independent trials. The significance of differences in ESR1 transcript levels between the designated cell line and MCF-7CC-12 cells was assessed using an ANOVA test, followed by Bonferoni correction. n = 3, * p< 0.05, ** p< 0.001
Fig 6
Fig 6. Differences in the expression of estrogen receptor alpha (ERα), phosphorylated estrogen receptor alpha at serine 118 (P-Ser118 ER), and γ tubulin in various cell lines, as measured in immunoblotting experiments with epitope- or phospho-specific antibodies.
(A) Immunoblots were conducted using extracts of cells with or without incubation in the presence of 100 nM E2, 100 mg/ml epidermal growth factor (EGF), or a combination of E2 and EGF. Primary antibodies purchased from Cell Signaling and used at 1:1000 dilution in 0.5% BSA overnight at 4°C. (B) Fold change in Ser-118 phosphorylated estrogen receptor relative to untreated MCF-7CC-12 cells, normalized to γ-tubulin expression (left) and to basal ERα expression (right). Data is expressed as the mean fold change observed in 3 independent experiments (± S.E.M., with the value of untreated MCF-7CC-12 cells set to 1.0. (C) Fold change in ERα levels, in a manner identical to that of P-Ser118 ER. The significance of differences between the test sample and that of untreated MCF-7CC-12 cells was assessed using an ANOVA test, followed by Bonferoni correction. * = p< 0.05, ** = p< 0.001
Fig 7
Fig 7. Differences in the expression of estrogen receptor alpha (ERa), phosphorylated estrogen receptor alpha at serine 118 (P-Ser118 ER), and GAPDH during selection for survival in the absence or presence of increasing concentrations (doses) of doxorubicin (selection doses 7 through 11).
Immunoblots were conducted using extracts of cells without or with a treatment with 100 nM E2. Primary antibodies purchased from Cell Signaling and used at 1:1000 dilution in 0.5% BSA overnight at 4°C. (A) Representative western blots for Era and GAPDH. (B) Data for P-Ser118 ER is expressed relative to untreated (NT) MCF-7CC-12 cells. (C) Data for ERa is expressed relative to untreated (NT) MCF-7CC-12 cells. All expression values were first normalized to GAPDH expression. Bars represent the mean ± S.E.M. for three independent experiments. The significance of differences between the test sample and that of treated or untreated MCF-7CC-12 cells was assessed using an ANOVA test, followed by Bonferoni correction. * p< 0.05,** p< 0.01, *** p< 0.001
Fig 8
Fig 8. Relative levels of active ERα in nuclear extracts.
Active Era levels were measured in MCF-7CC cells and MCF-7DOX2 cells at selection doses 7 and 12, as determined by ERa TRANS-AM kits. Absorbances were corrected for background and expressed as a ratio (450 nM to 655 nm). Extracts were performed under basal conditions with cells grown in D-MEM to 90% confluence. Values depicted are the mean ± S.E.M. of three independent experiments, each made up of a duplicate technical replicate. The significance of differences in active ERα levels between samples was assessed using an ANOVA test, followed by Bonferoni testing. n = 3, ** p< 0.01
Fig 9
Fig 9. Expression of Bcl-2, cyclin D1, and γ tubulin proteins in various cell lines, as determined in immunoblotting experiments with epitope-specific antibodies.
(A) A representative western blot for Bcl-2 expression in MCF-7CC and MCF-7DOX2 cells at selection doses 7 and 12. Results shown are representative of 3 independent trials. (B) Fold change in Bcl-2 levels in MCF-7DOX2 cells (relative to the appropriate co-cultured control cell line). Results shown are the average of 3 independent trials. (C) A representative western blot for cyclin D1 expression in MCF-7CC and MCF-7DOX2 cells at selection doses 7 and 12. Results shown are representative of 3 independent trials. (D) Fold change in cyclin D1 levels in MCF-7DOX2 cells (relative to the appropriate co-cultured control cell line). Results shown are normalized to the expression of γ tubulin and are the average of 3 independent trials. The significance of differences in expression levels for Bcl-2 and cyclin D1 between samples was assessed using an ANOVA test, followed by Bonferoni testing. n = 3, *** p< 0.001
Fig 10
Fig 10. Artemisinin-mediated knockdown of ERα expression and its consequent effects on Bcl-2 and cyclin D1 expression in MCF-7CC-7 and MCF-7CC-12 cells.
(A) MCF-7CC-7 and MCF-7CC-12 cells were treated with either DMSO or 300 μM artemisinin. Whole cell extracts of these cells were then monitored for Bcl-2, cyclin D1, and γ tubulin protein expression using immunoblotting approaches with epitope-specific antibodies. γ tubulin was used as loading control. Blots are representative of 3 independent trials. (B) Fold changes in ERα levels induced by artemisinin in MCF-7CC cells at selection doses 7 and 12. (C) Fold changes in Bcl-2 levels induced by artemisinin in MCF-7CC cells at selection doses 7 and 12. (D) Fold changes in cyclin D1 levels induced by artemisinin in MCF-7CC cells at selection doses 7 and 12. All values depicted are the mean ± S.E.M. for 3 independent experiments. The significance of artemisinin-induced changes in the expression of the above proteins was assessed using an ANOVA test, followed by a Bonferoni correction. n = 3, *** p< 0.001
Fig 11
Fig 11. Cell growth curves for MCF-7CC-12, MCF-7DOX2-12, and MCF-7EPI-12 cells.
Exponentially growing cells were counted using a hemocytometer and introduced into T75 flasks at a density of 106 cells per 10 ml of D-MEM medium. Specific growth plots were generated using Graphpad Prism 5.0, modelled after the Gompertz growth equation. n = 3

Similar articles

Cited by

References

    1. Turner N, Biganzoli L, Di LA. Continued value of adjuvant anthracyclines as treatment for early breast cancer. Lancet Oncol. 2015;16(7):e362–e9. 10.1016/S1470-2045(15)00079-0 - DOI - PubMed
    1. Wilson RG, Kalonaros V, King M, Lockwood R, McNeill M. Comparative inhibition of nuclear RNA synthesis in cultured mouse leukemia L1210 cells by adriamycin and 4'-epi-adriamycin. Chem Biol Interact. 1981;37(3):351–63. - PubMed
    1. Komiyama T, Oki T, Inui T. Interaction of new anthracycline antibiotics with DNA. Effects on nucleic acid synthesis and binding to DNA. Biochim Biophys Acta. 1983;740(1):80–7. - PubMed
    1. Beck WT, Danks MK. Mechanisms of resistance to drugs that inhibit DNA topoisomerases. Semin Cancer Biol. 1991;2(4):235–44. - PubMed
    1. Savatier J, Rharass T, Canal C, Gbankoto A, Vigo J, Salmon JM, et al. Adriamycin dose and time effects on cell cycle, cell death, and reactive oxygen species generation in leukaemia cells. Leuk Res. 2012;36(6):791–8. 10.1016/j.leukres.2012.02.017 - DOI - PubMed

MeSH terms