

Using data from the Microsoft Kinect 2 to determine postural stability in healthy subjects: A feasibility trial
- PMID: 28196139
- PMCID: PMC5308801
- DOI: 10.1371/journal.pone.0170890
Using data from the Microsoft Kinect 2 to determine postural stability in healthy subjects: A feasibility trial
Abstract
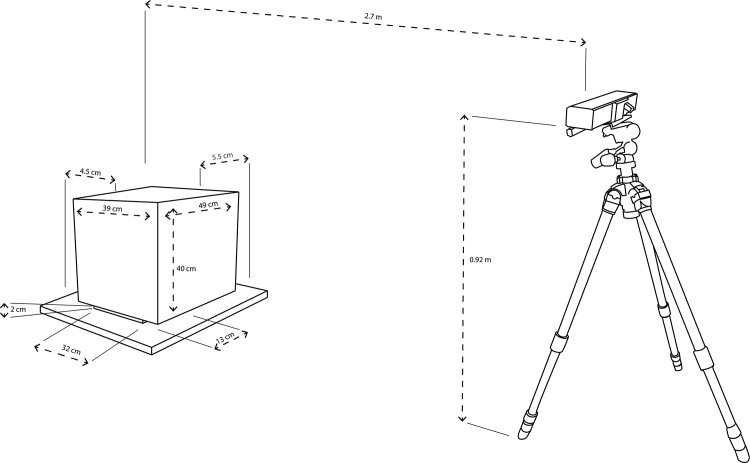
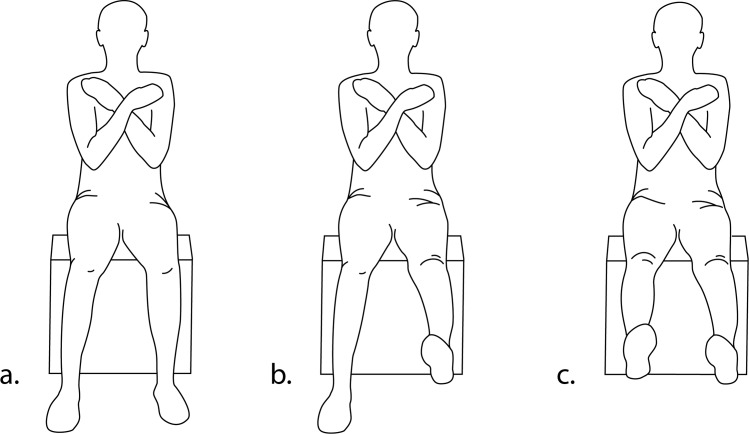
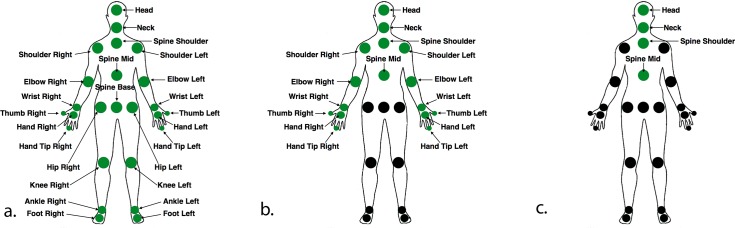
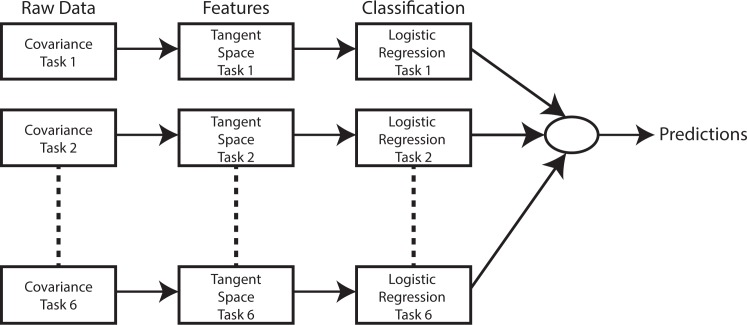
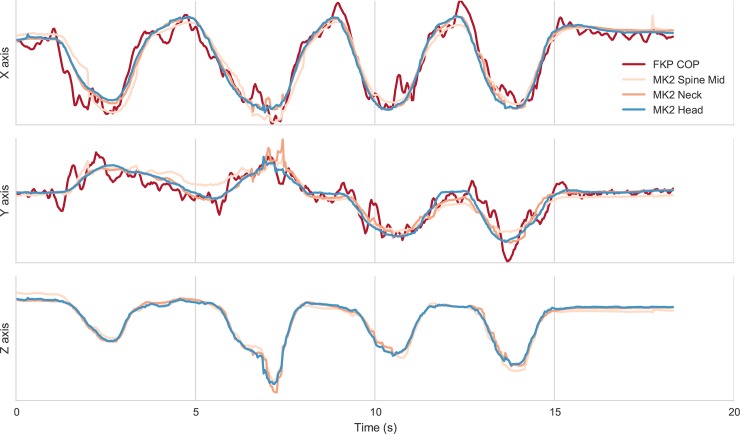
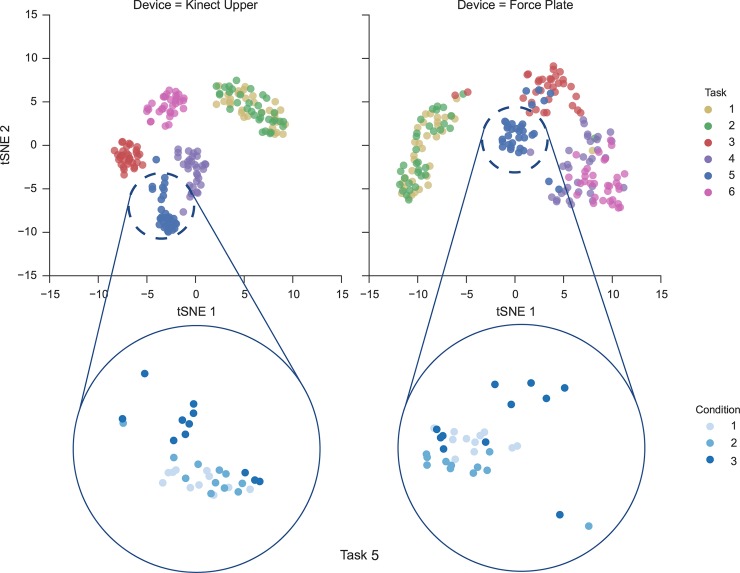
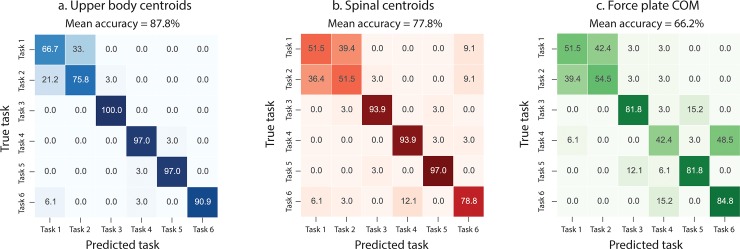
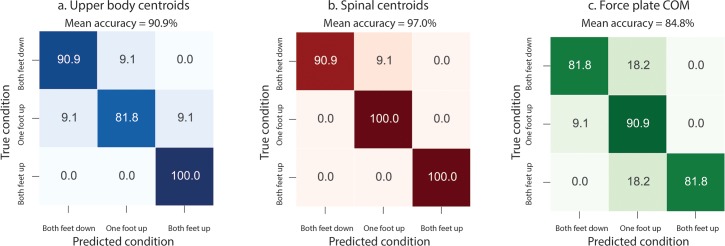
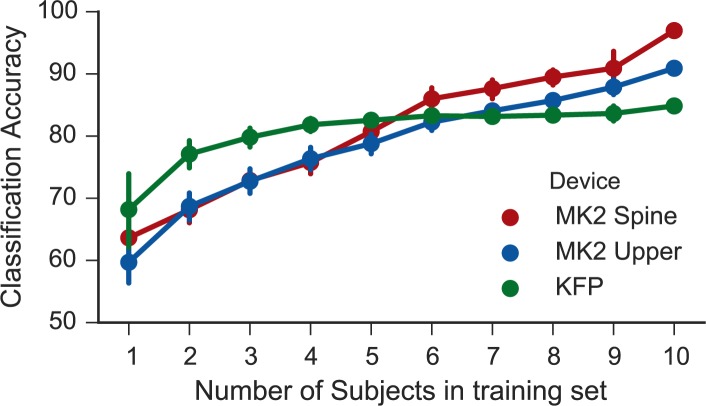
The objective of this study was to determine whether kinematic data collected by the Microsoft Kinect 2 (MK2) could be used to quantify postural stability in healthy subjects. Twelve subjects were recruited for the project, and were instructed to perform a sequence of simple postural stability tasks. The movement sequence was performed as subjects were seated on top of a force platform, and the MK2 was positioned in front of them. This sequence of tasks was performed by each subject under three different postural conditions: "both feet on the ground" (1), "One foot off the ground" (2), and "both feet off the ground" (3). We compared force platform and MK2 data to quantify the degree to which the MK2 was returning reliable data across subjects. We then applied a novel machine-learning paradigm to the MK2 data in order to determine the extent to which data from the MK2 could be used to reliably classify different postural conditions. Our initial comparison of force plate and MK2 data showed a strong agreement between the two devices, with strong Pearson correlations between the trunk centroids "Spine_Mid" (0.85 ± 0.06), "Neck" (0.86 ± 0.07) and "Head" (0.87 ± 0.07), and the center of pressure centroid inferred by the force platform. Mean accuracy for the machine learning classifier from MK2 was 97.0%, with a specific classification accuracy breakdown of 90.9%, 100%, and 100% for conditions 1 through 3, respectively. Mean accuracy for the machine learning classifier derived from the force platform data was lower at 84.4%. We conclude that data from the MK2 has sufficient information content to allow us to classify sequences of tasks being performed under different levels of postural stability. Future studies will focus on validating this protocol on large populations of individuals with actual balance impairments in order to create a toolkit that is clinically validated and available to the medical community.
Conflict of interest statement
The authors have declared that no competing interests exist.
Figures
References
-
- Bennie S, Bruner K, Dizon A, Fritz H, Goodman B, Peterson S. Measurements of Balance: Comparison of the Timed “Up and Go” Test and Functional Reach Test with the Berg Balance Scale. J Phys Ther Sci. 2003;15(2):93–7.
-
- Berg K, Wood-Dauphinee S, Williams JI. The Balance Scale: reliability assessment with elderly residents and patients with an acute stroke. Scand J Rehabil Med. 1995/03/01 ed. 1995;27(1):27–36. - PubMed
MeSH terms
LinkOut - more resources
Full Text Sources
Other Literature Sources
