

Hypoxia inducible factors regulate the transcription of the sprouty2 gene and expression of the sprouty2 protein
- PMID: 28196140
- PMCID: PMC5308774
- DOI: 10.1371/journal.pone.0171616
Hypoxia inducible factors regulate the transcription of the sprouty2 gene and expression of the sprouty2 protein
Abstract
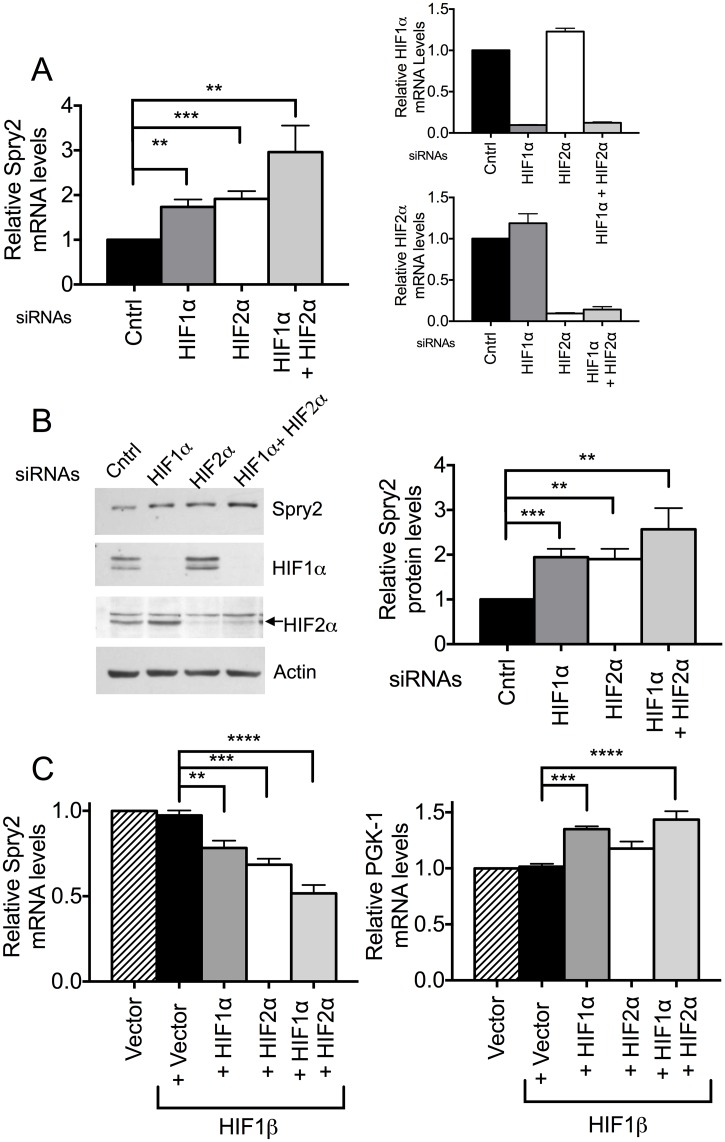
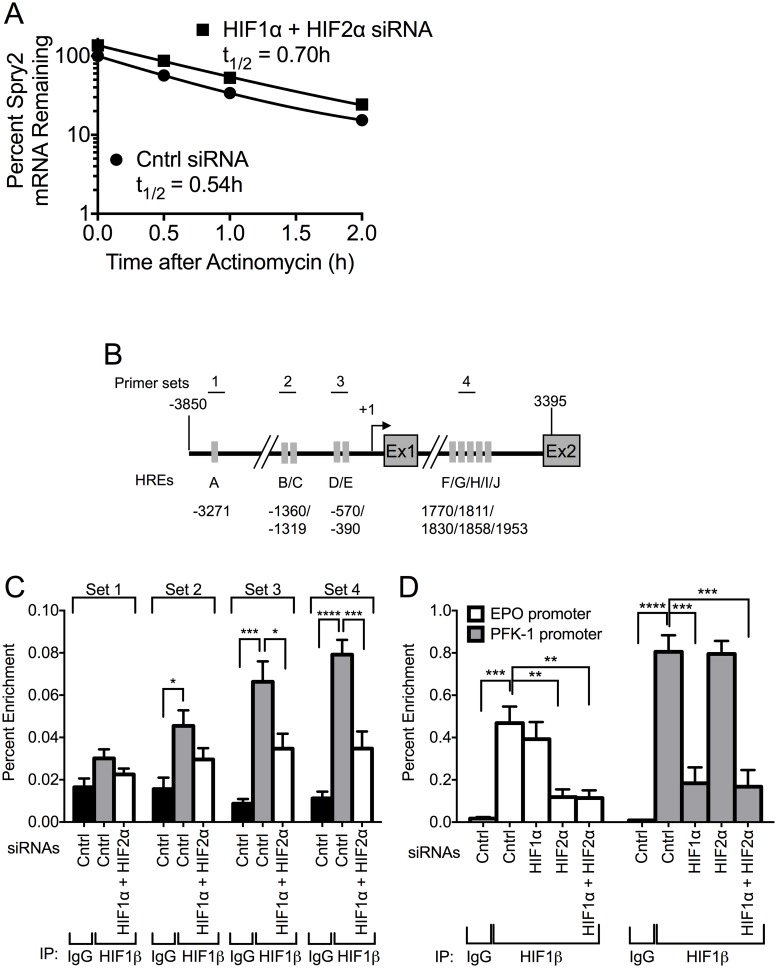
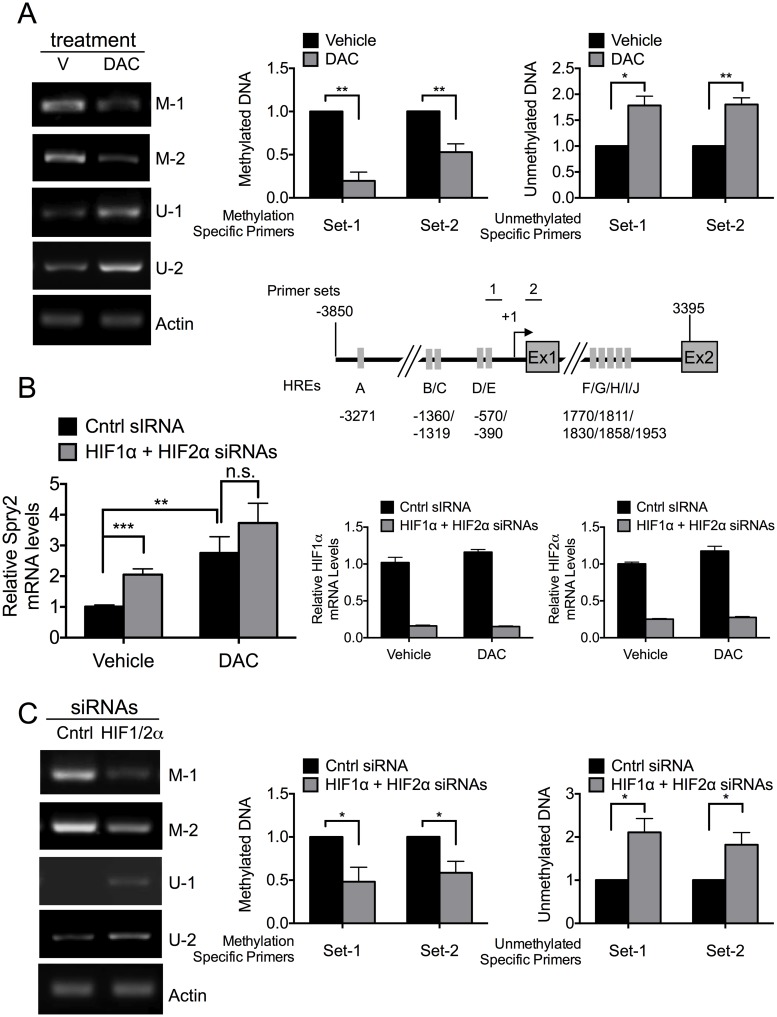
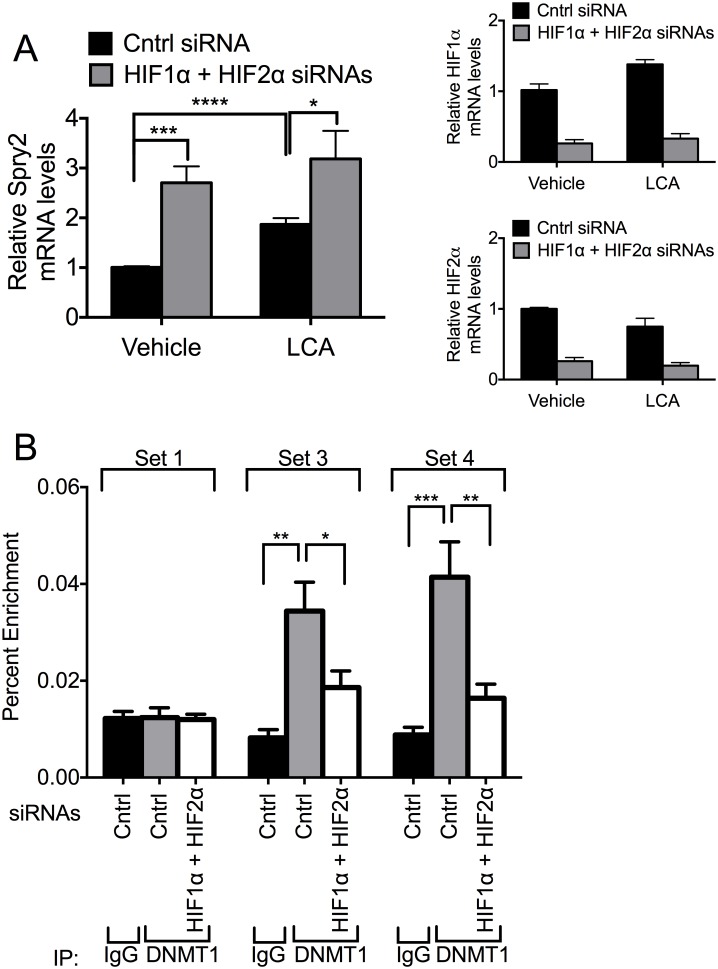
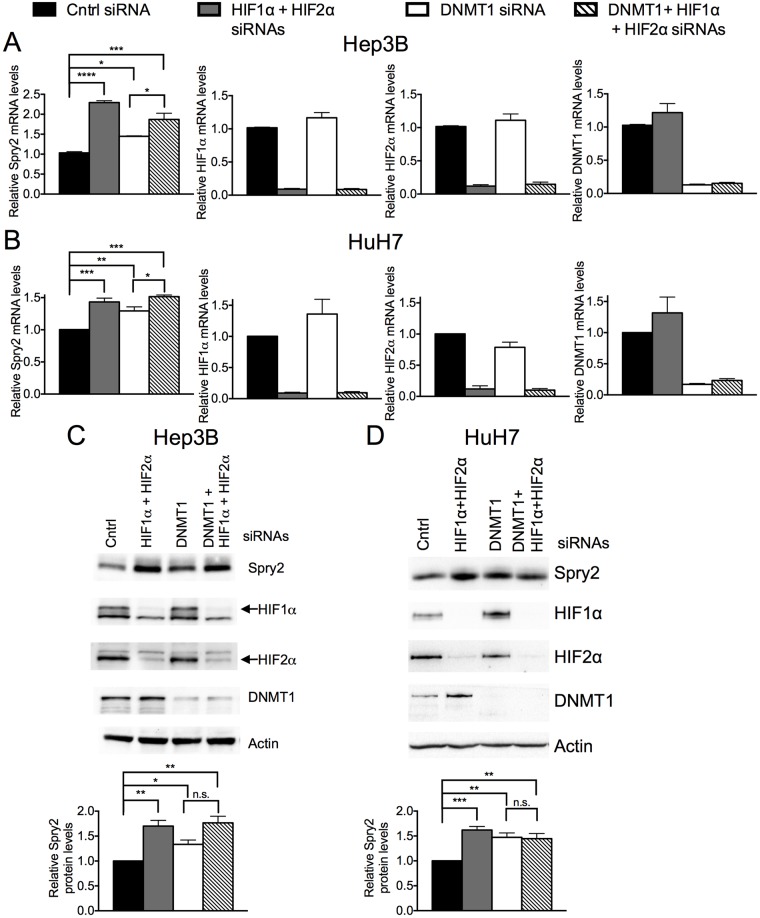
Receptor Tyrosine Kinase (RTK) signaling plays a major role in tumorigenesis and normal development. Sprouty2 (Spry2) attenuates RTK signaling and inhibits processes such as angiogenesis, cell proliferation, migration and survival, which are all upregulated in tumors. Indeed in cancers of the liver, lung, prostate and breast, Spry2 protein levels are markedly decreased correlating with poor patient prognosis and shorter survival. Thus, it is important to understand how expression of Spry2 is regulated. While prior studies have focused on the post-translation regulation of Spry2, very few studies have focused on the transcriptional regulation of SPRY2 gene. Here, we demonstrate that in the human hepatoma cell line, Hep3B, the transcription of SPRY2 is inhibited by the transcription regulating hypoxia inducible factors (HIFs). HIFs are composed of an oxygen regulated alpha subunit (HIF1α or HIF2α) and a beta subunit (HIF1β). Intriguingly, silencing of HIF1α and HIF2α elevates SPRY2 mRNA and protein levels suggesting HIFs reduce the transcription of the SPRY2 promoter. In silico analysis identified ten hypoxia response elements (HREs) in the proximal promoter and first intron of SPRY2. Using chromatin immunoprecipitation (ChIP), we show that HIF1α/2α bind near the putative HREs in the proximal promoter and intron of SPRY2. Our studies demonstrated that not only is the SPRY2 promoter methylated, but silencing HIF1α/2α reduced the methylation. ChIP assays also showed DNA methyltransferase1 (DNMT1) binding to the proximal promoter and first intron of SPRY2 and silencing HIF1α/2α decreased this association. Additionally, silencing of DNMT1 mimicked the HIF1α/2α silencing-mediated increase in SPRY2 mRNA and protein. While simultaneous silencing of HIF1α/2α and DNMT1 increased SPRY2 mRNA a little more, the increase was not additive suggesting a common mechanism by which DNMT1 and HIF1α/2α regulate SPRY2 transcription. Together these data suggest that the transcription of SPRY2 is inhibited by HIFs, in part, via DNMT1- mediated methylation.
Conflict of interest statement
The authors have declared that no competing interests exist.
Figures
Similar articles
-
Sprouty2 Protein Regulates Hypoxia-inducible Factor-α (HIFα) Protein Levels and Transcription of HIFα-responsive Genes.J Biol Chem. 2016 Aug 5;291(32):16787-801. doi: 10.1074/jbc.M116.714139. Epub 2016 Jun 8. J Biol Chem. 2016. PMID: 27281823 Free PMC article.
-
The HIF1alpha-inducible pro-cell death gene BNIP3 is a novel target of SIM2s repression through cross-talk on the hypoxia response element.Oncogene. 2009 Oct 15;28(41):3671-80. doi: 10.1038/onc.2009.228. Epub 2009 Aug 10. Oncogene. 2009. PMID: 19668230
-
FHL family members suppress vascular endothelial growth factor expression through blockade of dimerization of HIF1α and HIF1β.IUBMB Life. 2012 Nov;64(11):921-30. doi: 10.1002/iub.1089. IUBMB Life. 2012. PMID: 23086815
-
Progress on hypoxia-inducible factor-3: Its structure, gene regulation and biological function (Review).Mol Med Rep. 2015 Aug;12(2):2411-6. doi: 10.3892/mmr.2015.3689. Epub 2015 Apr 27. Mol Med Rep. 2015. PMID: 25936862 Review.
-
Regulation of hypoxia-inducible gene expression after HIF activation.Exp Cell Res. 2017 Jul 15;356(2):182-186. doi: 10.1016/j.yexcr.2017.03.013. Epub 2017 Mar 9. Exp Cell Res. 2017. PMID: 28286304 Review.
Cited by
-
Cutting Edge: Hypoxia-Induced Ubc9 Promoter Hypermethylation Regulates IL-17 Expression in Ulcerative Colitis.J Immunol. 2021 Mar 1;206(5):936-940. doi: 10.4049/jimmunol.2000015. Epub 2021 Jan 27. J Immunol. 2021. PMID: 33504619 Free PMC article.
-
The Sprouty/Spred family as tumor suppressors: Coming of age.Cancer Sci. 2019 May;110(5):1525-1535. doi: 10.1111/cas.13999. Epub 2019 Apr 23. Cancer Sci. 2019. PMID: 30874331 Free PMC article. Review.
-
LncRNA SLNCR1 facilitates angiogenesis and tumor growth in melanoma via DNMT1-mediated epigenetically silencing SPRY2.Skin Res Technol. 2024 Sep;30(9):e13910. doi: 10.1111/srt.13910. Skin Res Technol. 2024. Retraction in: Skin Res Technol. 2025 Feb-May;31(2-5):e70184. doi: 10.1111/srt.70184. PMID: 39297702 Free PMC article. Retracted.
-
Epigenetic Regulation During Hypoxia and Its Implications in Cancer.Subcell Biochem. 2022;100:361-390. doi: 10.1007/978-3-031-07634-3_11. Subcell Biochem. 2022. PMID: 36301500
-
Nature's Elixir for Cancer Treatment: Targeting Tumor-induced Neovascularization.Curr Med Chem. 2024;31(32):5281-5304. doi: 10.2174/0109298673282525240222050051. Curr Med Chem. 2024. PMID: 38425113 Review.
References
-
- Hacohen N, Kramer S, Sutherland D, Hiromi Y, Krasnow MA (1998) sprouty encodes a novel antagonist of FGF signaling that patterns apical branching of the Drosophila airways. Cell 92: 253–263. - PubMed
-
- Casci T, Vinos J, Freeman M (1999) Sprouty, an intracellular inhibitor of Ras signaling. Cell 96: 655–665. - PubMed
MeSH terms
Substances
LinkOut - more resources
Full Text Sources
Other Literature Sources
