

Association Between the Probability of Autism Spectrum Disorder and Normative Sex-Related Phenotypic Diversity in Brain Structure
- PMID: 28196230
- PMCID: PMC5470405
- DOI: 10.1001/jamapsychiatry.2016.3990
Association Between the Probability of Autism Spectrum Disorder and Normative Sex-Related Phenotypic Diversity in Brain Structure
Retracted and republished in
-
Notice of Retraction and Replacement: Ecker et al. Association between the probability of autism spectrum disorder and normative sex-related phenotypic diversity in brain structure. JAMA Psychiatry. 2017;74(4):329-338.JAMA Psychiatry. 2019 May 1;76(5):549-550. doi: 10.1001/jamapsychiatry.2018.4296. JAMA Psychiatry. 2019. PMID: 30916715 No abstract available.
Abstract
Importance: Autism spectrum disorder (ASD) is 2 to 5 times more common in male individuals than in female individuals. While the male preponderant prevalence of ASD might partially be explained by sex differences in clinical symptoms, etiological models suggest that the biological male phenotype carries a higher intrinsic risk for ASD than the female phenotype. To our knowledge, this hypothesis has never been tested directly, and the neurobiological mechanisms that modulate ASD risk in male individuals and female individuals remain elusive.
Objectives: To examine the probability of ASD as a function of normative sex-related phenotypic diversity in brain structure and to identify the patterns of sex-related neuroanatomical variability associated with low or high probability of ASD.
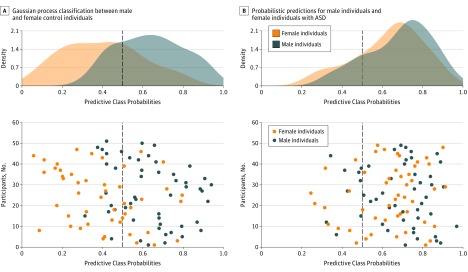
Design, setting, and participants: This study examined a cross-sectional sample of 98 right-handed, high-functioning adults with ASD and 98 matched neurotypical control individuals aged 18 to 42 years. A multivariate probabilistic classification approach was used to develop a predictive model of biological sex based on cortical thickness measures assessed via magnetic resonance imaging in neurotypical controls. This normative model was subsequently applied to individuals with ASD. The study dates were June 2005 to October 2009, and this analysis was conducted between June 2015 and July 2016.
Main outcomes and measures: Sample and population ASD probability estimates as a function of normative sex-related diversity in brain structure, as well as neuroanatomical patterns associated with low or high ASD probability in male individuals and female individuals.
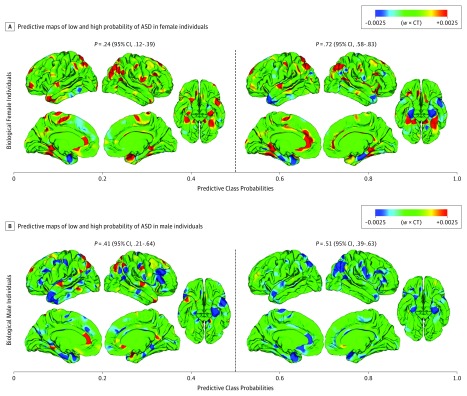
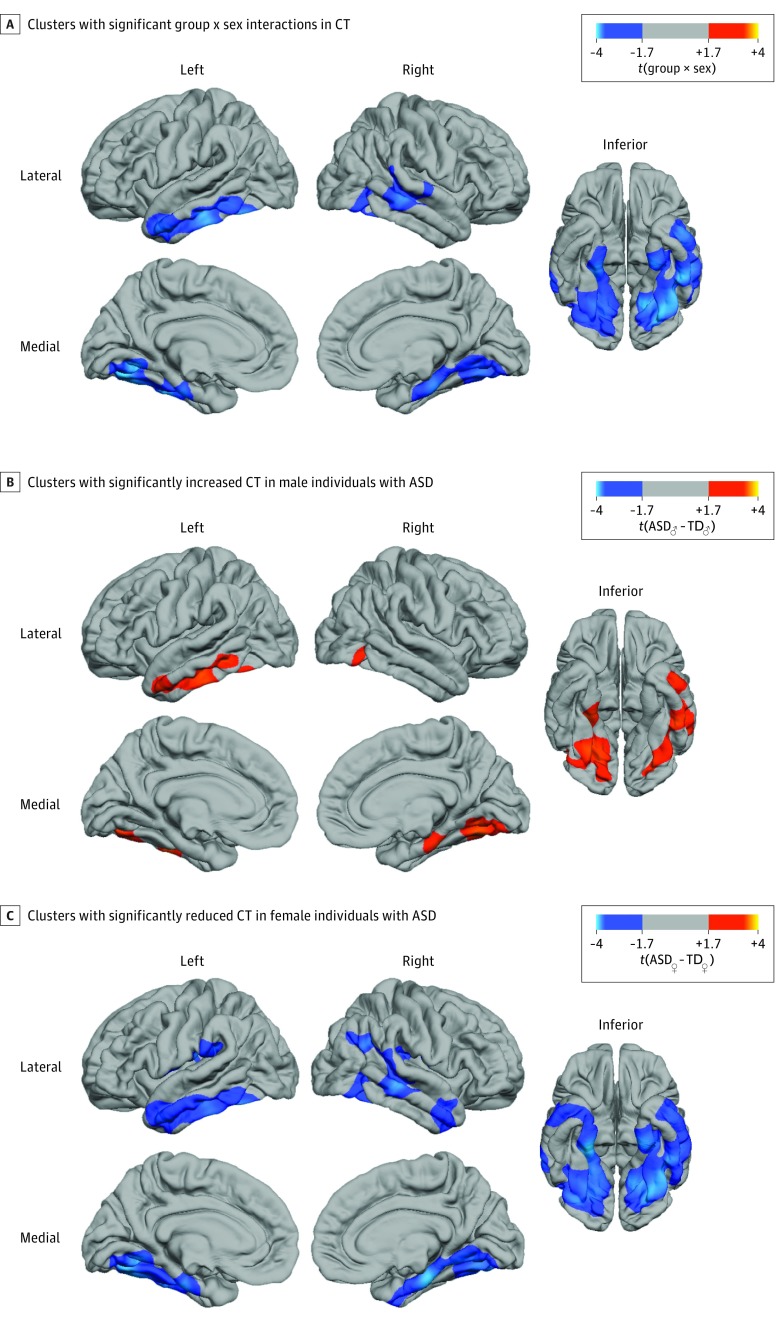
Results: Among the 98 individuals with ASD, 49 were male and 49 female, with a mean (SD) age of 26.88 (7.18) years. Among the 98 controls, 51 were male and 47 female, with a mean (SD) age of 27.39 (6.44) years. The sample probability of ASD increased significantly with predictive probabilities for the male neuroanatomical brain phenotype. For example, biological female individuals with a more male-typic pattern of brain anatomy were significantly (ie, 3 times) more likely to have ASD than biological female individuals with a characteristically female brain phenotype (P = .72 vs .24, respectively; χ21 = 20.26; P < .001; difference in P values, 0.48; 95% CI, 0.29-0.68). This finding translates to an estimated variability in population prevalence from 0.2% to 1.3%, respectively. Moreover, the patterns of neuroanatomical variability carrying low or high ASD probability were sex specific (eg, in inferior temporal regions, where ASD has different neurobiological underpinnings in male individuals and female individuals).
Conclusions and relevance: These findings highlight the need for considering normative sex-related phenotypic diversity when determining an individual's risk for ASD and provide important novel insights into the neurobiological mechanisms mediating sex differences in ASD prevalence.
Conflict of interest statement
Figures
Comment in
-
A New Link Between Autism and Masculinity.JAMA Psychiatry. 2017 Apr 1;74(4):318. doi: 10.1001/jamapsychiatry.2016.4066. JAMA Psychiatry. 2017. PMID: 28196210 No abstract available.
References
-
- Fombonne E. Epidemiology of autistic disorder and other pervasive developmental disorders. J Clin Psychiatry. 2005;66(suppl 10):3-8. - PubMed
-
- Szatmari P, Liu XQ, Goldberg J, et al. . Sex differences in repetitive stereotyped behaviors in autism: implications for genetic liability. Am J Med Genet B Neuropsychiatr Genet. 2012;159B(1):5-12. - PubMed
-
- Dworzynski K, Ronald A, Bolton P, Happé F. How different are girls and boys above and below the diagnostic threshold for autism spectrum disorders? J Am Acad Child Adolesc Psychiatry. 2012;51(8):788-797. - PubMed
Publication types
MeSH terms
Grants and funding
LinkOut - more resources
Full Text Sources
Other Literature Sources
Medical
