. 2017 Feb 14;317(6):626-634.
doi: 10.1001/jama.2016.21042.

Genetic Association of Waist-to-Hip Ratio With Cardiometabolic Traits, Type 2 Diabetes, and Coronary Heart Disease

Affiliations

Genetic Association of Waist-to-Hip Ratio With Cardiometabolic Traits, Type 2 Diabetes, and Coronary Heart Disease

Connor A Emdin et al. JAMA. .

Abstract

Importance: In observational studies, abdominal adiposity has been associated with type 2 diabetes and coronary heart disease (CHD). Whether these associations represent causal relationships remains uncertain.

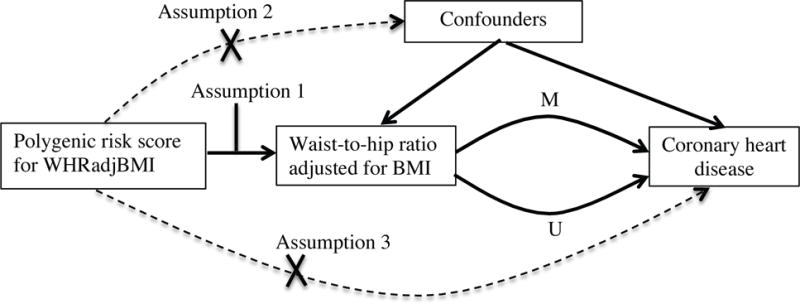
Objective: To test the association of a polygenic risk score for waist-to-hip ratio (WHR) adjusted for body mass index (BMI), a measure of abdominal adiposity, with type 2 diabetes and CHD through the potential intermediates of blood lipids, blood pressure, and glycemic phenotypes.

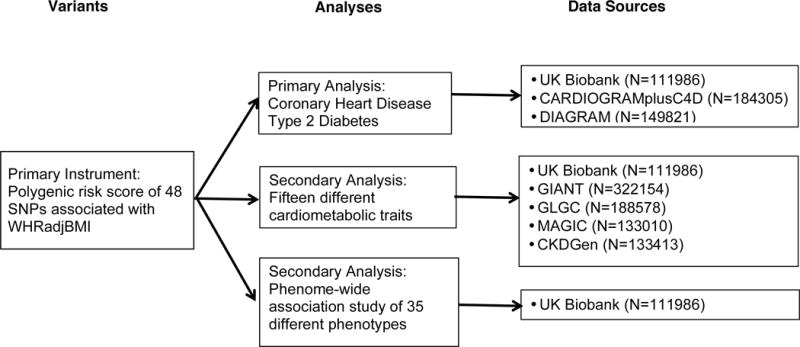
Design, setting, and participants: A polygenic risk score for WHR adjusted for BMI, a measure of genetic predisposition to abdominal adiposity, was constructed with 48 single-nucleotide polymorphisms. The association of this score with cardiometabolic traits, type 2 diabetes, and CHD was tested in a mendelian randomization analysis that combined case-control and cross-sectional data sets. Estimates for cardiometabolic traits were based on a combined data set consisting of summary results from 4 genome-wide association studies conducted from 2007 to 2015, including up to 322 154 participants, as well as individual-level, cross-sectional data from the UK Biobank collected from 2007-2011, including 111 986 individuals. Estimates for type 2 diabetes and CHD were derived from summary statistics of 2 separate genome-wide association studies conducted from 2007 to 2015 and including 149 821 individuals and 184 305 individuals, respectively, combined with individual-level data from the UK Biobank.

Exposures: Genetic predisposition to increased WHR adjusted for BMI.

Main outcomes and measures: Type 2 diabetes and CHD.

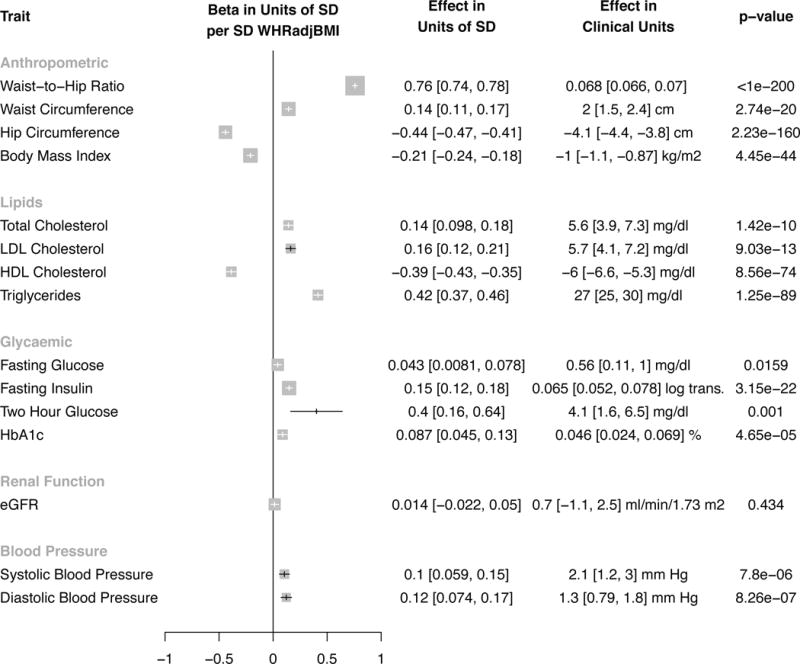
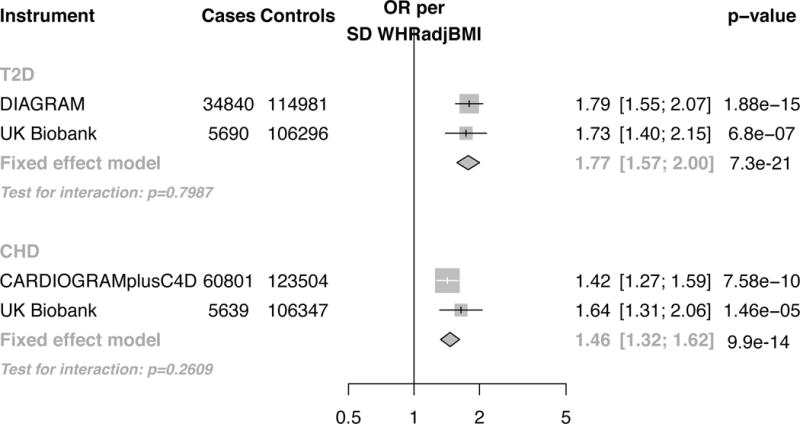
Results: Among 111 986 individuals in the UK Biobank, the mean age was 57 (SD, 8) years, 58 845 participants (52.5%) were women, and mean WHR was 0.875. Analysis of summary-level genome-wide association study results and individual-level UK Biobank data demonstrated that a 1-SD increase in WHR adjusted for BMI mediated by the polygenic risk score was associated with 27-mg/dL higher triglyceride levels, 4.1-mg/dL higher 2-hour glucose levels, and 2.1-mm Hg higher systolic blood pressure (each P < .001). A 1-SD genetic increase in WHR adjusted for BMI was also associated with a higher risk of type 2 diabetes (odds ratio, 1.77 [95% CI, 1.57-2.00]; absolute risk increase per 1000 participant-years, 6.0 [95% CI, CI, 4.4-7.8]; number of participants with type 2 diabetes outcome, 40 530) and CHD (odds ratio, 1.46 [95% CI, 1.32-1.62]; absolute risk increase per 1000 participant-years, 1.8 [95% CI, 1.3-2.4]; number of participants with CHD outcome, 66 440).

Conclusions and relevance: A genetic predisposition to higher waist-to-hip ratio adjusted for body mass index was associated with increased risk of type 2 diabetes and coronary heart disease. These results provide evidence supportive of a causal association between abdominal adiposity and these outcomes.


Figures

Figure 1
Figure 1
Assumptions of a Mendelian randomization analysis. Genetic variants, which are assigned at birth and largely randomly assorted in a population, can be used as instrumental variables to estimate the causal association of an exposure (e.g., WHRadjBMI) with an outcome of interested (e.g., coronary heart disease). This approach rests on three assumptions, denoted with Assumption 1 through Assumption 3 above. First, the genetic variants must be associated with the exposure (Assumption 1). Second, the genetic variants must not be associated with confounders (Assumption 2). Third, the genetic variants must influence risk of the outcome through the exposure and not through other pathways (Assumption 3). Mendelian randomization can be extended to estimate the association of exposure with outcome that is mediated (M in Figure 1) by a given a mediator (e.g., triglycerides) and that is not mediated (U in Figure 1) by that mediator.
Figure 2
Figure 2
Study design. Shown are variants in the primary instrument used to estimate the association of waist-to-hip ratio adjusted for body mass index with cardiometabolic quantitative traits, type 2 diabetes, and coronary heart disease; sources of data for analysis including UK Biobank and publicly-available genome-wide association studies. Abbreviations: WHRadjBMI, waist-to-hip ratio adjusted for body mass index; BMI, body mass index; SNP; single nucleotide polymorphism; CARDIOGRAMplusC4D, Coronary ARtery DIsease Genome-wide Replication and Meta-analysis plus The Coronary Artery Disease Genetics consortium; DIAGRAM, DIAbetes Genetics Replication And Meta-analysis; GIANT, Genetic Investigation of ANthropometric Traits,; GLGC, Global Lipids Genetics Consortium; MAGIC, Meta-Analyses of Glucose and Insulin-related traits Consortium; CKDGen, Chronic Kidney Disease Genetics Consortium.
Figure 3
Figure 3
Association of 48 SNP polygenic risk score for WHRadjBMI with cardiometabolic quantitative traits. Results are standardized to a one SD increase in WHRadjBMI due to polygenic risk score. For systolic blood pressure, a one SD genetic increase WHRadjBMI is associated with a 2.1 mm Hg higher systolic blood pressure (95% CI 1.2, 3.0), or a 0.1 standard deviation increase in systolic blood pressure (CI 0.059, 0.15). For anthropometric traits, estimates from Genetic Investigation of Anthropometric Traits (GIANT – derived using inverse variance weighted fixed effects meta-analysis,) were pooled with UK Biobank (derived instrumental variables regression adjusting for age, sex, ten principal components of ancestry and array type) using inverse variance weighted fixed effects meta-analysis. For lipids, glycaemic and renal function traits, estimates were derived from genome-wide association studies (Global Lipids Genetics, Meta-analyses of Glucose and Insulin-related Traits and Chronic Kidney Genetics Consortia, respectively). For blood pressure, estimates were derived from UK Biobank. Two hour glucose refers to measured blood glucose levels two hour after consumption of dissolved glucose. 95% confidence intervals are reported beside associations. The threshold of significance was p<0.0033 (0.05/15=0.0033). Error bars refer to the 95% confidence interval for each estimate. Size of data marker is inversely proportional to variance of estimate. Abbreviations: OR, odds ratio; SD, standard deviation; WHRadjBMI, waist-to-hip ratio adjusted for body mass index; waist-to-hip ratio, WHR; body mass index, BMI; LDL cholesterol, low-density lipoprotein cholesterol; HDL cholesterol, high-density lipoprotein cholesterol; HbA1c, hemoglobin a1c; eGFR, estimated glomerular filtration rate; SBP, systolic blood pressure; DBP, diastolic blood pressure; waist, waist circumference; hip, hip circumference; beta, beta coefficient.
Figure 4
Figure 4
Association of 48 SNP polygenic risk score for WHRadjBMI with type 2 diabetes and coronary heart disease. Results are standardized to a one SD increase in WHRadjBMI due to polygenic risk score. Estimates were independently derived in genome-wide association studies (CARDIOGRAMplusC4D for coronary heart disease and DIAGRAM for type 2 diabetes) and UK Biobank. The threshold of significance was p< 0.025 (0.05/2=0.025). Error bars refer to the 95% confidence interval for each estimate. Size of data marker is inversely proportional to variance of estimate. Abbreviations: OR, odds ratio; SD, standard deviation; SNPs, single nucleotide polymorphisms; WHRadjBMI, waist-to-hip ratio adjusted for body mass index; CHD, coronary heart disease; T2D, type 2 diabetes; CARDIOGRAMplusC4D, Coronary ARtery DIsease Genome-wide Replication and Meta-analysis plus The Coronary Artery Disease Genetics consortium; DIAGRAM, DIAbetes Genetics Replication And Meta-analysis.
Figure 5
Figure 5
A phenome-wide association study testing if 48 SNP polygenic risk score for WHRadjBMI is associated with a range of disease phenotypes. Results are standardized to a one SD increase in WHRadjBMI due to polygenic risk score. All estimates were derived in UK Biobank using instrumental variables regression (adjusting for age, sex and ten principal components of ancestry). The threshold for significance was p<0.0014 (0.05/35 = 0.0014). Error bars refer to the 95% confidence interval for each estimate. Size of data marker is inversely proportional to variance of estimate. Abbreviations: WHRadjBMI, waist-to-hip ratio adjusted for body mass index; OR, odds ratio; SD, standard deviation; SNPs, single nucleotide polymorphisms; COPD, chronic obstructive pulmonary disease.

Comment in

References

    1. Nordestgaard BG, Palmer TM, Benn M, et al. The effect of elevated body mass index on ischemic heart disease risk: causal estimates from a Mendelian randomisation approach. In: Minelli C, editor. PLoS medicine. 5. Vol. 9. 2012. p. e1001212. - DOI - PMC - PubMed
    1. Prospective Studies Collaboration. Whitlock G, Lewington S, et al. Body-mass index and cause-specific mortality in 900 000 adults: collaborative analyses of 57 prospective studies. Lancet. 2009;373(9669):1083–1096. doi: 10.1016/S0140-6736(09)60318-4. - DOI - PMC - PubMed
    1. Després J-P. Body fat distribution and risk of cardiovascular disease: an update. Circulation. 2012;126(10):1301–1313. doi: 10.1161/CIRCULATIONAHA.111.067264. - DOI - PubMed
    1. Ashwell M, Cole TJ, Dixon AK. Obesity: new insight into the anthropometric classification of fat distribution shown by computed tomography. Br Med J (Clin Res Ed) 1985;290(6483):1692–1694. - PMC - PubMed
    1. Seidell JC, Björntorp P, Sjöström L, Sannerstedt R, Krotkiewski M, Kvist H. Regional distribution of muscle and fat mass in men–new insight into the risk of abdominal obesity using computed tomography. Int J Obes. 1989;13(3):289–303. - PubMed

Publication types

MeSH terms