. 2017 Feb 14;17(1):52.
doi: 10.1186/s12862-017-0906-2.

Metabolite toxicity determines the pace of molecular evolution within microbial populations

Affiliations

Metabolite toxicity determines the pace of molecular evolution within microbial populations

Elin E Lilja et al. BMC Evol Biol. .

Abstract

Background: The production of toxic metabolites has shaped the spatial and temporal arrangement of metabolic processes within microbial cells. While diverse solutions to mitigate metabolite toxicity have evolved, less is known about how evolution itself is affected by metabolite toxicity. We hypothesized that the pace of molecular evolution should increase as metabolite toxicity increases. At least two mechanisms could cause this. First, metabolite toxicity could increase the mutation rate. Second, metabolite toxicity could increase the number of available mutations with large beneficial effects that selection could act upon (e.g., mutations that provide tolerance to toxicity), which consequently would increase the rate at which those mutations increase in frequency.

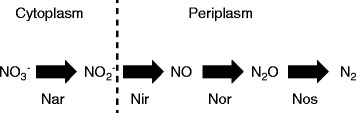
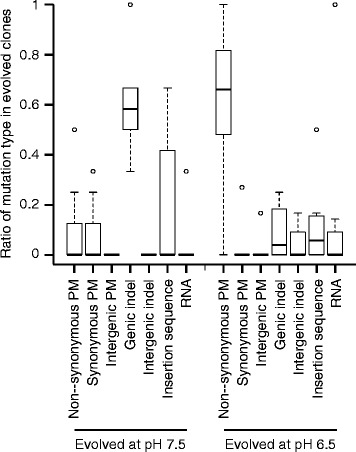
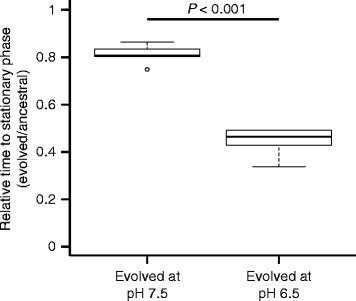
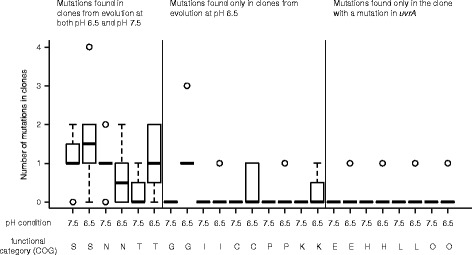
Results: We tested this hypothesis by experimentally evolving the bacterium Pseudomonas stutzeri under denitrifying conditions. The metabolite nitrite accumulates during denitrification and has pH-dependent toxic effects, which allowed us to evolve P. stutzeri at different magnitudes of nitrite toxicity. We demonstrate that increased nitrite toxicity results in an increased pace of molecular evolution. We further demonstrate that this increase is generally due to an increased number of available mutations with large beneficial effects and not to an increased mutation rate.

Conclusions: Our results demonstrate that the production of toxic metabolites can have important impacts on the evolutionary processes of microbial cells. Given the ubiquity of toxic metabolites, they could also have implications for understanding the evolutionary histories of biological organisms.

Keywords: Denitrification; Experimental evolution; Microbial populations; Molecular evolution; Nitrite toxicity.


Figures

Fig. 1
Fig. 1
The denitrification pathway of P. stutzeri. Nitrate is first reduced to nitrite in the cytoplasm. Nitrite is then actively transported to the periplasmic space where it is further reduced through several intermediates to dinitrogen gas. The consequence is that nitrite accumulates in the periplasm. Enzymes: Nar, nitrate reductase; Nir, nitrite reductase; Nor, nitric oxide reductase; Nos, nitrous oxide reductase
Fig. 2
Fig. 2
The number of mutations that accumulated in clones after evolution at pH 6.5 (strong nitrite toxicity) or pH 7.5 (weak nitrite toxicity). Horizontal bars and P-values indicate the outcomes of two-sample Wilcoxon rank-sum tests. The arrow indicates the clone with a mutation in uvrA. Data are presented as Tukey box-plots
Fig. 3
Fig. 3
The types of mutations that accumulated in clones after evolution at pH 6.5 (strong nitrite toxicity) or pH 7.5 (weak nitrite toxicity). Each mutation was categorized by type and frequency among all mutations. Data are presented as Tukey box-plots
Fig. 4
Fig. 4
Relative time to stationary phase for each experimental evolution condition. Data are the time to reach stationary phase for the evolved clones divided by the time to stationary phase for the ancestral clones. The horizontal bar and P-value indicates the outcome of a two-sample Wilcoxon rank-sum test. The asterisk indicates P < 0.05. The data are presented as Tukey box-plots
Fig. 5
Fig. 5
Competitive fitness of evolved clones relative to the ancestor. Evolved cells were initially present in the culture at a frequency of 5%. Differences were compared using an ANOVA test followed by a post hoc Tukey’s HSD test. Significant differences correspond to P < 0.01. Alphabetic assignments indicate groups that are statistically different from each other
Fig. 6
Fig. 6
Functional categorization of genes that contain mutations in evolved clones for each experimental evolution condition. Each mutation was categorized by type. Data are presented as Tukey box-plots. Functional categories (COG): S, function unknown; N, cell motility; T, signal transduction; G, carbohydrate transport and metabolism; I, lipid transport and metabolism; C, energy production and conversion; P, inorganic ion transport and metabolism; K, transcription; E, amino acid transport and metabolism; H, coenzyme transport and metabolism; L, replication, recombination and repair; O, posttranslational modification, protein turnover, and chaperones
Fig. 7
Fig. 7
Performance of evolved and ancestral clones to utilize alternative carbon substrates. Carbon utilization was measured for 95 different carbon substrates. Performance was quantified as the area under the growth curve for each individual carbon substrate (OD600 vs. time), which takes into account both growth rate and yield. Data are presented as histograms. (a) Comparison of clones evolved at pH 7.5 with ancestral populations at pH 7.5; (b) comparison of clones evolved at pH 6.5 with ancestral clones at pH 6.5; (c) comparison of ancestral clones at pH 6.5 with ancestral clones at pH 7.5; (d) comparison of clones evolved at pH 6.5 with clones evolved at pH 7.5

References

    1. de Lorenzo V, Sekowska A, Danchin A. Chemical reactivity drives spatiotemporal organisation of bacterial metabolism. FEMS Microbiol Rev. 2015;39:96–119. - PubMed
    1. Ferguson SJ. Denitrification and its control. Antonie Van Leeuwenhoek. 1994;68:89–110. doi: 10.1007/BF00871634. - DOI - PubMed
    1. Zumft WG. The biological role of nitric oxide in bacteria. Arch Microbiol. 1993;160:253–64. doi: 10.1007/BF00292074. - DOI - PubMed
    1. Vollack K, Zumft WG. Nitric oxide signaling and transcriptional control of denitrification genes in Pseudomonas stutzeri. J Bacteriol. 2001;183:2516–26. doi: 10.1128/JB.183.8.2516-2526.2001. - DOI - PMC - PubMed
    1. Nathan CF, Hibbs JB. Role of nitric oxide synthesis in macrophage antimicrobial activity. Curr Opin Immunol. 1991;3:65–70. doi: 10.1016/0952-7915(91)90079-G. - DOI - PubMed

Substances

LinkOut - more resources