. 2017 Feb 14;18(1):161.
doi: 10.1186/s12864-017-3575-z.

2.7 million samples genotyped for HLA by next generation sequencing: lessons learned

Affiliations

2.7 million samples genotyped for HLA by next generation sequencing: lessons learned

Gerhard Schöfl et al. BMC Genomics. .

Abstract

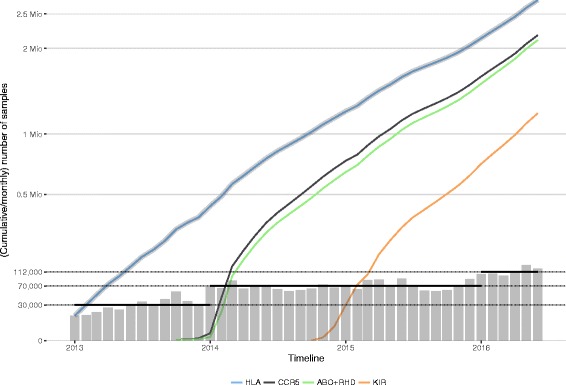
Background: At the DKMS Life Science Lab, Next Generation Sequencing (NGS) has been used for ultra-high-volume high-resolution genotyping of HLA loci for the last three and a half years. Here, we report on our experiences in genotyping the HLA, CCR5, ABO, RHD and KIR genes using a direct amplicon sequencing approach on Illumina MiSeq and HiSeq 2500 instruments.

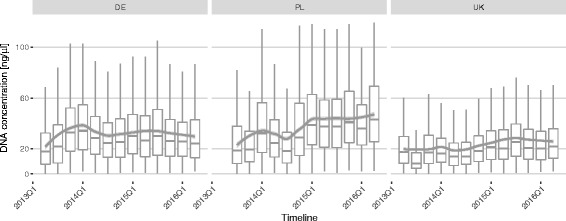
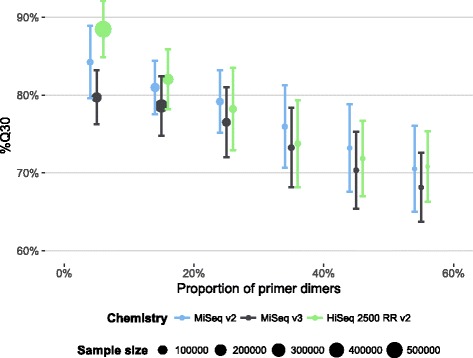
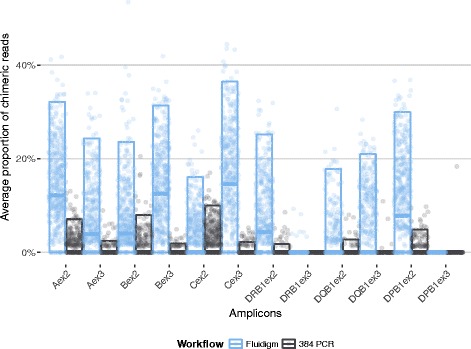
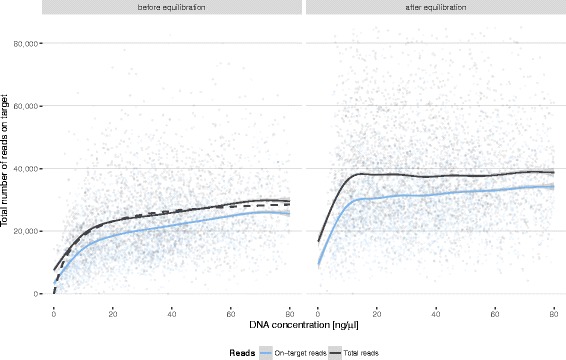
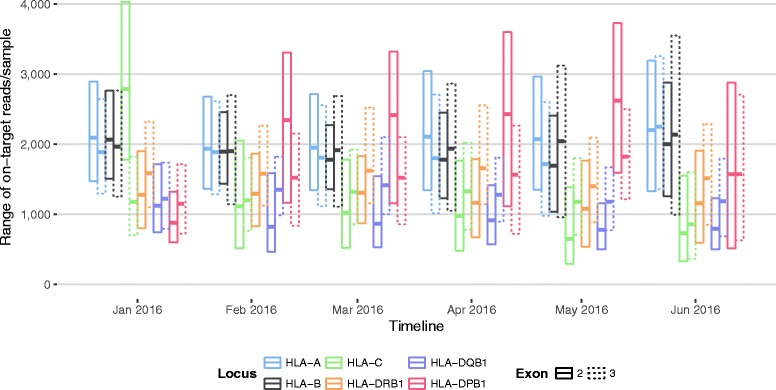
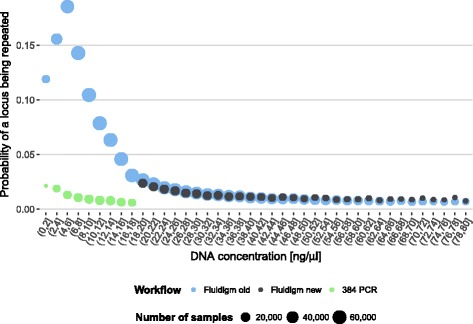
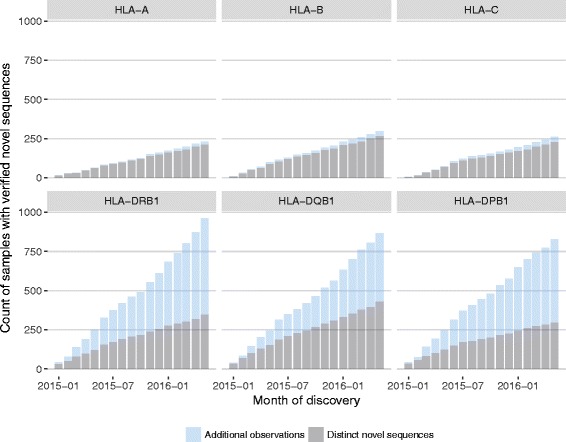
Results: Between January 2013 and June 2016, 2,714,110 samples largely from German, Polish and UK-based potential stem cell donors have been processed. 98.9% of all alleles for the targeted HLA loci (HLA-A, -B, -C, -DRB1, -DQB1 and -DPB1) were typed at high resolution or better. Initially a simple three-step workflow based on nanofluidic chips in conjunction with 4-primer amplicon tagging was used. Over time, we found that this setup results in PCR artefacts such as primer dimers and PCR-mediated recombination, which may necessitate repeat typing. Split workflows for low- and high-DNA-concentration samples helped alleviate these problems and reduced average per-locus repeat rates from 3.1 to 1.3%. Further optimisations of the workflow included the use of phosphorothioate oligos to reduce primer degradation and primer dimer formation, and employing statistical models to predict read yield from initial template DNA concentration to avoid intermediate quantification of PCR products. Finally, despite the populations typed at DKMS Life Science Lab being relatively homogenous genetically, an analysis of 1.4 million donors processed between January 2015 and May 2016 led to the discovery of 1,919 distinct novel HLA alleles.

Conclusions: Amplicon-based NGS HLA genotyping workflows have become the workhorse in high-volume tissue typing of registry donors. The optimisation of workflow practices over multiple years has led to insights and solutions that improve the efficiency and robustness of short amplicon based genotyping workflows.

Keywords: Amplicon PCR; DKMS; HLA genotyping; High resolution; High throughput; Next generation sequencing; Novel alleles; PCR chimerism; Primer dimers.


Figures

Fig. 1
Fig. 1
Cumulative and monthly numbers of donor samples genotyped at the DKMS Life Science Lab since 2013 as part of routine operations. The grey line shows the total cumulative number of genotyped samples, the coloured lines show gene-specific cumulative numbers; grey-shaded bars indicate monthly throughput. Black horizontal bars show (bi-)yearly mean throughput. The y-axis is square root scaled to enhance readability
Fig. 2
Fig. 2
Quarterly average concentration of donor DNA extracted from buccal cells. Panels present differences between Germany (DE), Poland (PL) and the UK. Overall trend lines are generated by LOESS smoothing
Fig. 3
Fig. 3
Reads passing filter vs. cluster density on Illumina MiSeq and HiSeq instruments. Each data point represents a run (flowcell). Shaded areas denote supported ranges of cluster densities and expected output for different chemistries/kits as specified by Illumina. The colour gradient indicates the total percentage of bases reaching a quality score of 30 or higher per run. Trend lines are generated by generalised additive model fits using a cubic penalised regression spline. M = millions
Fig. 4
Fig. 4
Average percentage of bases reaching a quality score of 30 or higher per run (± SD) vs. proportion of primer dimers (binned into 10% intervals)
Fig. 5
Fig. 5
Dependency of primer dimer rate from initial DNA concentration and workflow. The two workflows differ both in their reaction volumes and amplification strategies (Fluidigm: single PCR, 4 primers; 384 PCR: 2 PCRs, 2 primers each). Solid lines depict generalised additive model fits using a cubic penalised regression spline. The shaded bands around the regression lines indicate the pointwise 95% confidence intervals on the fitted values
Fig. 6
Fig. 6
Proportion of PCR-mediated recombinant reads (chimeric reads) for different HLA amplicons and different workflows (see Methods for details)
Fig. 7
Fig. 7
Correlation between initial DNA concentration and read coverage per sample before (left panel) and after (right panel) August 2014. In August 2014 a new post-PCR equilibration strategy was introduced based on a Michaelis-Menten saturation curve (dashed line, left panel) estimated from the data. Solid lines show generalised additive model fits using a cubic penalised regression spline. The shaded bands around the regression lines indicate the pointwise 95% confidence intervals on the fitted values
Fig. 8
Fig. 8
Distribution of on-target paired-end reads across amplicons. Different colours indicate different HLA loci. Solid lines indicate exon 2 amplicons; dashed lines indicate exon 3 amplicons
Fig. 9
Fig. 9
Monthly median repetition rate of HLA loci for different workflows (see Methods for details). Error bars show median absolute deviation (MAD). If more than 4 loci of a sample require repetition, the full sample (yellow bars) is repeated
Fig. 10
Fig. 10
Dependency between initial template DNA concentration and the number of HLA loci per donor that have to be verified in repeat typing. Colours indicate different workflows (see Methods for detail). The point size is indicative of sample size
Fig. 11
Fig. 11
The cumulative numbers of novel HLA alleles discovered between January 2015 and May 2016 during routine genotyping of exons 2 and 3. All allelic sequences were verified by replicate typing using an independent PCR reaction. Grey shades denote distinct novel sequences; blue shades denote additional samples with previously observed novel sequences

References

    1. Trowsdale J, Knight JC. Major histocompatibility complex genomics and human disease. Annu Rev Genomics Hum Genet. 2013;14:301–23. doi: 10.1146/annurev-genom-091212-153455. - DOI - PMC - PubMed
    1. Loiseau P, Busson M, Balere M-L, Dormoy A, Bignon J-D, Gagne K, et al. HLA association with hematopoietic stem cell transplantation outcome: the number of mismatches at HLA-A, -B, -C, -DRB1, or -DQB1 is strongly associated with overall survival. Biol Blood Marrow Transplant. 2007;13:965–74. doi: 10.1016/j.bbmt.2007.04.010. - DOI - PubMed
    1. Sauter J, Solloch UV, Giani AS, Hofmann JA, Schmidt AH. Simulation shows that HLA-matched stem cell donors can remain unidentified in donor searches. Sci Rep. 2016;6:21149. doi: 10.1038/srep21149. - DOI - PMC - PubMed
    1. Grumbt B, Eck SH, Hinrichsen T, Hirv K. Diagnostic applications of next generation sequencing in immunogenetics and molecular oncology. Transfus Med Hemotherapy. 2013;40:196–206. doi: 10.1159/000351267. - DOI - PMC - PubMed
    1. Lange V, Böhme I, Hofmann J, Lang K, Sauter J, Schöne B, et al. Cost-efficient high-throughput HLA typing by MiSeq amplicon sequencing. BMC Genomics. 2014;15:63. doi: 10.1186/1471-2164-15-63. - DOI - PMC - PubMed