. 2017 May 4;20(5):675-688.e6.
doi: 10.1016/j.stem.2017.01.001. Epub 2017 Feb 9.

Genome Editing in hPSCs Reveals GATA6 Haploinsufficiency and a Genetic Interaction with GATA4 in Human Pancreatic Development

Affiliations

Genome Editing in hPSCs Reveals GATA6 Haploinsufficiency and a Genetic Interaction with GATA4 in Human Pancreatic Development

Zhong-Dong Shi et al. Cell Stem Cell. .

Abstract

Human disease phenotypes associated with haploinsufficient gene requirements are often not recapitulated well in animal models. Here, we have investigated the association between human GATA6 haploinsufficiency and a wide range of clinical phenotypes that include neonatal and adult-onset diabetes using CRISPR (clustered regularly interspaced short palindromic repeat)/Cas9-mediated genome editing coupled with human pluripotent stem cell (hPSC) directed differentiation. We found that loss of one GATA6 allele specifically affects the differentiation of human pancreatic progenitors from the early PDX1+ stage to the more mature PDX1+NKX6.1+ stage, leading to impaired formation of glucose-responsive β-like cells. In addition to this GATA6 haploinsufficiency, we also identified dosage-sensitive requirements for GATA6 and GATA4 in the formation of both definitive endoderm and pancreatic progenitor cells. Our work expands the application of hPSCs from studying the impact of individual gene loci to investigation of multigenic human traits, and it establishes an approach for identifying genetic modifiers of human disease.

Keywords: CRISPR/Cas9 genome editing; GATA6 and GATA4; definitive endoderm; genetic modifier; haploinsufficiency; human embryonic stem cells; human pluripotent stem cells disease modeling; insulin producing pancreatic beta cells; pancreatic agenesis and neonatal diabetes; pancreatic progenitor.


Figures

Figure 1
Figure 1. GATA6 and GATA4 expression during early pancreatic progenitor differentiation in hPSCs
(A) Schematic of directed endoderm and PDX1+ early pancreatic progenitor differentiation from HUES8 hPSCs using the 1st-generation protocol. The cell types and key markers at each stage are shown. Chemicals and durations for each differentiation stage are indicated. PS: undifferentiated hPSC stage; DE: definitive endoderm stage; PP1: early pancreatic progenitor stage (cells expressing PDX1 but not NKX6.1); Activin A, a TGF-β superfamily ligand; BIO: BIO-acetoxime, a GSK3 inhibitor that activates WNT signaling; FGF10: fibroblast growth factor 10; SANT-1, a Hedgehog pathway antagonist; RA: retinoic acid; LDN: LDN-193189, a BMP type 1 receptor (ALK2/3) inhibitor. The day when differentiation is initiated is designated as day 0 (d0). (B) The mRNA expression patterns of GATA6 and GATA4 during hPSC differentiation to early pancreatic progenitor. The mRNA levels were measured by RT-qPCR (n=4) and normalized to internal control ACTB. Student’s t-test with two-tailed distribution and two-sample equal variance was used for statistics analysis. P values <0.05, 0.01, and 0.001 were indicated with 1, 2, and 3 asterisks, respectively, in all figures. (C) Representative immunostaining of GATA6 or GATA4 with other stage-specific markers including OCT4, SOX17, and PDX1. Scale bar, 100 μm for all images throughout. (D) Representative FACS dot plots of cells stained for CXCR4, SOX17, GATA6 and GATA4 factors at the DE stage. The percentage of each cell population is indicated in the corresponding quadrant for all FACS plots. (E) Representative FACS dot plots for co-expression of GATA6 or GATA4 with PDX1 at the PP1 stage. All data in this figure were generated from HUES8 line using 1st-generation differentiation protocol. See also Method Details.
Figure 2
Figure 2. The role of GATA6 in human definitive endoderm and pancreatic progenitor specification
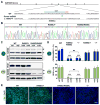
(A) CRISPR gRNA design for generating GATA6 mutants from the HUES8 parental line. Note that the GATA6 gene uses two initiation codons. Shown here is the schematic of the long isoform. The short isoform starts from amino acid 147 of the long isoform. To control for potential off-target effects associated with CRISPR/Cas, two CRISPRs were used to target different sequences corresponding to the conserved C-terminal zinc finger domain critical for the DNA binding function of GATA6. The target sequences of the two CRISPR gRNAs (GATA6-Cr1 and Cr2) and the corresponding protospacer adjacent motif (PAM) sequences are indicated in green and red, respectively. The corresponding sequences of two representative GATA6 homozygous mutant lines (m37 and m45) are shown underneath the WT reference sequence. (B) Western blotting for GATA6 protein expression at the DE stage with the corresponding CRISPR gRNA and genotype indicated above each hPSC clonal line. ACTB (β-Actin) was used as a loading control. Solid arrowheads indicate the WT proteins of GATA6; unfilled arrowheads indicate the truncated mutant proteins. Sizes of molecular weight marker shown on the right side. G6: GATA6. (C) Representative immunostaining images of SOX17 and FOXA2 at the DE stage (d5). (D) Representative FACS dot plots of cells co-stained for SOX17 and CXCR4 (d5). (E) FACS quantification of DE differentiation efficiency based on the percentages of CXCR4+SOX17+ cells at the DE stage. Each bar indicates the mean with SEM for a clonal line. Data was generated from three independent experiments (n=6 for WT and G6−/+ and n=9 for G6−/−). (F) Representative immunostaining images for pancreatic progenitor marker PDX1 at the PP1 stage. (G) Representative FACS dot plots for PP1 marker PDX1. (H) FACS quantification of differentiation efficiency based on the percentage of PDX1+ PP1 cells (n=6 for WT and G6−/+ and n=9 for G6−/−). t-test with two-tailed distribution and two-sample equal variance was used for statistics analysis in panels E and H to compare with WT controls. All data in this figure were generated from HUES8 lines using the 1st-generation differentiation protocol. See also Figure S1 and Tables S1 and S2.
Figure 3
Figure 3. Characterization of the patient-specific GATA6R456C mutation
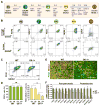
(A) Schematic of CRISPR targeting for generating hPSC lines carrying heterozygous and homozygous GATA6R456C mutations. The GATA6R456C missense disease mutation (c.1366C>T, shown in red) was introduced through homology direct repair using a ssDNA donor template (110-nt long). To minimize potential secondary cutting by Cas9 after homologous recombination, a silent mutation (G>A, shown in orange) was introduced in the PAM sequence. The blue arrow indicates the predicted Cas9 cleavage site. (B) Representative sequencing graphs of generated heterozygous and homozygous mutants carrying the disease mutation. The red * indicates the C>T switch; the orange # indicates the G>A change. (C) Western blotting showed that GATA6R456C mutant protein was still expressed and detected by the same GATA6 antibody used elsewhere. The cells were differentiated to the DE stage. Western blotting was also used to detect PDX1 and GATA6 expression at the PP1 stage. ACTB was used as a loading control. (D) FACS quantification of percentages of DE and PP1 cells at the corresponding stages (n=6). For direct comparison and easy visualization, we also included data shown in Figures 2E and 2H for WT, −/+ and −/− genotypes (obtained from the same differentiation experiments). One-way ANOVA was used followed by multiple comparisons with Bonferroni correction for statistics test. (E) Representative immunostaining images for PDX1 at the PP1 stage. All data in this figure were generated from HUES8 lines using the 1st-generation differentiation protocol. See also Tables S1 and S2 and Figure S1.
Figure 4
Figure 4. GATA6 haploinsufficiency in the specification of PDX1+NKX6.1+ pancreatic progenitor cells
(A) Schematic of modified 2nd-generation differentiation protocol toward β-like stage from hPSCs. The key lineage markers at each stage are shown. Chemicals and durations for each differentiation stage are indicated. hPS: undifferentiated hPSC stage; DE: definitive endoderm stage; PP1: early pancreatic progenitor stage; PP2: pancreatic endoderm progenitor stage; β: β-like stage. From PP2 to β-like stage, the cells were cultured at air-liquid interface. See also Table S3 for detailed differentiation medium recipes. (B) Representative FACS dot plots of GATA6 co-staining with stage-specific lineage markers or GATA4 for each stage. (C) Representative FACS dot plots for PDX1 and NKX6.1 co-staining at the PP2 stage. (D) Quantification of PDX1+ cells and PDX1+NKX6.1+ cells at the PP2 stage based on FACS analysis from 3 independent experiments. The statistics was done by comparing the mutant group with the WT group. The hPSC lines with the same genotypes were treated as one group (n=6). (E) Representative images for PDX1 and NKX6.1 expression at the PP2 stage. (F) RT-qPCR analysis of pancreatic progenitor marker expression at the PP2 stage (n=4). Genes labeled in red were not expressed in the PP1 cells. t-test with two-tailed distribution and two-sample equal variance was used to determine the significance in this figure panels D and F to compare with WT group. All data in this figure were generated from H1 lines using the 2nd-generation differentiation protocol (Table S3). See also Figures S2 and S3.
Figure 5
Figure 5. GATA6 haploinsufficiency in the formation of functional β-like cells
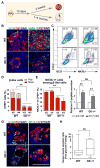
(A) Schematic of hPSC-derived PP2 cell differentiation to β-like cells in vitro and in vivo (after transplantation). (B) Representative images for CPEP co-staining with glucagon (GCG) or NKX6.1 at the β-like stage in vitro. (C) Representative FACS dot plots for CPEP co-staining with GCG or NKX6.1 at the β-like stage. (D) Quantification of FACS analysis for CPEP+ and GCG+ or - cells from 3 independent experiments. (E) Quantification of FACS analysis for percentage of NKX6.1+ cells within CPEP+ cells from 3 independent experiments. (F) In vitro GSIS at the β-like stage (n=6). See Figure S4C for associated data. (G) Representative images for CPEP co-staining with GCG or NKX6.1 of the grafts removed from mouse kidney capsules 4 months after transplantation. (H) Mouse GSIS experiment at one month after transplantation. Box and whiskers plot for human insulin secretion ratio (post glucose/fasting) in mouse sera. The analysis was done using unpaired two-tailed t test with Welch’s correction (unequal variance) (n=8–10). See raw data for each mouse in Figure S4E. All data in this figure were generated from H1 lines using the 2nd-generation differentiation protocol. See also Table S3 and Figures S4.
Figure 6
Figure 6. GATA6 and GATA4 control pancreatic specification in a dosage-sensitive manner
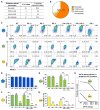
(A) Table summarization of diabetes phenotypes in reported GATA6 heterozygous humans. See Table S4 and Figure S5 for detailed information. (B) Pie chart summary of wide-range of diabetes phenotypes in reported GATA6 heterozygous humans with clear documentation regarding phenotype of the pancreas. (C) Representative FACS dot plots for each genotype at DE, PP1 and PP2 stages. (D) Quantification of DE differentiation by FACS. Mean values from multiple clonal lines with the same genotypes from multiple independent experiments were used for graph plotting and statistics analysis (n=6–10). All clonal lines were generated in the HUES8 hPSC background, and one-way ANOVA was used followed by multiple comparisons with Bonferroni correction for all the statistics tests in this figure (panels D to G). (E) FACS quantification of percentages of PDX1+ cells at PP1 stage. Mean values from multiple clonal lines with the same genotypes from multiple experiments were used for graph plotting and statistics analysis (n=6–10). (F) Quantification of PDX1+ cells at PP2 stage (n=6–10). (G) Quantification of PDX1+NKX6.1+ cells at PP2 stage (n=6–10). (H) Model showing GATA gene dosage affects early and late pancreatic progenitor formation. All differentiation data in this figure were generated from HUES8 lines using the 2nd-generation differentiation protocol. See also Figures S1, S5, S6 and Tables S2 and S4.

Comment in

Similar articles

Cited by

References

    1. Ang YS, Rivas RN, Ribeiro AJ, Srivas R, Rivera J, Stone NR, Pratt K, Mohamed TM, Fu JD, Spencer CI, et al. Disease Model of GATA4 Mutation Reveals Transcription Factor Cooperativity in Human Cardiogenesis. Cell. 2016;167:1734–1749. - PMC - PubMed
    1. Bates DL, Chen Y, Kim G, Guo L, Chen L. Crystal structures of multiple GATA zinc fingers bound to DNA reveal new insights into DNA recognition and self-association by GATA. J Mol Biol. 2008;381:1292–1306. - PMC - PubMed
    1. Bonnefond A, Sand O, Guerin B, Durand E, De Graeve F, Huyvaert M, Rachdi L, Kerr-Conte J, Pattou F, Vaxillaire M, et al. GATA6 inactivating mutations are associated with heart defects and, inconsistently, with pancreatic agenesis and diabetes. Diabetologia. 2012;55:2845–2847. - PubMed
    1. Bruneau BG. The developmental genetics of congenital heart disease. Nature. 2008;451:943–948. - PubMed
    1. Bui PH, Dorrani N, Wong D, Perens G, Dipple KM, Quintero-Rivera F. First report of a de novo 18q11.2 microdeletion including GATA6 associated with complex congenital heart disease and renal abnormalities. Am J Med Genet A. 2013;161A:1773–1778. - PubMed