Review
. 2017 Mar;32(3):211-226.
doi: 10.1016/j.tree.2016.12.010. Epub 2017 Feb 11.

Biodiversity and Topographic Complexity: Modern and Geohistorical Perspectives

Affiliations
Review

Biodiversity and Topographic Complexity: Modern and Geohistorical Perspectives

Catherine Badgley et al. Trends Ecol Evol. 2017 Mar.

Abstract

Topographically complex regions on land and in the oceans feature hotspots of biodiversity that reflect geological influences on ecological and evolutionary processes. Over geologic time, topographic diversity gradients wax and wane over millions of years, tracking tectonic or climatic history. Topographic diversity gradients from the present day and the past can result from the generation of species by vicariance or from the accumulation of species from dispersal into a region with strong environmental gradients. Biological and geological approaches must be integrated to test alternative models of diversification along topographic gradients. Reciprocal illumination among phylogenetic, phylogeographic, ecological, paleontological, tectonic, and climatic perspectives is an emerging frontier of biogeographic research.


Figures

Figure 1
Figure 1. Geologic History of Western North America
Three representative time slices are based on information from [46,47,74]. The tectonically active region (gray shading) consists of several tectonic provinces that have changed in size, elevation, and relief over the past 30 myr. Black arrows refer to increase or decrease in mean elevation; white arrows refer to increase or decrease in relief. The tectonically passive region (yellow shading) has been stable over this time, receiving aeolian and fluvial sediments from the active region. (A) At 30 Ma, the active region was narrower than today. The Nevadaplano was breaking up into the Basin and Range. (B) At 15 Ma, in the Middle Miocene, the Basin and Range province was expanding rapidly and had greater relief than at any time since; volcanic activity in the Pacific Northwest led to growth of the Cascade range and the Yellowstone hotspot began to migrate eastward. (C) The present-day landscape shows a wider active region from expansion of the Basin and Range and more subdued tectonic activity.
Figure 2
Figure 2. Present-Day Diversity of Rodents of North America at Midlatitudes
Diversity is based on species ranges in NatureServe [75], compiled at a resolution of 0.1°. (A) Species density of rodents. (B) Distribution of overlapping range boundaries for two or more species. Both species density and spatial turnover are greater in the tectonically active region than in the passive region today.
Figure 3
Figure 3. Climatic and Biotic Changes in North America over the Past 35 myr
The global temperature trend is from the benthic foraminiferal oxygen-isotope record (data from [76]). Notable warming during the Middle Miocene was followed by long-term cooling and Quaternary glacial cycles. Global climate influenced vegetation (inferred from the phytolith record) differently in the active (montane west) versus the passive (Great Plains) regions of North America (data from [–80]). Although both regions exhibited a Neogene increase in grasses, the decline of forest ecosystems occurred earlier in the passive region. Between 34 and 28 Ma, 22 and 18 Ma, and 2 and 1 Ma, rodent diversity was higher in the passive than in the active region, whereas from 17 to 13 Ma, 7 to 5 Ma, and 5 to 3 Ma, diversity was much higher in the active region. The contrast in diversity between active and passive regions was greatest during the Miocene Climatic Optimum (17–14 Ma). Much of the diversity change among rodents coincided with changes in faunal composition [48,49]. Corresponding changes in dietary ecology are demonstrated by the increase in high-crowned species (hypsodont and hypselodont) toward the present day (data from J.X.S.). This increase preceded the expansion of grasslands in both regions, suggesting that adaptation to more abrasive diets was initially driven by volcanic ash in soils or grit on plants rather than increased consumption of grass.
Figure I
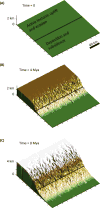
Figure I. Landscape-Evolution Model [85] for an 8-Million Year Simulation
In this model, half of the domain is underdoing active tectonic uplift (at 0.5 mm/year), while the other half is subsiding at a rate significantly lower than the uplift. Output is shown for (A) the initial model setup, (B) at 4 million years, and (C) at 8 million years of simulated time. As part of the landscape becomes uplifted, climate-driven processes of erosion, sediment transport, and deposition are modeled with established geomorphic principles. Bedrock erosion dominates in the tectonically active region as the landscape steepens from sustained uplift, leading to development of complex topography. Sediment deposition dominates in the tectonically passive region, leading to a smoother landscape.
Figure I
Figure I. Three Plausible Models (A–C) for Generating a Topographic Diversity Gradient
For each model, simulated phylogenies for the tectonically active (blue) and passive (red) regions are shown in the upper panel, with corresponding lineage-through-time (LTT) plots in the lower panel. The timing of speciation (B) and immigration (C) rate shifts is indicated by gray bars. See box text for descriptions of each model and tests for evaluating model fit.
Figure I
Figure I. Approaches for Inferring Species Diets
(A) Illustration of tooth-crown categories from left (low crowned) to right (high crowned): brachydont, mesodont, hypsodont, and hypselodont (ever growing). (B) Dental microwear texture analysis of a gopher (Thomomys bottae) incisor with false-colored relief on the enamel surface to illustrate texture roughness and orientation. (C) 3D image of rodent tooth morphology captured by high-resolution, X-ray computed microtopography and quantified based on surface curvature. (D) Carbon-isotopic composition and inferred percent C4 vegetation in the diets of modern rodents from Nebraska (filled symbols, left panel) and fossil rodents from the Big Springs Gravel locality at approximately 2.4 Ma (open symbols, right panel). Different symbols refer to rodent families: Cricetidae (diamonds), Heteromyidae (triangles), Sciuridae (inverted triangles), and Geomyidae (circles). Rodent isotopic values have been adjusted by the appropriate enrichment factor and by changes in the isotopic composition of atmospheric CO2 to be comparable to mean C3 (short dash) and C4 (long dash) vegetation values.

Similar articles

Cited by

References

    1. Kiessling W, et al. Reefs as cradles of evolution and sources of biodiversity in the Phanerozoic. Science. 2010;327:196–198. - PubMed
    1. Mittelbach GG, et al. Evolution and the latitudinal diversity gradient: speciation, extinction and biogeography. Ecol Lett. 2007;10:315–331. - PubMed
    1. Jablonski D, et al. New perspectives from a synthesis of paleobiology and biogeography. Am Nat. 2017;189:1–12. - PubMed
    1. Badgley C. Tectonics, topography, and mammalian diversity. Ecography. 2010;33:220–231.
    1. Bellwood DR, Meyer CP. Searching for heat in a marine biodiversity hotspot. J Biogeogr. 2009;36:569–576.

LinkOut - more resources