. 2017 Mar 14;8(3):589-604.
doi: 10.1016/j.stemcr.2016.12.026. Epub 2017 Feb 9.

GATA6 Plays an Important Role in the Induction of Human Definitive Endoderm, Development of the Pancreas, and Functionality of Pancreatic β Cells

Affiliations

GATA6 Plays an Important Role in the Induction of Human Definitive Endoderm, Development of the Pancreas, and Functionality of Pancreatic β Cells

Amita Tiyaboonchai et al. Stem Cell Reports. .

Abstract

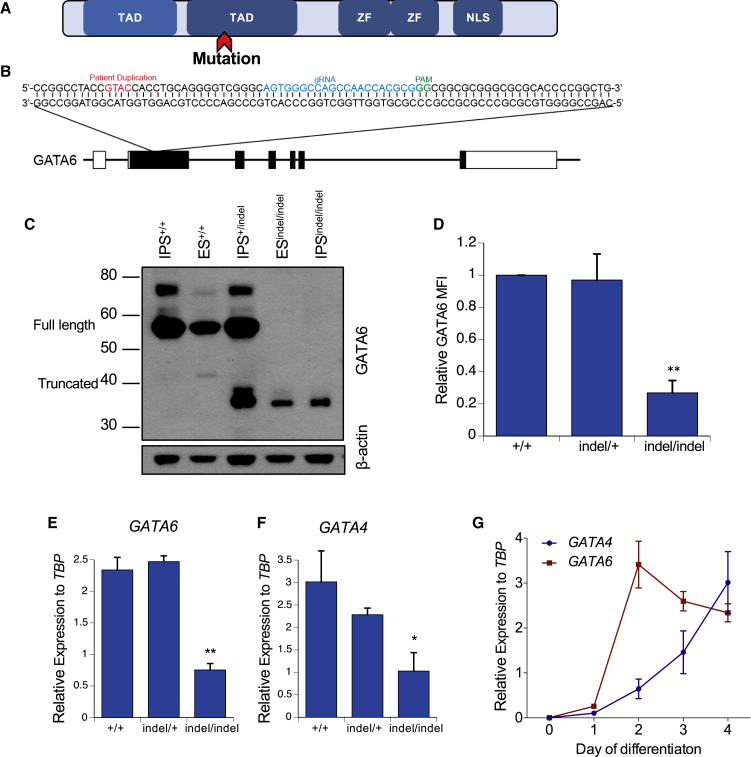
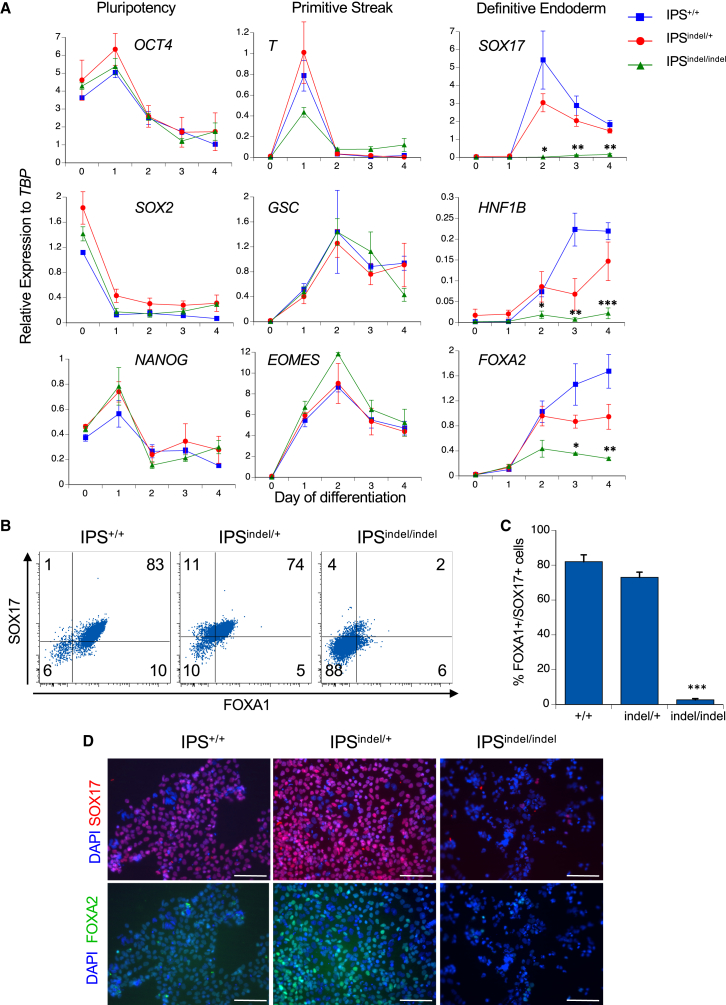
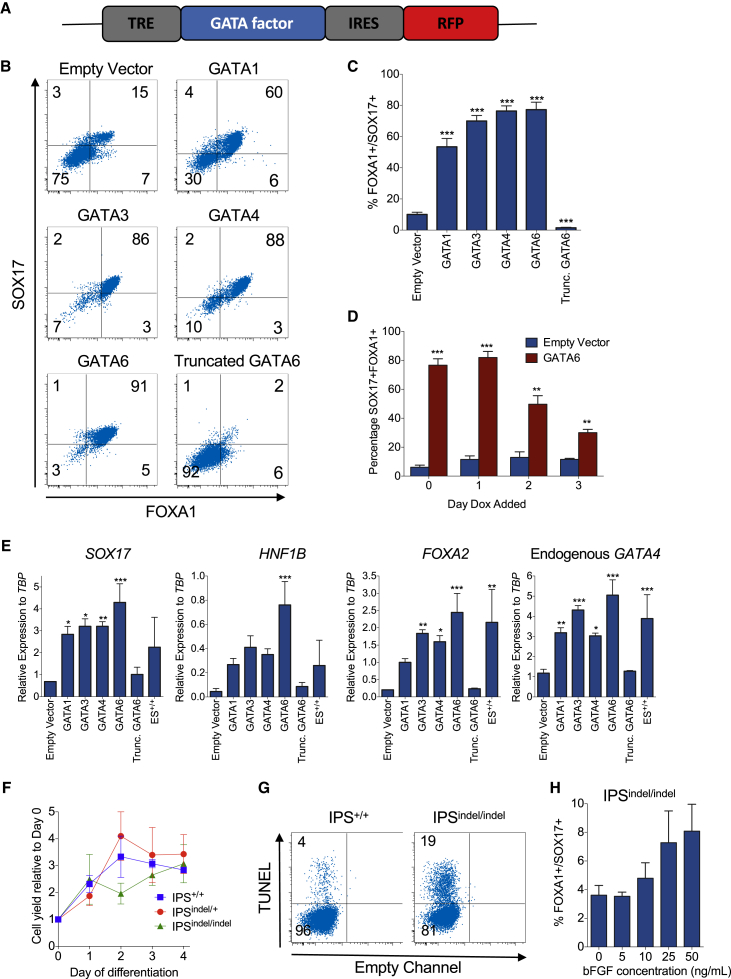
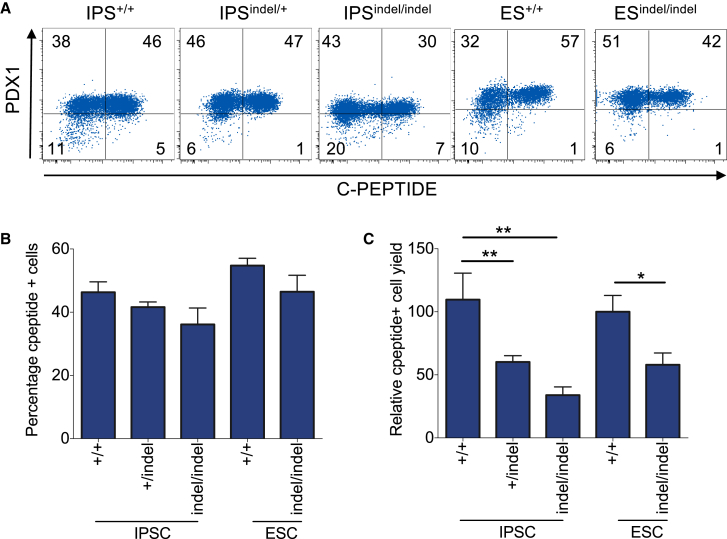
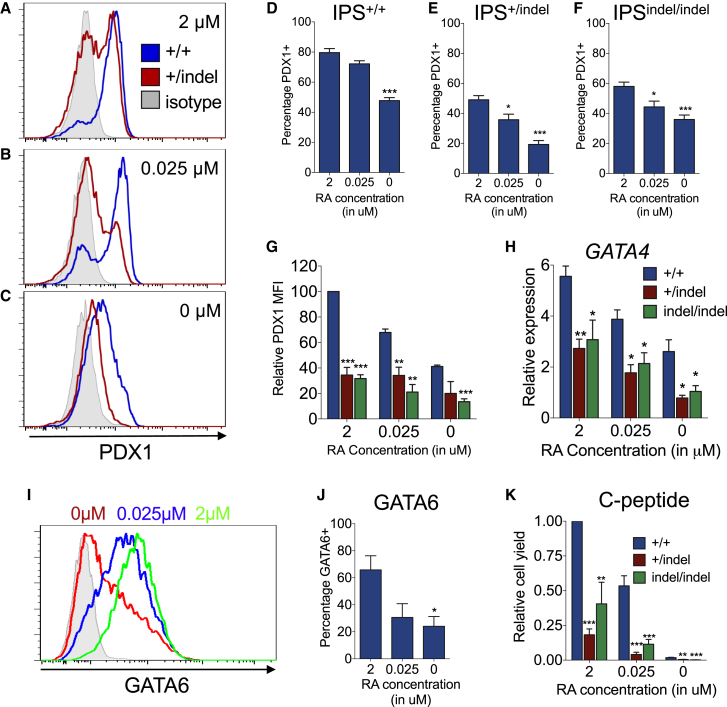
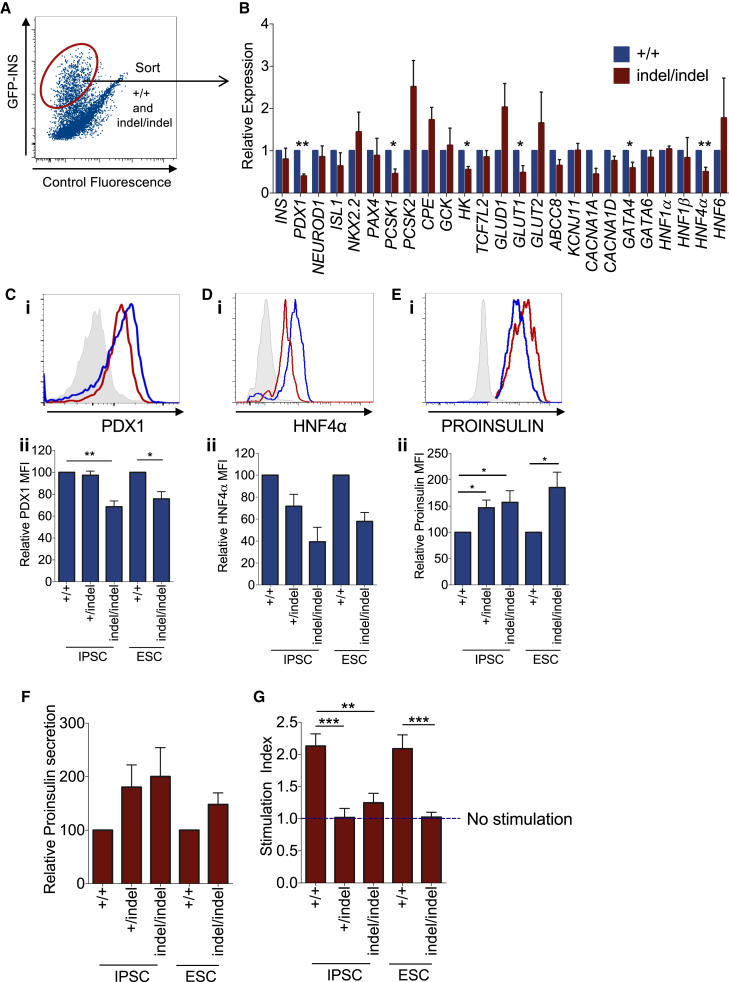
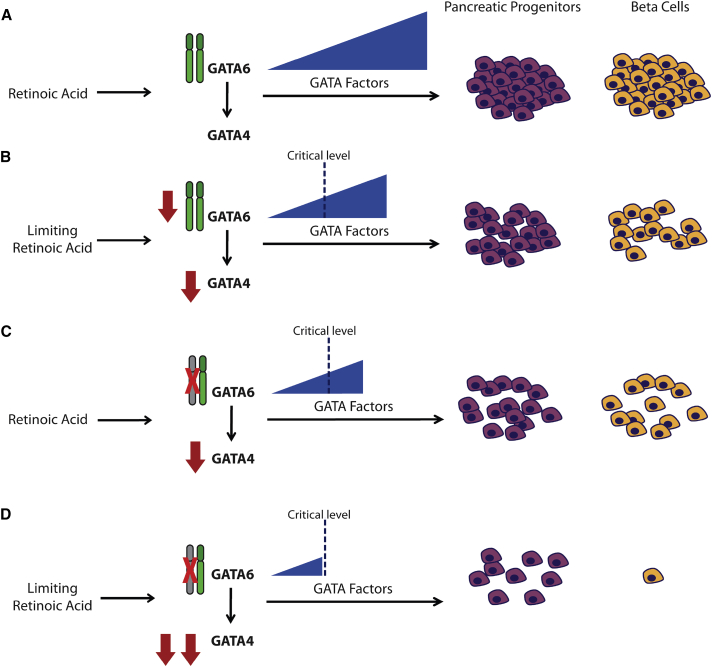
Induced pluripotent stem cells were created from a pancreas agenesis patient with a mutation in GATA6. Using genome-editing technology, additional stem cell lines with mutations in both GATA6 alleles were generated and demonstrated a severe block in definitive endoderm induction, which could be rescued by re-expression of several different GATA family members. Using the endodermal progenitor stem cell culture system to bypass the developmental block at the endoderm stage, cell lines with mutations in one or both GATA6 alleles could be differentiated into β-like cells but with reduced efficiency. Use of suboptimal doses of retinoic acid during pancreas specification revealed a more severe phenotype, more closely mimicking the patient's disease. GATA6 mutant β-like cells fail to secrete insulin upon glucose stimulation and demonstrate defective insulin processing. These data show that GATA6 plays a critical role in endoderm and pancreas specification and β-like cell functionality in humans.

Keywords: GATA6; definitive endoderm; pancreatic agenesis; retinoic acid; stem cells; β cell.


Figures

Figure 1
Figure 1
Generation of PSC Lines with GATA6 Mutations (A) Schematic of GATA6 protein with site of patient mutation (red arrow). (B) Schematic of GATA6 gene with location of patient mutation (red) and site of gRNA (blue) with the PAM sequence (green) indicated. (C) Western blot of GATA6 protein from PSC lines differentiated toward definitive endoderm for 4 days. (D) Mean fluorescence intensity (MFI) of samples examined in (C) by intracellular flow cytometry (n = 5 per cell line). (E) GATA6 expression of samples examined in (C) by qRT-PCR analysis (n = 3 per cell line). (F) GATA4 expression of samples examined in (C) by qRT-PCR analysis (n = 3 per cell line). (G) Time-course analysis of GATA4 and GATA6 expression during definitive endoderm differentiation of control cells by qRT-PCR (n = 3). For all statistical analysis, p < 0.05, ∗∗p < 0.01.
Figure 2
Figure 2
GATA6 Is Required for Definitive Endoderm Differentiation of PSC Lines Pluripotent stem cell lines described in Figure 1B were differentiated into definitive endoderm. (A) Time-course analysis of pluripotency (OCT4, SOX2, and NANOG), primitive streak (T, GSC, EOMES) and definitive endoderm (SOX17, HNF1B, and FOXA2) markers by qRT-PCR (n = 3 per time point per cell line). (B) Analysis of the definitive endoderm markers FOXA1 versus SOX17 at day 4 of differentiation by intracellular flow cytometry. (C) Quantitation of the percentage of FOXA1+SOX17+ cells in (B) (n = 5 per cell line). (D) Immunofluorescence analysis of SOX17 and FOXA2 at day 4 of differentiation. Scale bar represents 100 μm. For all statistical analysis, p < 0.05, ∗∗p < 0.01, ∗∗∗p < 0.001.
Figure 3
Figure 3
Rescue of Definitive Endoderm Differentiation (A) A schematic of the doxycycline-inducible lentivirus that was used to infect ESindel/indel cells. (B) ESindel/indel cells were transduced with lentivirus harboring GATA1, GATA3, GATA4, GATA6, truncated-GATA6 transgenes, or an empty vector and differentiated into definitive endoderm. Doxycycline was added on day 1 of the differentiation to induce gene expression. Representative intracellular flow cytometric analysis of FOXA1 versus SOX17 expression at day 5 of differentiation. Data shown are gated on cells expressing RFP. (C) Quantitation of the percentage of FOXA1+SOX17+ cells in (B). (n = 4 per lentivirus). (D) Quantitation of the percentage of FOXA1+SOX17+ cells in cells transduced with GATA6 or an empty vector control lentivirus with doxycycline addition beginning at various days during the differentiation. Data shown are gated on cells expressing RFP at day 5 of differentiation (n = 3 per time point per cell line). (E) Cells treated and differentiated as described in (B) were cell-sorted for RFP expression at day 5 of differentiation and subjected to qRT-PCR analysis for SOX17, FOXA2, HNF1B, and endogenous GATA4 expression levels (n = 3 per lentivirus). (F) A time course of cell yield during definitive endoderm differentiation in the IPS cell allelic series (n = 3 per time point per cell line). (G) Analysis of TUNEL staining by intracellular flow cytometry at day 2 of definitive endoderm differentiation. (H) Quantitation of the percentage of FOXA1+SOX17+ cells for IPSindel/indel cells treated with different concentrations of bFGF from day 1 to 2 of definitive endoderm differentiation (n = 4 per condition). For all statistical analysis, p < 0.05, ∗∗p < 0.01, ∗∗∗p < 0.001.
Figure 4
Figure 4
GATA6 Is Dispensable for Differentiation of Pancreatic β-like Cells from PSCs EP cell lines were generated from two control, one heterozygous, and two compound heterozygous PSC lines and differentiated into β-like cells. (A) Representative intracellular flow cytometric analysis of C-peptide versus PDX1 at day 15 of differentiation. (B) Quantification of the percentage of C-peptide+ cells from (A). Results are averaged from at least eight independent differentiations per cell line. (C) Absolute yield of C-peptide+ cells from (A). Results are an average from at least eight independent differentiations per cell line. IPSC, induced pluripotent stem cells; ESC, embryonic stem cells. For all statistical analysis, p < 0.05, ∗∗p < 0.01.
Figure 5
Figure 5
Retinoic Acid Acts as a Modulator of the GATA6 Phenotype (A–E) Representative flow cytometry analysis of PDX1 on day 8 in IPS+/+ and IPS+/indel pancreatic progenitors differentiated in (A) 2 μM, (B) 0.025 μM, or (C) 0 μM retinoic acid. Quantification of the percentage of PDX1+ cells on day 8 differentiated in 2, 0.025, or 0 μM retinoic acid for (D) IPS+/+, (E) IPS+/indel, and (F) IPSindel/indel cells (n = 5 for each cell line). (G) Quantification of the mean florescence intensity (MFI) of PDX1 relative to the isotype control of each cell line with 2, 0.025, or 0 μM retinoic acid. (H) GATA4 qRT-PCR of samples from (D, E, and F) (n = 3 per line per condition). (I) Representative flow cytometry analysis of GATA6 in IPS+/+ pancreatic progenitors. (J) Quantitation of percentage GATA6+ cells from (I) (n = 3 per condition). (K) Quantification of the percentage of C-peptide+ cells on day 14 of differentiation in 2, 0.025, or 0 μM RA for IPS+/+, IPS+/indel and IPSindel/indel cells. Cell yields are normalized to IPS+/+ at 2 μM retinoic acid (n = 4 per cell line per condition). For all statistical analysis, p < 0.05, ∗∗p < 0.01, ∗∗∗p < 0.001.
Figure 6
Figure 6
Gene Expression and Functional Analysis of C-Peptide+ β-Like Cells (A) The Mel1-INS-GFP cells contain a GFP reporter in the insulin locus. β-like cells from ES+/+ and ESindel/indel cells were purified by cell sorting for GFP+ cells and analyzed for gene expression (n = 4). (B) qRT-PCR analysis for expression of genes important in β cell development, identity, and processing. Expression levels are normalized to ES+/+ cells. (C) (i) Representative intracellular flow cytometric analysis of PDX1 in ES+/+ and ESindel/indel cells. (ii) Quantification of the mean fluorescence intensity of PDX1 standardized to the respective control of each genetic background. Experiments were repeated at least three times per cell line. (D) (i) Representative intracellular flow cytometric analysis of HNF4α in ES+/+ and ESindel/indel cells. (ii) Quantification of the mean fluorescence intensity of HNF4α relative to the respective isotype control of each genetic background. Experiments were repeated at least three times per cell line. (E) (i) Representative intracellular flow cytometric analysis of proinsulin in ES+/+ and ESindel/indel cells. (ii) Quantification of the mean fluorescence intensity of proinsulin in C-peptide-positive cells relative to C-peptide-negative cells. Experiments were repeated at least five times per cell line. (F) Quantification of the ratio of proinsulin to insulin secreted per C-peptide positive cell. Secretion is normalized to the respective control (+/+) of each genetic background. Experiments were repeated at least five times per cell line. (G) The stimulation index of C-peptide secretion on day 14 of differentiation in basal glucose (1 mM) and glucose (20 mM) conditions. The stimulation index is the ratio of C-peptide secreted during glucose stimulation to C-peptide secreted under basal glucose conditions. Stimulation index was calculated from a minimum of six differentiations (and at least ten replicates in total) for each cell line. IPSC, induced pluripotent stem cells; ESC, embryonic stem cell. For all statistical analysis, p < 0.05, ∗∗p < 0.01, ∗∗∗p < 0.001.
Figure 7
Figure 7
Model for the Incomplete Penetrance of GATA6 Heterozygous Mutations (A) Under normal conditions, endogenous retinoic acid can activate the expression of both GATA6 and GATA4 leading to the development of pancreatic progenitors and β cells. (B) Decreased endogenous retinoic acid signaling may lead to decreased GATA4 and GATA6 expression. Despite this decrease, the combined level of GATA4 and GATA6 remains above a critical threshold and is sufficient for pancreatic progenitor specification and β cell development. (C) The loss of one allele of GATA6 in individuals with higher endogenous retinoic acid signaling. A loss of one allele of GATA6 may cause some decrease in the expression level of GATA4 but the level of combined GATA factors still remain above the critical level for pancreatic progenitor and β cell formation. (D) A combination of lower endogenous retinoic acid signaling and a loss of one allele of GATA6 will lead to even lower levels of GATA4 expression. The levels of combined GATA factors may be insufficient to meet the minimum critical level necessary for the formation of pancreatic progenitors leading to pancreatic agenesis.

Comment in

Similar articles

Cited by

References

    1. Arceci R.J., King A.A., Simon M.C., Orkin S.H., Wilson D.B. Mouse GATA-4: a retinoic acid-inducible GATA-binding transcription factor expressed in endodermally derived tissues and heart. Mol. Cell. Biol. 1993;13:2235–2246. - PMC - PubMed
    1. Bonnefond A., Sand O., Guerin B., Durand E., De Graeve F., Huyvaert M., Rachdi L., Kerr-Conte J., Pattou F., Vaxillaire M. GATA6 inactivating mutations are associated with heart defects and, inconsistently, with pancreatic agenesis and diabetes. Diabetologia. 2012;55:2845–2847. - PubMed
    1. Brewer A., Gove C., Davies A., McNulty C., Barrow D., Koutsourakis M., Farzaneh F., Pizzey J., Bomford A., Patient R. The human and mouse GATA-6 genes utilize two promoters and two initiation codons. J. Biol. Chem. 1999;274:38004–38016. - PubMed
    1. Carrasco M., Delgado I., Soria B., Martín F., Rojas A. GATA4 and GATA6 control mouse pancreas organogenesis. J. Clin. Invest. 2012;122:3504–3515. - PMC - PubMed
    1. Chao C.S., McKnight K.D., Cox K.L., Chang A.L., Kim S.K., Feldman B.J. Novel GATA6 mutations in patients with pancreatic agenesis and congenital heart malformations. PLoS One. 2015;10:e0118449. - PMC - PubMed

Publication types

MeSH terms