. 2017 Apr 14;292(15):6095-6107.
doi: 10.1074/jbc.M116.758219. Epub 2017 Feb 14.

Conformational changes in the activation loop of mitochondrial glutaminase C: A direct fluorescence readout that distinguishes the binding of allosteric inhibitors from activators

Affiliations

Conformational changes in the activation loop of mitochondrial glutaminase C: A direct fluorescence readout that distinguishes the binding of allosteric inhibitors from activators

Clint A Stalnecker et al. J Biol Chem. .

Abstract

The first step in glutamine catabolism is catalysis by the mitochondrial enzyme glutaminase, with a specific isoform, glutaminase C (GAC), being highly expressed in cancer cells. GAC activation requires the formation of homotetramers, promoted by anionic allosteric activators such as inorganic phosphate. This leads to the proper orientation of a flexible loop proximal to the dimer-dimer interface that is essential for catalysis (i.e. the "activation loop"). A major class of allosteric inhibitors of GAC, with the prototype being bis-2-(5-phenylacetamido-1,2,4-thiadiazol-2-yl)ethyl sulfide (BPTES) and the related molecule CB-839, binds to the activation loop and induces the formation of an inactive tetramer (two inhibitors bound per active tetramer). Here we describe a direct readout for monitoring the dynamics of the activation loop of GAC in response to these allosteric inhibitors, as well as allosteric activators, through the substitution of phenylalanine at position 327 with tryptophan (F327W). The tryptophan fluorescence of the GAC(F327W) mutant undergoes a marked quenching upon the binding of BPTES or CB-839, yielding titration profiles that make it possible to measure the binding affinities of these inhibitors for the enzyme. Allosteric activators like phosphate induce the opposite effect (i.e. fluorescence enhancement). These results describe direct readouts for the binding of the BPTES class of allosteric inhibitors as well as for inorganic phosphate and related activators of GAC, which should facilitate screening for additional modulators of this important metabolic enzyme.

Keywords: fluorescence; glutaminase; glutamine; metabolism; tryptophan.


Conflict of interest statement

The authors declare that they have no conflicts of interest with the contents of this article

Figures
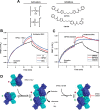
Figure 1.
Figure 1.
Both allosteric activators and BPTES class inhibitors induce GAC tetramer formation. A, the allosteric anionic activators inorganic phosphate (HPO42−) and sulfate (SO42−) and inhibitors BPTES and CB-839. B and C, FRET assays where the FRET signal (1-F/Fo) for 25 nm 488-labeled GAC fluorescence (i.e. FRET donor) is increased by the addition of 75 nm QSY9-GAC (i.e. FRET acceptor), representing the formation of GAC tetramers. Addition of 100 mm inorganic phosphate (HPO42−) (red) or sulfate (SO42−) (blue) (B) or 500 nm BPTES or CB-839 (C) rapidly increases the FRET signal, indicating the formation of GAC tetramers. The increase in FRET is not readily reversible by addition of a 10-fold excess of unlabeled GAC subunits compared with DMSO control (black), reflecting the formation of stable drug-bound tetramers. In contrast, tetramers bound to anionic activators are readily reversible. The results shown are representative of three experiments. D, schematic illustrating the transition from a GAC dimer to a tetramer, where the tetramer species is depicted to give rise to the FRET signal and as being the active species. 488-labeled (green) GAC is the FRET donor, and QSY9-labeled (purple) GAC is the FRET acceptor. The allosteric activators inorganic phosphate (HPO42−) and sulfate (SO42−) are depicted to promote the dimer-to-tetramer transition to emphasize their ability to activate GAC, whereas the inhibitors BPTES and CB-839 bind to the FRET pairs at the dimer-dimer interface, forming a stable BPTES or CB-839-bound inactive GAC tetramer (BPTES is shown as green spheres).
Figure 2.
Figure 2.
Inhibition of phosphate-stimulated GAC activity by CB-839 and BPTES. A, real-time NADH assays of GAC activity, where the increased NADH fluorescence (in arbitrary units (AU)) results from the coupled reaction where GAC catalyzes glutamate production, and GDH converts glutamate to α-ketoglutarate and NAD+ to NADH. The basal activity of 10 nm GAC was first measured upon addition of 20 mm glutamine, followed by treatment with 1 μm BPTES (red), CB-839 (blue), or the vehicle DMSO (black) and, finally, addition of 100 mm HPO42− at the indicated times. B, relative rate analysis was performed on the inhibition of phosphate-stimulated GAC activity by BPTES and CB-839 from A and normalized to the DMSO control. Error bars represent the standard deviation of three independent experiments.
Figure 3.
Figure 3.
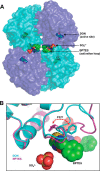
Comparison of BPTES-bound and unbound GAC structures. A, surface representation of the crystal structure of the GAC tetramer bound with ligands DON (PDB code 4O7D), BPTES, and sulfate (SO42−) (aligned from PDB code 3VOZ), where BPTES and sulfate bind proximal to the activation loop and DON binds within the active site. B, magnified view of the region of the DON-bound (cyan) and BPTES/SO42−-bound (magenta) GAC structures depicting the reorientation of the activation loop. The ∼180° rotation of the Phe-327 residue with and without bound BPTES is highlighted (red dashed line).
Figure 4.
Figure 4.
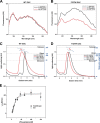
F327W detects BPTES binding while retaining WT properties. A and B, tryptophan fluorescence spectra (in arbitrary units (AU)) of the GAC(F327W) mutant (A) and WT GAC (B) before (black) and after (red) addition of 1 μm BPTES. Addition of BPTES results in no change in the tryptophan fluorescence of WT GAC (B) but significant quenching of the tryptophan emission of the GAC(F327W) mutant (A). The results shown are representative of three experiments. C and D, SEC-MALS elution profiles (in arbitrary units (AU)) (solid lines) and molecular weight distribution (broken lines) of 5 mg/ml samples of WT GAC (C) and GAC(F327W) (D) before (black, dashed blue) and after (red, dotted blue) preincubation with 50 μm BPTES, illustrating a significant shift from a heterogeneous population of GAC dimers and tetramers to a more homogenous population of tetramers following preincubation with BPTES. E, the GAC(F327W) mutant (closed circles) retains its catalytic properties compared with WT GAC (open circles), with an observed KM of 15.0 ± 1.7 mmol/liter and a Vmax value of 435 ± 19 μmol/min versus a KM of 16.4 ± 0.4 mmol/liter and a Vmax value of 453 ± 8 μmol/min for WT GAC. Points represent the mean and error bars the standard deviation of three independent experiments.
Figure 5.
Figure 5.
The Phe-327 peptide backbone interacts with the thiadiazole ring of BPTES-class inhibitors. A and B, close-up of the binding interactions of BPTES in two different orientations from two separate published structures (A, PDB code 3UO9; and B, PDB code 4JKT) with the native residues Leu-326 and Phe-327 (20, 21). Interactions of the peptide backbone of these residues with the bisthiadiazole ring of BPTES are highlighted with dashed lines.
Figure 6.
Figure 6.
Changes in F327W fluorescence provide a direct binding assay for BPTES-like molecules. A and B, addition of increasing concentrations of BPTES (A) and CB-839 (B) quenches the tryptophan fluorescence of 100 nm GAC(F327W). C, fluorescence quenching of the GAC(F327W) mutant by BPTES (black) and CB-839 (red) quantified and fit to a bimolecular interaction equation, giving KD values of 70 ± 5 nm and 34 ± 5 nm for BPTES and CB-839, respectively. Points represent the mean and error bars the standard deviation of three independent experiments.
Figure 7.
Figure 7.
GAC tetramer formation is required for BPTES binding. A, tryptophan fluorescence emission of 500 nm GAC(F327W) mutant (black) is rapidly quenched following addition of 1 μm BPTES. Under the same conditions, BPTES does not quench the fluorescence of 500 nm dimeric GAC(F327W,D391K) double mutant (red). B, SEC-MALS analysis of the GAC(F327W,D391K) double mutant (5 mg/ml) shows a molecular weight distribution consistent with a dimer both before (broken blue line) and after (dotted blue line) preincubation with 50 μm BPTES.
Figure 8.
Figure 8.
F327W fluorescence is enhanced by allosteric activators and correlates with their ability to activate GAC activity. A, addition of inorganic phosphate (HPO42−) or sulfate (SO42−) to give a final concentration of 50 mm to the F327W mutant (400 nm) resulted in enhancement of tryptophan fluorescence, where inorganic phosphate stimulated the greater enhancement (black) compared with sulfate (red). B, glutaminase activity of 50 nm WT GAC was measured in the presence of increasing concentrations of phosphate (black circles) or sulfate (red circles), giving KD values of 20.6 ± 0.4 mm and 36.4 ± 3.0 mm, respectively. Tryptophan fluorescence enhancement upon addition of these anions to 400 nm GAC(F327W) is overlaid (blue diamonds and blue triangles). Data points and error bars represent the mean ± S.D. of three independent experiments. C, SEC-MALS of 5 mg/ml WT GAC, where phosphate (orange) or sulfate (green) was included in the running buffer at a concentration of 50 mm, shows the shift from a molecular weight distribution of a heterogeneous population of GAC dimers and tetramers in the absence of either anion (broken blue line) to an equilibrium of 8- to 16-mers for sulfate (dotted blue line) up to greater than 32-mers for phosphate (spaced dotted blue lines). D, the enhancement of the F327W fluorescence upon addition of 50 mm HPO42− to increasing concentrations of GAC(F327W) (blue circles, left axis) was plotted together with the previously reported FRET values of 488- and QSY9-labeled WT GAC and the specific activity of WT GAC in the absence of phosphate (10). Points represent the mean and error bars the standard deviation of three independent experiments.
Figure 9.
Figure 9.
Schematic of the dimeric and tetrameric species of GAC as influenced by allosteric activators and BPTES class inhibitors. Inactive GAC dimers associate to form active GAC tetramers in the absence of allosteric activators or inhibitors (basal enzyme activity). Anionic activators, such as inorganic phosphate, bind to the GAC tetramer at the activation loop to induce an active conformation, resulting in activated tetramers with the potential of forming higher-order oligomers (not shown). BPTES class inhibitors bind to the activation loop in GAC tetramers, locking the activation loop in an inactive state, forming highly stable drug-bound tetramers.

References

    1. Hensley C. T., Wasti A. T., and DeBerardinis R. J. (2013) Glutamine and cancer: cell biology, physiology, and clinical opportunities. J. Clin. Invest. 123, 3678–3684 - PMC - PubMed
    1. DeBerardinis R. J., and Cheng T. (2010) Q's next: the diverse functions of glutamine in metabolism, cell biology and cancer. Oncogene 29, 313–324 - PMC - PubMed
    1. Krall A. S., and Christofk H. R. (2015) Rethinking glutamine addiction. Nat. Cell Biol. 17, 1515–1517 - PubMed
    1. DeBerardinis R. J., Lum J. J., Hatzivassiliou G., and Thompson C. B. (2008) The biology of cancer: metabolic reprogramming fuels cell growth and proliferation. Cell Metab. 7, 11–20 - PubMed
    1. Sun R. C., and Denko N. C. (2014) Hypoxic regulation of glutamine metabolism through HIF1 and SIAH2 supports lipid synthesis that is necessary for tumor growth. Cell Metab. 19, 285–292 - PMC - PubMed

Publication types

MeSH terms