. 2017 Apr 7;292(14):5705-5723.
doi: 10.1074/jbc.M117.779181. Epub 2017 Feb 14.

Identification of a transcriptional activation domain in yeast repressor activator protein 1 (Rap1) using an altered DNA-binding specificity variant

Affiliations

Identification of a transcriptional activation domain in yeast repressor activator protein 1 (Rap1) using an altered DNA-binding specificity variant

Amanda N Johnson et al. J Biol Chem. .

Abstract

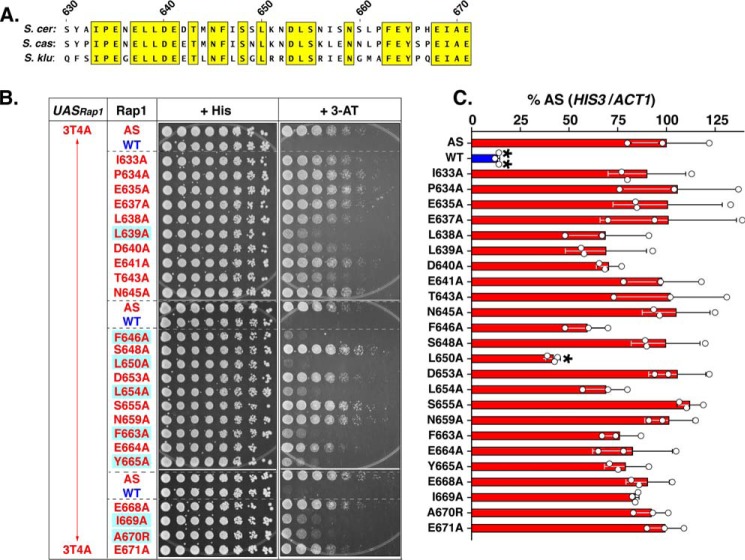
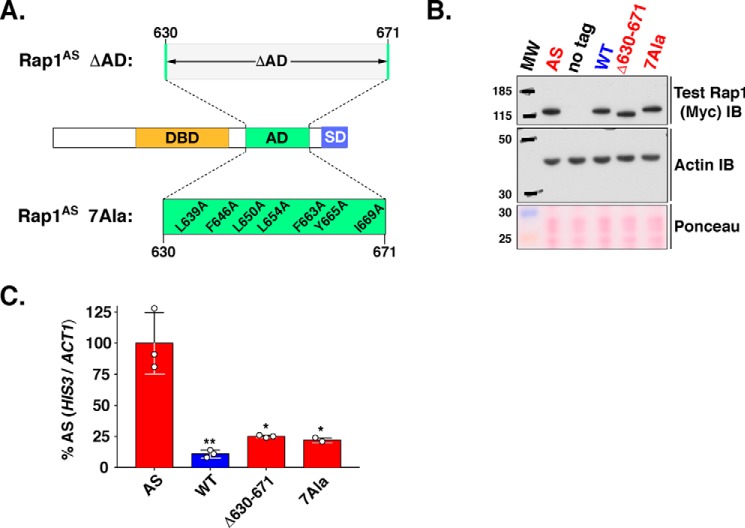
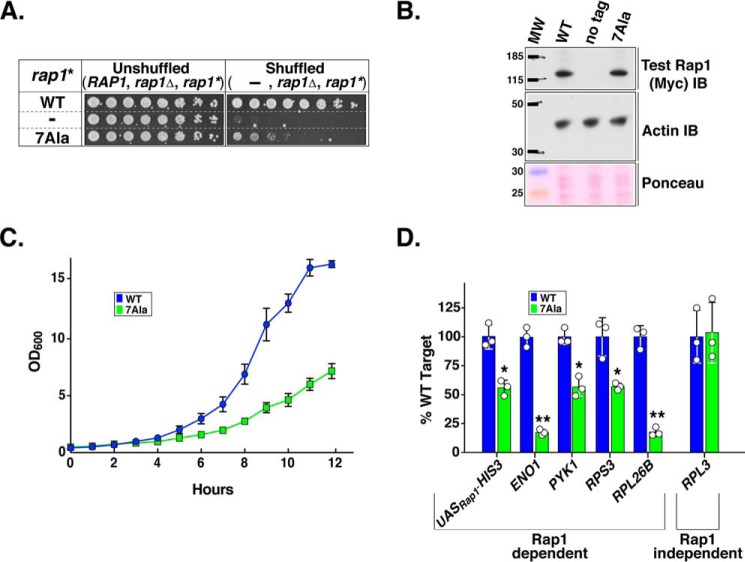
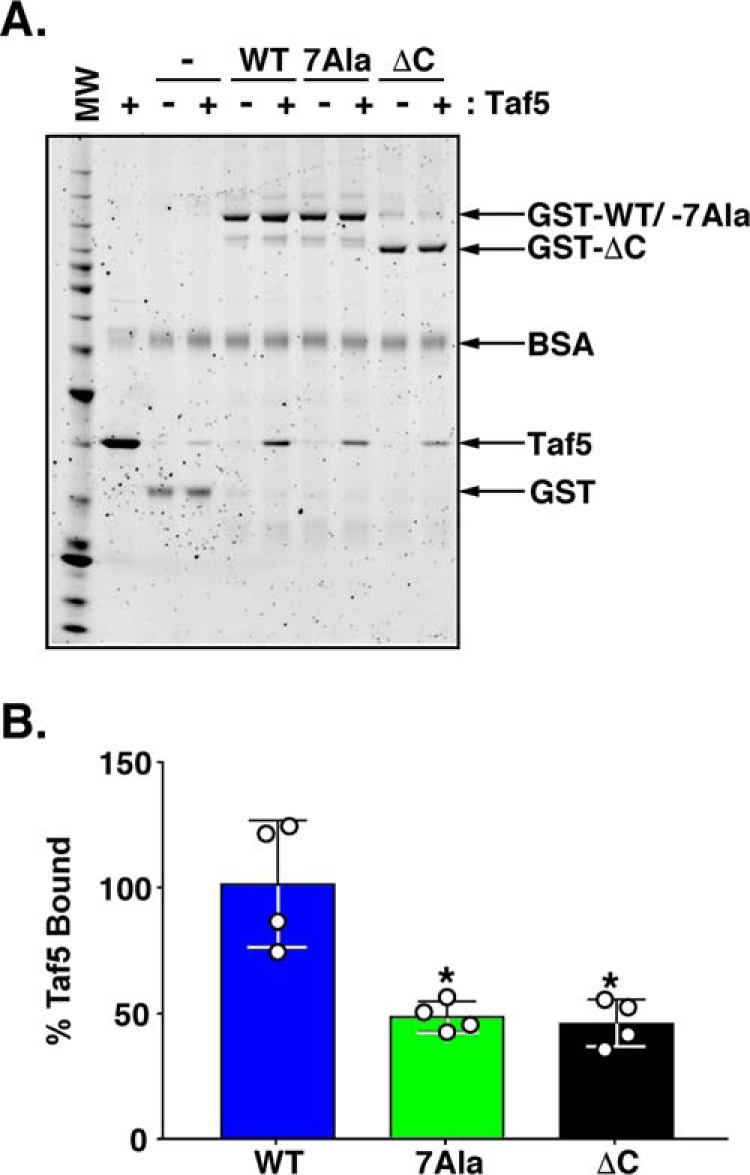
Repressor activator protein 1 (Rap1) performs multiple vital cellular functions in the budding yeast Saccharomyces cerevisiae These include regulation of telomere length, transcriptional repression of both telomere-proximal genes and the silent mating type loci, and transcriptional activation of hundreds of mRNA-encoding genes, including the highly transcribed ribosomal protein- and glycolytic enzyme-encoding genes. Studies of the contributions of Rap1 to telomere length regulation and transcriptional repression have yielded significant mechanistic insights. However, the mechanism of Rap1 transcriptional activation remains poorly understood because Rap1 is encoded by a single copy essential gene and is involved in many disparate and essential cellular functions, preventing easy interpretation of attempts to directly dissect Rap1 structure-function relationships. Moreover, conflicting reports on the ability of Rap1-heterologous DNA-binding domain fusion proteins to serve as chimeric transcriptional activators challenge use of this approach to study Rap1. Described here is the development of an altered DNA-binding specificity variant of Rap1 (Rap1AS). We used Rap1AS to map and characterize a 41-amino acid activation domain (AD) within the Rap1 C terminus. We found that this AD is required for transcription of both chimeric reporter genes and authentic chromosomal Rap1 enhancer-containing target genes. Finally, as predicted for a bona fide AD, mutation of this newly identified AD reduced the efficiency of Rap1 binding to a known transcriptional coactivator TFIID-binding target, Taf5. In summary, we show here that Rap1 contains an AD required for Rap1-dependent gene transcription. The Rap1AS variant will likely also be useful for studies of the functions of Rap1 in other biological pathways.

Keywords: Saccharomyces cerevisiae; altered DNA binding specificity; gene regulation; protein engineering; transcription activation; transcription activator; transcription regulation; yeast.


Conflict of interest statement

The authors declare that they have no conflicts of interest with the contents of this article

Figures

Figure 1.
Figure 1.
Mutation of WT UASRap1 nucleotides 3A and 4T to 3T and 4A significantly decreases binding of WT Rap1 to 3T4A UASRap1 DNA. A, Rap1 DBD homeodomain-1 recognition helix (dark blue, top) is shown in complex with its DNA recognition site labeled bp1, bp2, bp3, bp4, bp5, bp6. Top strand, tan hues (5′-1ACACCC6-3′), and bottom strand, teal hues. Hydrogen bonds between protein and DNA are indicated by dashed green lines; H-bonds mediated by H2O molecules are indicated by green dashed lines and red spheres; hydrophobic interactions are indicated by black dashed lines. The DNA base pairs mutated to create the 3T4A mutant-binding site are bp3 and bp4. Rap1 DBD recognition helix amino acid residues targeted for codon randomization mutagenesis are indicated by yellow ovals at amino acid positions N401, S402, H405, R408, and V409. Image was generated using PyMOL (130) from Protein Data Bank code 1IGN (47). B, gel shift competition DNA-binding analyses with WT UASRap1 or 3T4A UASRap1 DNAs. Gel shift binding reactions were performed by incubating 100 fmol of purified recombinant Rap1WT with 50 fmol (700 cpm/fmol) of duplex 32P-labeled WT UASRap1 DNA (5′-1ACACCCATACATT13-3′) alone (No Rap1, −Rap1), or with Rap1 and either no competitor (−), or the indicated fold molar-excess of either cold WT UASRap1 (top gel scan) or cold 3T4A UASRap1 (bottom gel scan); 0.5×, 1×, 2×, 5×, 10×, 25×, 50×, 100×, or 200× left to right (WT, blue circles; 3T4A, red squares) in a final volume of 20 μl. Reactions were fractionated on non-denaturing polyacrylamide gels, vacuum-dried, and imaged using a Bio-Rad Pharos FX imager. The amount of bound complex from each reaction was quantified using Bio-Rad Quantity One software. Data were analyzed using GraphPad Prism 7 software and are expressed as % Rap1WT-[32P]DNA complex when no competitor is present (i.e. + Rap1 and − competitor). Plot curves were generated using an [inhibitor] versus response non-linear fit. Error bars represent S.D. A representative image for each competition was chosen from among three independent replicates.
Figure 2.
Figure 2.
Rap1 DBD mutagenesis strategy. A, schematic of Rap1 showing the location of the DBD within the 827-aa-long protein. Amino acid sequence of DBD region aa 400–409 (black, 3-letter code) is shown along with the corresponding nt codon sequence (black) and a portion of one of the primers used for codon randomization (purple) indicating the targeted codons (NNS, N = any nt, S = G or C). B, schematic of integrated UASRap1-driven TATA-HIS3 reporter genes used in the selection of the altered DNA-binding specificity variant of Rap1. Two versions of the reporter are shown, WT (top), where HIS3 is driven by tandem copies of the WT UASRap1 enhancer sequence 1ACATCCATACACC13, or 3T4A variant UASRap1 enhancer, 1ACTACCATACACC13. Mutated nts are shown in red in FIGURE.
Figure 3.
Figure 3.
Rap1 mutagenesis screen identifies a Rap1 variant with altered DNA-binding specificity. A, amino acid sequence of mutagenized Rap1 DBD amino acids 400–409 (yellow highlighting) and 14 variant forms (#2–18) of Rap1 identified in the Rap1AS screen. Amino acid changes in these variants are indicated (green). Lower, a motif of putative Rap1AS hit homeodomain-1 recognition helix sequences generated using MEME. The size of each letter is proportional to its frequency of appearance among the Rap1 variant sequences #2–18. B, yeast growth test to assess the ability of various forms of Rap1 (WT) or variant (#2–18) to confer resistance to 5 mm 3-aminotriazole via expression of either the WT UASRap1-HIS3 reporter variant (blue) or the 3T4A UASRap1-HIS3 (red) variant and either a second copy of Rap1WT or the indicated Rap1AS screen hit. Yeast were serially diluted 1:4 (left to right) and spotted using a pinning tool onto non-selective media (+ His) and media that selected from expression of the UASRap1-HIS3 reporter (+ 3-AT). Plates were photographed after growth at 30 °C for 2 days. Images are representative of three independent biological replicates. C, gel shift competition analysis performed to compare the binding affinity of WT and Rap1AS screen hit variant 2 for binding to either WT UASRap1 or 3T4A UASRap1 DNAs. Assays were performed (as in Fig. 1B) by incubating purified Rap1WT or Rap1 variant 2 with its cognate binding site 32P-WT UASRap1 (blue) or 32P-3T4A UASRap1 (red). Binding reactions also included either no competitor (−) or 50-fold mole-excess of either cold WT UASRap1 (W, blue) or cold 3T4A UASRap1 (M, red) as shown. A representative image from two independent replicates is presented. D, plasmid shuffle analysis of altered DNA-binding specificity Rap1 variant 2 performed to test its ability to complement the rap1Δ null allele. Yeast carrying a chromosomal null RAP1 allele (rap1Δ) and a URA3-marked RAP1 covering plasmid were transformed with a test variant of RAP1, labeled rap1*: (i) a second plasmid-borne copy of RAP1 (labeled WT, blue); (ii) empty plasmid vector (labeled −, black); or (iii) the same plasmid vector expressing Rap1 variant 2 (labeled AS#2, red). Yeast were serially diluted 1:4 (left to right), and growth was scored on media lacking 5-FOA (“Unshuffled”; relevant genotype: RAP1, rap1Δ, rap1*) or containing 5-FOA (“Shuffled” relevant genotype: −, rap1Δ, rap1*). Plates were incubated at 30 °C for 2 days and then photographed; a representative image from three independent replicates is shown.
Figure 4.
Figure 4.
Functional characterization of Rap1AS. A, Rap1AS specifically drives the mutant 3T4A UASRap1-HIS3 reporter. Upper, test of the ability of WT and AS forms of Rap1 to bind different enhancers to confer aminotriazole-resistant growth using the assay detailed in Fig. 3B. Yeast strains carrying the indicated UASRap1-HIS3 reporter variant (WT, 3G5G, ΔUAS, or 3T4A, as shown) and either a second copy of Rap1WT (blue) or Rap1AS (red) were grown on non-selective (+ His) or HIS3-reporter gene selection (+ 3-AT) media. Images shown are representative of three independent replicates. Lower, detailed structures of the UASRap1-HIS3 reporters used in these growth tests. B, qRT-PCR analyses of the steady-state levels of HIS3 reporter mRNA, relative to ACT1 in the yeast strains tested in A. Data were obtained by testing three biological replicates (each indicated by a white circle) analyzed in duplicate and plotted as a percentage of the HIS3 mRNA levels present in WT Rap1 + WT UASRap1 yeast. Mean ± S.D. is depicted. *, p < 0.01; **, p < 0.001. C, steady-state protein expression levels of Rap1WT and Rap1AS. MYC-tagged Rap1 forms (top, WT, AS; Test Rap1 (Myc) IB) were scored using immunoblotting (IB) with anti-Myc IgG. A strain carrying a plasmid expressing only untagged Rap1 was used as a specificity control for the Myc antibody (labeled no tag). Prior to incubation with antibodies, blots were stained with Ponceau S to monitor total protein loading (bottom, Ponceau S). Equal protein loading was also monitored via immunoblotting with anti-actin IgG (middle, Actin IB). Images are representative of three independent replicates. D, growth curves of yeast expressing WT or AS forms of Rap1 from a plasmid carrying either a second copy of Rap1WT or Rap1AS (labeled WT/WT or WT/AS). Overnight-grown yeast starter cultures were diluted to a starting OD600 of 0.5, and the optical density of the cultures was monitored over the course of 12 h. Data shown represents the average of three biological replicates. Error bars represent S.D.
Figure 5.
Figure 5.
Mapping the activation domain of Rap1 to amino acids 630–671. A, schematic of the Rap1 protein. Shown are the well characterized Rap1 DNA DBD (aa 330–600) and silencing domain (SD) as well as the region suspected to contain the AD (AD? 600–671). B, growth analysis of yeast strains carrying the 3T4A version of the HIS3 reporter (left column, UASRap1-red; labeled 3T4A) and various forms of Rap1 (labeled Rap1, 2nd column) either Rap1AS (AS, red), Rap1WT (WT, blue), or the indicated Rap1AS deletion mutant (ΔAD?, Δ600–610, Δ611–620, Δ621–630, Δ631–640, Δ641–650, Δ651–660, Δ660–671; red). Serial dilutions of cells were plated and grown on non-selective (+ His), or reporter gene-selective (+ 3-AT) media as in Figs. 3B and 4A. Images are representative of three independent replicates. C, qRT-PCR analysis to score reporter HIS3 mRNA expression levels in the various yeast strains tested in B. Results of these analyses are plotted as in Fig. 4B, except that data are expressed as a percentage of the relative HIS3 mRNA levels in yeast carrying Rap1AS instead of Rap1WT. Data represent three biological replicates (white circles) measured in duplicate. Mean ± S.D. is depicted. *, p < 0.05; **, p < 0.01; ***, p < 0.005. D, immunoblot analysis of Rap1AS, Rap1WT, and Rap1AS deletion variant protein expression levels. This analysis was performed as detailed in Fig. 4C. Images are representative of three independent replicates. E, schematic indicating the location of the Rap1 activation domain (AD; aa 630–671) mapped through the deletion mutagenesis experiments shown here.
Figure 6.
Figure 6.
Activation function of the Rap1 AD depends upon evolutionarily conserved hydrophobic amino acids. A, multiple sequence alignment of S. cerevisiae (S. cer) Rap1 activation domain amino acids 630–671 with the corresponding region of Rap1 proteins from the sensu lato yeast S. castelli (S. cas.) and S. kluyveri (S. klu). Amino acids that are identical in all three yeast species are boxed in yellow. These conserved amino acids were targeted for site-directed mutagenesis. B, growth analysis of yeast strains carrying the 3T4A UASRap1-HIS3 reporter and either positive (AS, Rap1AS) and negative (WT, Rap1WT) control forms of Rap1 on the three sets of plates shown (i.e. AS, WT to N645A; AS, WT to Y665A; or AS, WT to E671E) or the indicated Rap1AS mutant variant (shown, I633A to E671A). Growth tests were performed as in Figs. 3–5 by plating serial dilutions of cells on either non-selective (+ His) or reporter gene-selective (+ 3-AT) media. Rap1AS AD point mutants that display a large decrease in growth relative to Rap1AS are boxed in blue. Images are representative of five independent replicates. C, qRT-PCR analysis performed on total RNA prepared from yeast carrying the 3T4A UASRap1-HIS3 reporter and either Rap1AS (AS), Rap1WT (WT), or the indicated Rap1AS AD point mutant variant. Analyses were performed as detailed for Fig. 5C. Data are representative of three biological replicates, each measured in duplicate. Mean ± S.D. is depicted. *, p < 0.005; **, p = 0.0001.
Figure 7.
Figure 7.
Seven hydrophobic Rap1 AD amino acids confer Rap1 activation function. A, schematic of Rap1 illustrating the structures of two AD knock-out alleles. Middle, schematic of intact Rap1 illustrating the location of known functional domains (DBD, AD, and SD). Top, Rap1 AD sequences 630–671 that were deleted from Rap1. Bottom, location and sequence of the seven hydrophobic amino acids identified by site-directed mutagenesis and functional assays (Fig. 6, above) that were all mutated to alanine (L639A, F646A, L650A, L654A, F663A, Y665A, and I669A) to create the Rap1AS 7Ala variant. B, steady-state protein levels of Rap1 variants tested in A (AS, WT, Δ630–671, 7Ala; specificity control = no tag, as labeled; blots performed as detailed in Figs. 4C and 5D). Images are representative of two independent replicates. C, qRT-PCR analysis performed on total RNA prepared from yeast carrying the 3T4A UASRap1-HIS3 reporter and either Rap1AS (AS), Rap1WT (WT), or Rap1AS AD knock-out variants (Δ630–671 or 7Ala). Analyses were performed as detailed for Figs. 5C and 6C. Data are representative of three biological replicates, each measured in triplicate. Mean ± S.D. is depicted. *, p = 0.0002; **, p = 0.0001.
Figure 8.
Figure 8.
Rap1 AD is required both for normal growth and transcription of authentic chromosomal Rap1 target genes. A, ability of the Rap17Ala variant to support cell viability was assessed by plasmid shuffle analyses. Yeast carrying a chromosomal null RAP1 allele (rap1Δ) and a URA3-marked RAP1 covering plasmid were transformed with a test variant of RAP1, labeled rap1*: (i) a second plasmid-borne copy of RAP1 (labeled WT); (ii) empty plasmid vector (labeled −); or (iii) the same plasmid vector expressing the Rap17Ala variant (labeled 7Ala). Yeast were serially diluted 1:4 (left to right), and growth was scored on media either lacking 5-FOA (Unshuffled; relevant genotype, RAP1, rap1Δ, rap1*) or containing 5-FOA (Shuffled relevant genotype: −, rap1Δ, rap1*) as detailed in Fig. 3D. Images are representative of five independent replicates. B, immunoblot (IB) analysis of the in vivo steady-state levels of Rap1WT and Rap17Ala proteins. Analysis was performed as described in Figs. 5D and 7B. Images are representative of four independent replicates. C, growth curve analysis of three biological replicates of shuffled yeast strains expressing either only Rap1WT or Rap17Ala and performed and plotted as described in Fig. 4D. D, analysis of nascent RNA levels for several chromosomal yeast genes (integrated UASRap1-HIS3 reporter, ENO1, PYK1, RPS3, RPL26B, and RPL3) in cells solely expressing WT RAP1 or the 7Ala variant of RAP1. Cellular RNAs were pulse-labeled with 4sU for 2.5 min, extracted, and purified. RNA thiol groups present on 4sU-labeled RNA were chemically biotinylated, and affinity-purified. Affinity-purified RNA was analyzed via qRT-PCR to quantify the amount of nascent transcripts produced from each of the six genes noted above. qRT-PCR analyses were performed as described in Fig. 5C except that data were normalized to S. pombe β-tubulin mRNA present due to the addition of 4sU pulse-labeled S. pombe cells into each sample prior to RNA extraction. Data are representative of three biological replicates, each measured in triplicate. Mean ± S.D. is depicted. * = p < 0.002; ** = p < 0.0001. See “Experimental Procedures” for details.
Figure 9.
Figure 9.
Mutation of the Rap1 AD reduces binding of Rap1 to the RBD of the TFIID coactivator subunit Taf5. A, Sypro-stained NuPAGE gel of Taf5/GST-Rap1 pulldown protein-protein binding reactions. Pulldown experiments were conducted using negative control GST−, positive control GST-WT Rap1, test GST-7Ala Rap1, and test GST-ΔC Rap1-loaded GST-agarose beads and the N-terminal RBD-containing fragment of Taf5 (aa 1–337). Glutathione-Sepharose beads loaded with either 12 pmol of GST or 6 pmol of GST-Rap1 variant (GST−, GST-WT Rap1, GST-7Ala Rap1, GST-ΔC Rap1; labels, arrows) were incubated with either 0 or 100 pmol of purified Taf5 fragment under the conditions detailed under “Experimental Procedures.” All incubations contained bovine serum albumin (BSA; label, arrow) to minimize nonspecific protein binding to the beads. Bead-bound proteins were eluted with SDS-sample buffer, heat-denatured, and fractionated on an SDS-polyacrylamide gel in parallel with molecular weight standards (MW), and 25 pmol of purified Taf5 (Taf5). Gels were stained with Sypro Ruby, and images were obtained using a Pharos FX imager. Image is representative of four independent replicates. B, quantification of the data shown in A. Quantity One software was used to score the intensity of GST−, GST-Rap1 variant, and Taf5 bands. The intensity of each Taf5 band was normalized to the intensity of each GST− or GST-Rap1 variant band, and then Taf5 binding to GST beads alone was subtracted from the Taf5 binding of all GST-Rap1 variants. Taf5 binding data obtained from four independent replicates are plotted using Graph Pad Prism 7 software as a percentage of the Taf5 binding to GST-Rap1 WT. Mean ± S.D. is depicted. *, p = 0.002.

Similar articles

Cited by

References

    1. Taatjes D. J., Marr M. T., and Tjian R. (2004) Regulatory diversity among metazoan co-activator complexes. Nat. Rev. Mol. Cell Biol. 5, 403–410 - PubMed
    1. Hahn S., and Young E. T. (2011) Transcriptional regulation in Saccharomyces cerevisiae: transcription factor regulation and function, mechanisms of initiation, and roles of activators and coactivators. Genetics 189, 705–736 - PMC - PubMed
    1. Shandilya J., and Roberts S. G. (2012) The transcription cycle in eukaryotes: from productive initiation to RNA polymerase II recycling. Biochim. Biophys. Acta 1819, 391–400 - PubMed
    1. Weake V. M., and Workman J. L. (2010) Inducible gene expression: diverse regulatory mechanisms. Nat. Rev. Genet. 11, 426–437 - PubMed
    1. Ranish J. A., and Hahn S. (1996) Transcription: basal factors and activation. Curr. Opin. Genet. Dev. 6, 151–158 - PubMed

MeSH terms

Substances

Associated data