. 2018 May;67(5):805-817.
doi: 10.1136/gutjnl-2016-312779. Epub 2017 Feb 14.

A signalling cascade of IL-33 to IL-13 regulates metaplasia in the mouse stomach

Affiliations

A signalling cascade of IL-33 to IL-13 regulates metaplasia in the mouse stomach

Christine P Petersen et al. Gut. 2018 May.

Abstract

Objective: Alternatively activated macrophages (M2) are associated with the progression of spasmolytic polypeptide-expressing metaplasia (SPEM) in the stomach. However, the precise mechanism(s) and critical mediators that induce SPEM are unknown.

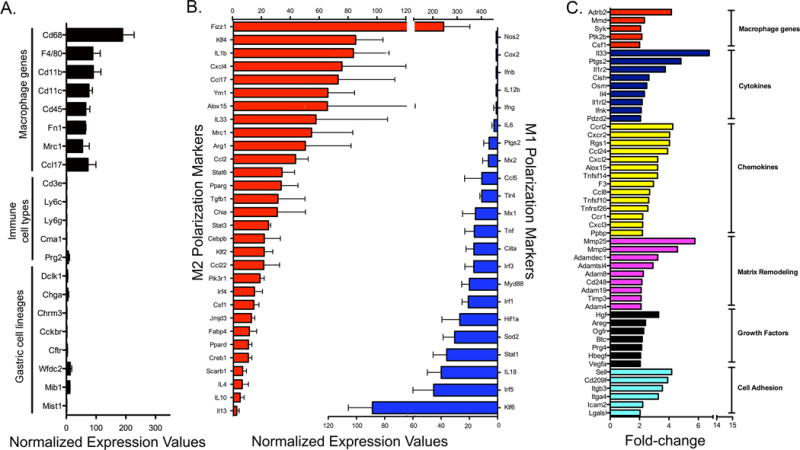
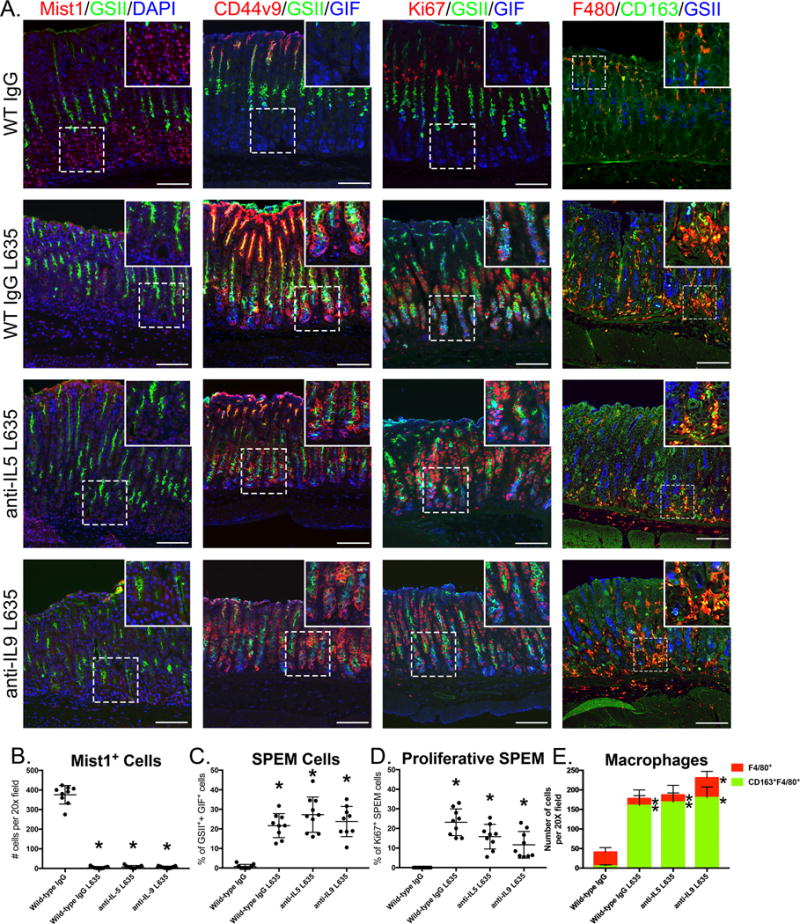
Design: To determine candidate genes important in these processes, macrophages from the stomach corpus of mice with SPEM (DMP-777-treated) or advanced SPEM (L635-treated) were isolated and RNA sequenced. Effects on metaplasia development after acute parietal cell loss induced by L635 were evaluated in interleukin (IL)-33, IL-33 receptor (ST2) and IL-13 knockout (KO) mice.

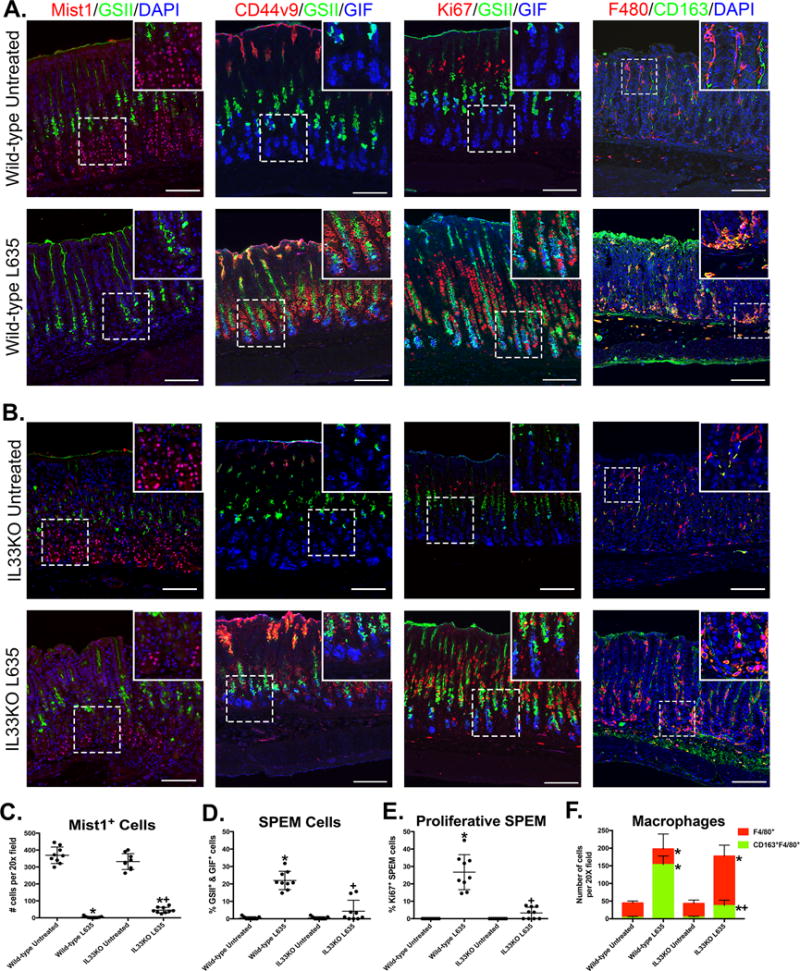
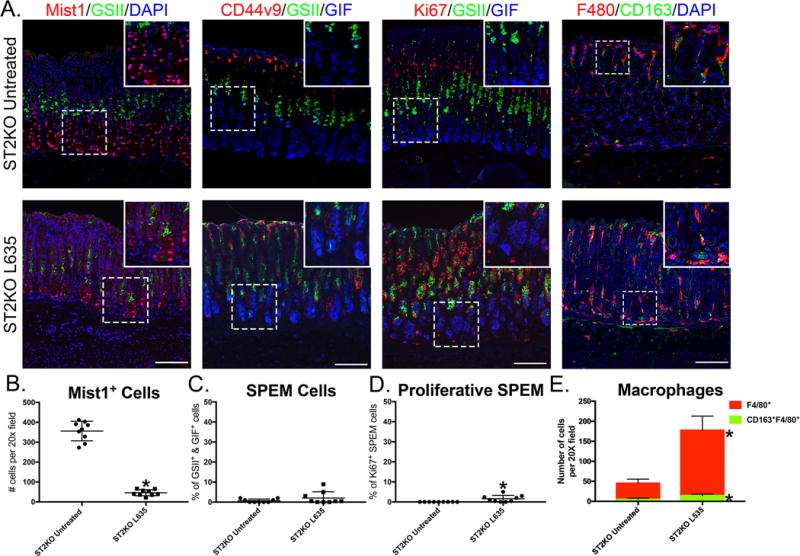
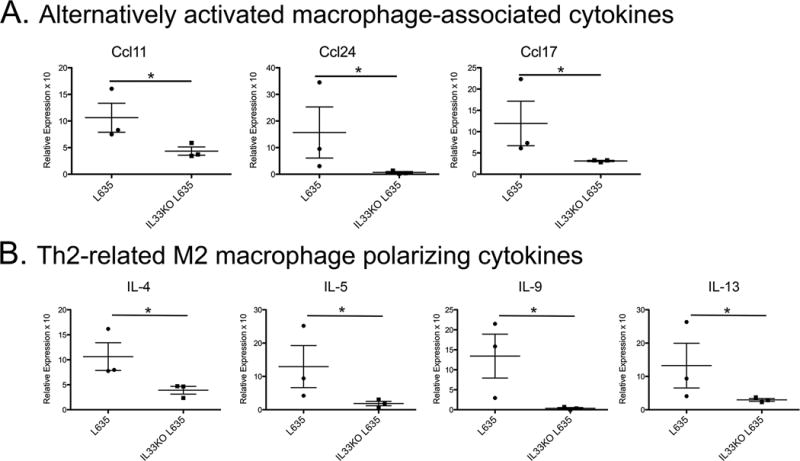
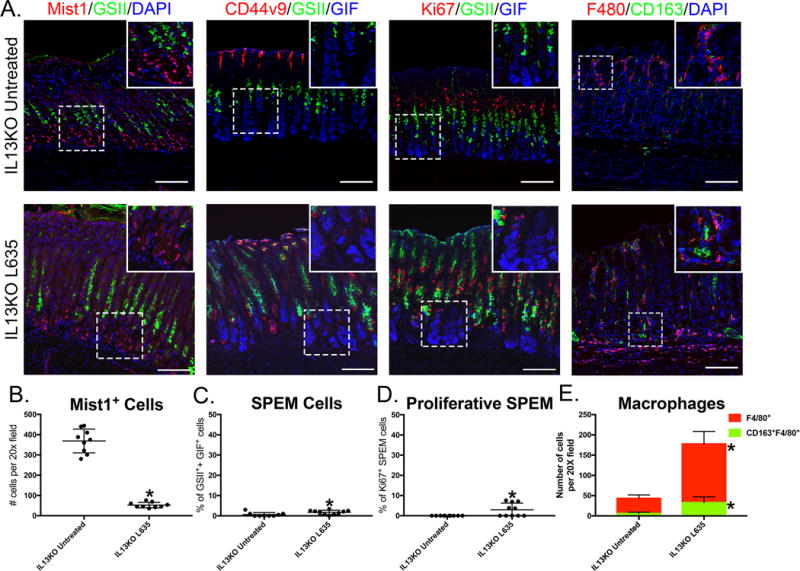
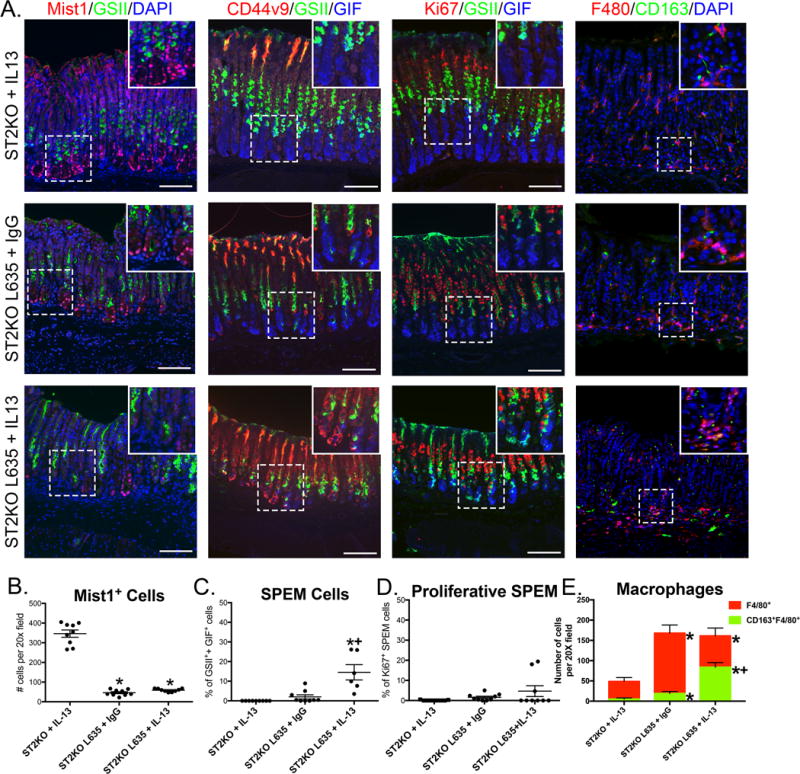
Results: Profiling of metaplasia-associated macrophages in the stomach identified an M2a-polarised macrophage population. Expression of IL-33 was significantly upregulated in macrophages associated with advanced SPEM. L635 induced metaplasia in the stomachs of wild-type mice, but not in the stomachs of IL-33 and ST2 KO mice. While IL-5 and IL-9 were not required for metaplasia induction, IL-13 KO mice did not develop metaplasia in response to L635. Administration of IL-13 to ST2 KO mice re-established the induction of metaplasia following acute parietal cell loss.

Conclusions: Metaplasia induction and macrophage polarisation after parietal cell loss is coordinated through a cytokine signalling network of IL-33 and IL-13, linking a combined response to injury by both intrinsic mucosal mechanisms and infiltrating M2 macrophages.

Keywords: CELLULAR IMMUNOLOGY; CYTOKINES; GASTRIC PRE-CANCER; GASTRITIS; MACROPHAGES.


Conflict of interest statement

Competing interests: None declared.

Figures

Figure 1
Figure 1. Transcriptome analysis of an enriched macrophage population associated with metaplasia in the stomach
Gene expression profile of macrophages from metaplasia, was determined for 3 replicates/each sample A. Expression values of macrophage genes (Cd68, Cd11b, Fn1), other immune cell types (Cd3e: T-cells, Ly6c: neutrophils, Prg2: eosinophils), and gastric epithelial cell lineages (Dclk1: tuft cells, Chga: endocrine cells, Cckbr: parietal cells, Mist1: chief cells), demonstrate a population enriched for macrophages. B. Expression levels of M1 (blue) and M2 (red)-associated genes, in macrophages isolated from advanced SPEM (L635-treated mice) plotted with SEM. Macrophages associated with advanced SPEM express increased M2-like transcripts (Fizz1, Klf4, Il33) compared to M1 genes (Nos2, Ifng). C. Factors significantly upregulated in macrophages from advanced SPEM (L635-treated mice) (p < 0.01; fold change ≥2 compared with macrophages isolated from DMP-777-treated mice). Representative genes selected were grouped based on function.
Figure 2
Figure 2. IL-33 is necessary for induction of metaplasia and polarization of M2 macrophages
A. Immunofluorescence staining for chief cell transcription factor Mist1, mucus marker GSII-lectin, chief cell granule marker gastric intrinsic factor (GIF), SPEM marker CD44 variant isoform 9 (CD44v9), proliferation marker Ki67, macrophage marker F4/80, M2 macrophage marker CD163 and nuclei marker DAPI in untreated wild-type and L635-treated wild-type mice. B. Immunofluorescence staining for chief cell transcription factor Mist1, mucus marker GSII-lectin chief cell granule marker gastric intrinsic factor (GIF), SPEM marker CD44 variant isoform 9 (CD44v9), proliferation marker Ki67, macrophage marker F4/80, M2 macrophage marker CD163 and nuclei marker DAPI in untreated IL33KO and L635-treated IL33KO mice. C. Quantification of Mist1 positive nuclei per 20× field. L635-treated IL33KO mice had significantly fewer Mist1-positive cells compared to untreated IL33KO mice, and significantly more Mist1-positive cells compared wild-type L635-treated mice. D. Quantification of SPEM cells determined by percent of GIF positive cells co-positive for CD44v9 and GSII-lectin. L635-treated IL33KO mice have significantly fewer SPEM cells compared to wild-type L635-treated mice. E. Quantification of proliferative SPEM cells determined by the percent of SPEM cells positive for Ki67. L635-treated IL33KO mice have significantly fewer proliferative SPEM cells compared to wild-type L635-treated mice. F. Quantification of F4/80-positive macrophages (red) and F4/80 and CD163 co-positive M2 macrophages (green) per 20× field. L635-treated IL33KO mice had similar F4/80-expressing macrophage infiltration as wild-type L635-treated mice, but significantly fewer F4/80 macrophages were co-positive for CD163. * denotes significant difference (p<0.05) compared to untreated mice, ✚ denotes significant difference (p<0.05) compared to L635-treated wild-type mice. White dashed boxes are magnified in the insets. Scale bars = 100 μm.
Figure 3
Figure 3. IL-33 signaling drives SPEM development and M2 macrophage polarization
A. Immunofluorescence staining for chief cell transcription factor Mist1, mucus marker GSII-lectin, chief cell granule marker gastric intrinsic factor (GIF), SPEM marker CD44 variant isoform 9 (CD44v9), proliferation marker Ki67, macrophage marker F4/80, M2 macrophage marker CD163 and nuclei marker DAPI in untreated ST2 (IL33 receptor) knockout mice and L635-treated ST2 knockout mice. B. Quantification of Mist1 positive nuclei per 20× field. L635-treated ST2KO mice had significantly fewer Mist1-positive cells compared to untreated ST2KO mice, although some Mist1-positive cells remained. C. Quantification of SPEM cells determined by percent of GIF positive cells co-positive for CD44v9 and GSII-lectin. L635-treated ST2KO mice did not have significant changes in SPEM cell number compared to untreated ST2KO mice. D. Quantification of proliferative SPEM cells determined by the percent of SPEM cells positive for Ki67. Although L635-treated ST2KO had very few SPEM cells, some of the SPEM cells were proliferating so there is a significantly higher percent of proliferative SPEM cells in L635-treated ST2KO mice compared to untreated ST2KO mice. E. Quantification of F4/80-positive macrophages (red) and F4/80 and CD163 co-positive M2 macrophages (green) per 20× field. L635-treated ST2KO mice have significant F4/80-positive macrophage infiltration compared to untreated ST2KO mice. L635-treated ST2KO mice also have significantly more F4/80 and CD163 co-positive cells compared to untreated ST2KO mice, however the percent of F4/80 macrophages that are co-positive for CD163 is around 10% in both mouse models. * denotes significant difference (p<0.05) compared to untreated mice. White dashed boxes are magnified in the insets. Scale bars = 100 μm.
Figure 4
Figure 4. Altered cytokine response in IL-33 KO mice
Analysis of 84 mouse chemokines and cytokines in whole stomach corpus RNA from L635-treated wild type mice and L635-treated IL33KO mice (n=3). A. Alternatively activated macrophage-related chemokines (Ccl11, Ccl24 and Ccl17) were significantly decreased in L635-treated IL33KO mice compared to L635-treated wild-type mice. B. Th2-related M2 macrophage polarizing cytokines were significantly decreased in L635-treated IL33KO mice compared to L635-treated wild-type mice. (*p<0.05).
Figure 5
Figure 5. IL-5 and IL-9 are not required for SPEM development and M2 macrophage polarization in the atrophic stomach
A. Immunofluorescence staining for chief cell transcription factor Mist1, mucus marker GSII-lectin, chief cell granule marker gastric intrinsic factor (GIF), SPEM marker CD44 variant isoform 9 (CD44v9), proliferation marker Ki67, macrophage marker F4/80, M2 macrophage marker CD163 and nuclei marker DAPI in wild-type mice treated with non-specific IgG or the following L635 treated mice: non-specific IgG, anti-IL-5 and anti-IL-9. B. Quantification of Mist1 positive nuclei per 20× field. IL-5 or IL-9 depleted L635-treated mice had significant loss of Mis1-positive cells similar to non-specific IgG L635-treated mice. C. Quantification of SPEM cells determined by percent of GIF positive cells co-positive for CD44v9 and GSII-lectin. IL-5 or IL-9 depleted L635-treated mice have a significant percent of SPEM cells similar to non-specific IgG L635-treated mice. D. Quantification of proliferative SPEM cells determined by the percent of SPEM cells positive for Ki67. IL-5 or IL-9 depleted mice have a significant percent of proliferating SPEM cells similar to non-specific IgG L635-treated mice. E. Quantification of F4/80-positive macrophages (red) and F4/80 and CD163 co-positive M2 macrophages (green) per 20× field. IL-5 or IL-9 depleted mice had significant infiltration of F4/80-positive macrophages, most of which were co-positive for CD163 similar to non-specific IgG L635-treated mice. * denotes significant difference (p<0.05) compared to non-specific IgG-treated mice without L635-treatment. White dashed boxes are magnified in the insets. Scale bars = 100 μm.
Figure 6
Figure 6. IL-13 signaling downstream of IL-33/ST2 drives metaplasia induction and M2 macrophage polarization
A. Immunofluorescence staining for chief cell transcription factor Mist1, mucus marker GSII-lectin, chief cell granule marker gastric intrinsic factor (GIF), SPEM marker CD44 variant isoform 9 (CD44v9), proliferation marker Ki67, macrophage marker F4/80, M2 macrophage marker CD163 and nuclei marker DAPI in untreated IL13KO mice and L635-treated IL13KO mice. B. Quantification of Mist1 positive nuclei per 20× field. L635-treated IL13KO mice had significantly fewer Mist1-positive cells compared to untreated IL13KO mice, although some Mist1-positive cells remained. C. Quantification of SPEM cells determined by percent of GIF positive cells co-positive for CD44v9 and GSII-lectin. L635-treated IL13KO mice have a significantly higher percent of SPEM cells, however this number is still relatively low. D. Quantification of proliferative SPEM cells determined by the percent of SPEM cells positive for Ki67. L635-treated IL13KO had a few SPEM cells and some of the SPEM cells were proliferating so there is a significantly higher percent of proliferative SPEM cells in L635-treated IL13KO mice compared to untreated IL13KO mice. E. Quantification of F4/80-positive macrophages (red) and F4/80 and CD163 co-positive M2 macrophages (green) per 20× field. L635-treated IL13KO mice have significant F4/80-positive macrophage infiltration compared to untreated IL13KO mice. L635-treated IL13KO mice also have significantly more F4/80 and CD163 co-positive cells compared to untreated IL13KO mice, however the percent of F4/80 macrophages that are co-positive for CD163 is around 15% in both mouse models. * denotes significant difference (p<0.05) compared to untreated mice. White dashed boxes are magnified in the insets. Scale bars = 100 μm.
Figure 7
Figure 7. IL-13 is sufficient to induce metaplasia after parietal cell loss in the absence of IL-33/ST2 signaling
A. Immunofluorescence staining for chief cell transcription factor Mist1, mucus marker GSII-lectin, chief cell granule marker gastric intrinsic factor (GIF), SPEM marker CD44 variant isoform 9 (CD44v9), proliferation marker Ki67, macrophage marker F4/80, M2 macrophage marker CD163 and nuclei marker DAPI in ST2KO mice treated with IL-13 (ST2KOIL13), ST2KO mice treated with a non-specific IgG and L635 (ST2KOL635), or ST2KO mice treated with IL-13 and L635 (ST2KOL635-IL13). B. Quantification of Mist1 positive nuclei per 20× field. ST2KOL635-IL13 mice had significant loss of Mist1-positive cells similar to ST2KOL635. C. Quantification of SPEM cells determined by percent of GIF positive cells co-positive for CD44v9 and GSII-lectin. ST2KOL635-IL13 mice have a significantly higher percent of SPEM cells compared to ST2KOIl13 and ST2KOL635 mice. D. Quantification of proliferative SPEM cells determined by the percent of SPEM cells positive for Ki67. Although there is more SPEM in ST2KOL635-IL13 mice, there is no significant difference in proliferative SPEM. E. Quantification of F4/80-positive macrophages (red) and F4/80 and CD163 co-positive M2 macrophages (green) per 20× field. ST2KOL635-IL13 mice exhibit similar levels of F4/80-positive macrophage infiltration to ST2KOL635 mice, but there are significantly more F4/80 and C163 co-positive M2 macrophages in ST2KOL635-IL13 mice. * denotes significant difference (p<0.05) compared to untreated mice, ✚ denotes significant difference (p<0.05) compared to ST2KO non-specific IgG-treated L635-treated mice. White dashed boxes are magnified in the insets. Scale bars = 100 μm.

Similar articles

Cited by

References

    1. de Martel C, Ferlay J, Franceschi S, Vignat J, Bray F, Forman D, et al. Global burden of cancers attributable to infections in 2008: a review and synthetic analysis. The lancet oncology. 2012;13:607–15. - PubMed
    1. Blaser MJ, Parsonnet J. Parasitism by the “slow” bacterium Helicobacter pylori leads to altered gastric homeostasis and neoplasia. The Journal of clinical investigation. 1994;94:4–8. - PMC - PubMed
    1. Nam KT, Lee HJ, Sousa JF, Weis VG, O’Neal RL, Finke PE, et al. Mature chief cells are cryptic progenitors for metaplasia in the stomach. Gastroenterology. 2010;139:2028–37 e9. - PMC - PubMed
    1. Tatematsu M, Tsukamoto T, Mizoshita T. Role of Helicobacter pylori in gastric carcinogenesis: the origin of gastric cancers and heterotopic proliferative glands in Mongolian gerbils. Helicobacter. 2005;10:97–106. - PubMed
    1. Yoshizawa N, Takenaka Y, Yamaguchi H, Tetsuya T, Tanaka H, Tatematsu M, et al. Emergence of spasmolytic polypeptide-expressing metaplasia in Mongolian gerbils infected with Helicobacter pylori. Lab Invest. 2007;87:1265–76. - PubMed

Publication types

MeSH terms