. 2017 Apr;16(4 suppl 1):S15-S28.
doi: 10.1074/mcp.O116.065581. Epub 2017 Feb 14.

Using Quantitative Spectrometry to Understand the Influence of Genetics and Nutritional Perturbations On the Virulence Potential of Staphylococcus aureus

Affiliations

Using Quantitative Spectrometry to Understand the Influence of Genetics and Nutritional Perturbations On the Virulence Potential of Staphylococcus aureus

Jessica R Chapman et al. Mol Cell Proteomics. 2017 Apr.

Abstract

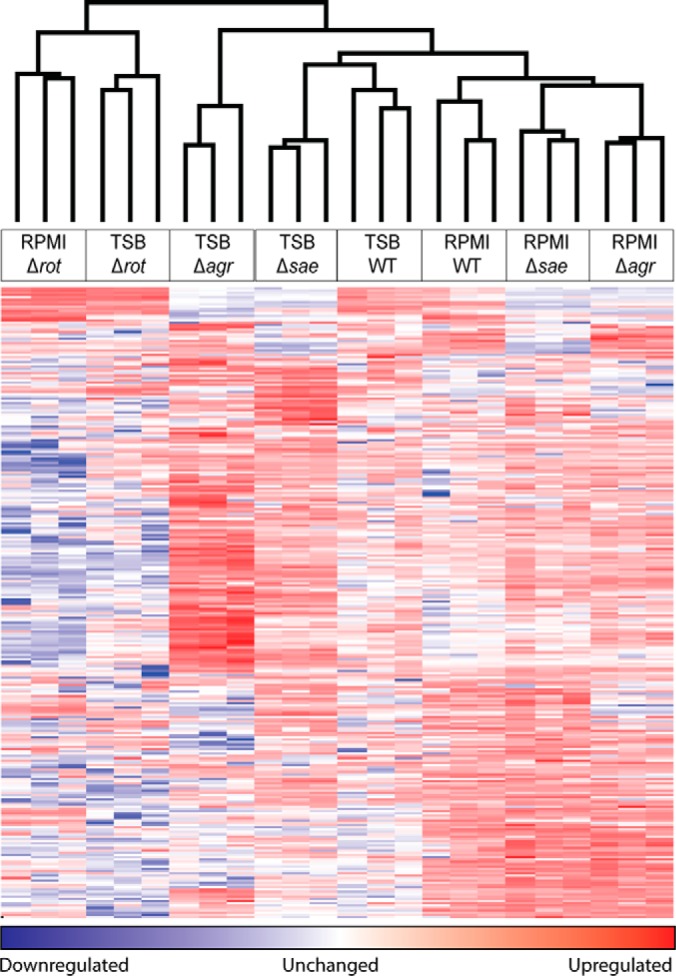
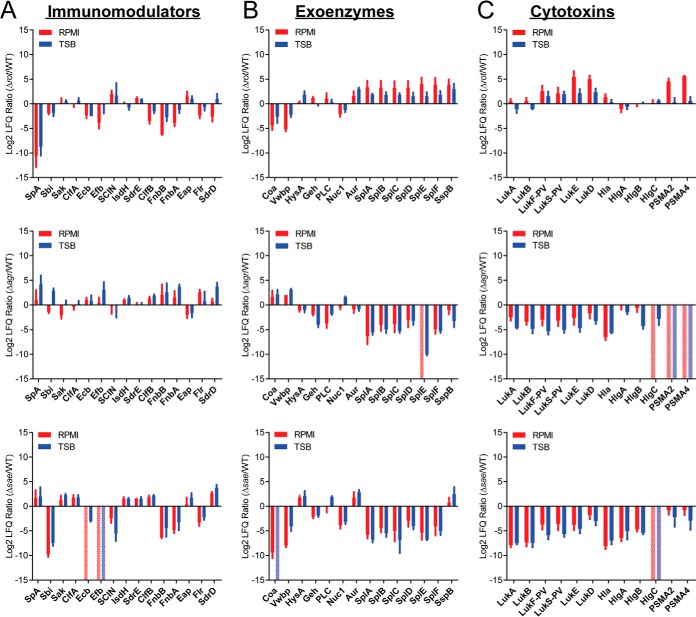
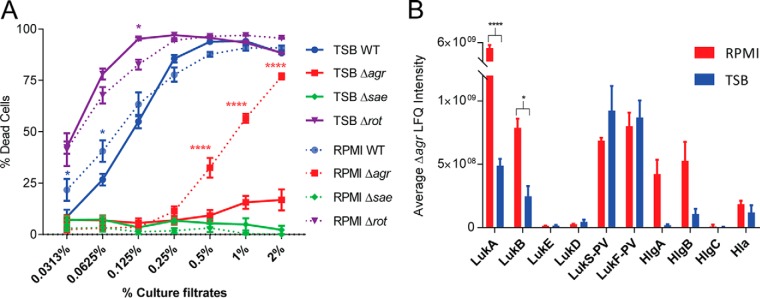
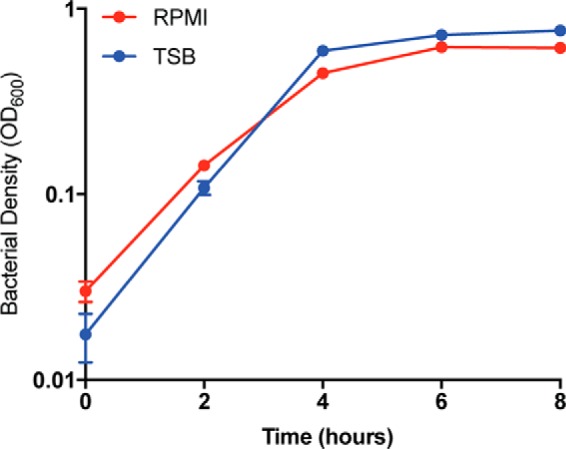
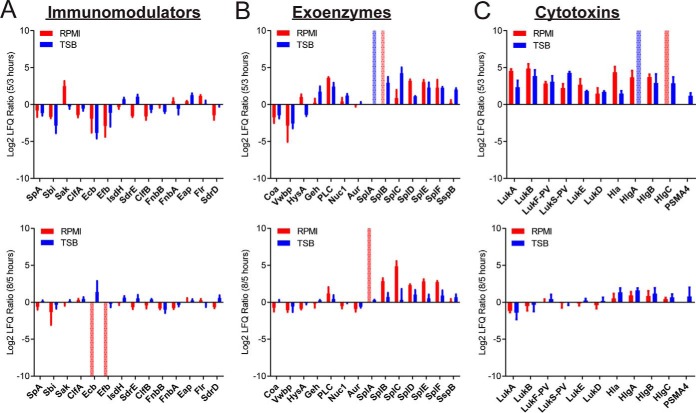
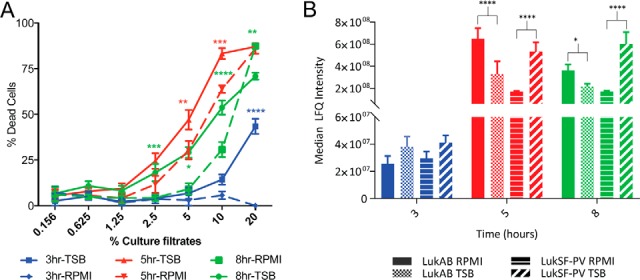
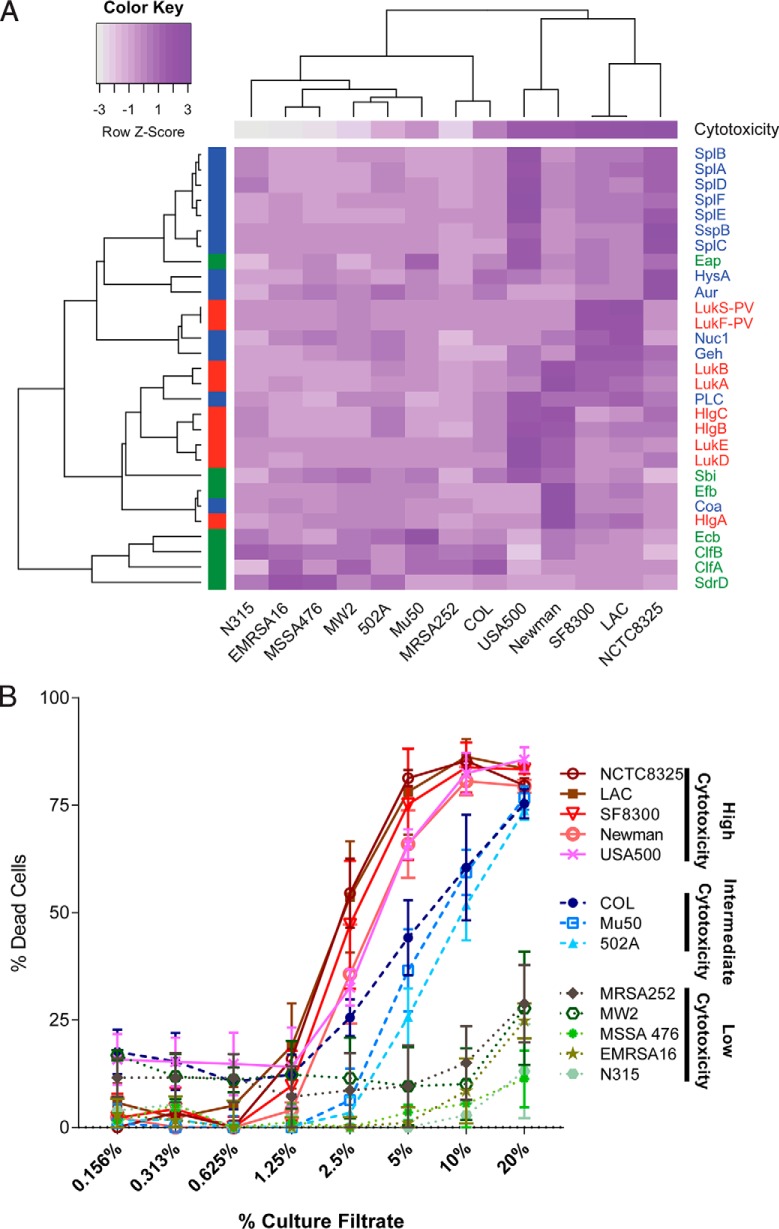
Staphylococcus aureus (Sa) is the leading cause of a variety of bacterial infections ranging from superficial skin infections to invasive and life threatening diseases such as septic bacteremia, necrotizing pneumonia, and endocarditis. The success of Sa as a human pathogen is contributed to its ability to adapt to different environments by changing expression, production, or secretion of virulence factors. Although Sa immune evasion is well-studied, the regulation of virulence factors under different nutrient and growth conditions is still not well understood. Here, we used label-free quantitative mass spectrometry to quantify and compare the Sa exoproteins (i.e. exoproteomes) of master regulator mutants or established reference strains. Different environmental conditions were addressed by growing the bacteria in rich or minimal media at different phases of growth. We observed clear differences in the composition of the exoproteomes depending on the genetic background or growth conditions. The relative abundance of cytotoxins determined in our study correlated well with differences in cytotoxicity measured by lysis of human neutrophils. Our findings demonstrate that label-free quantitative mass spectrometry is a versatile tool for predicting the virulence of bacterial strains and highlights the importance of the experimental design for in vitro studies. Furthermore, the results indicate that label-free proteomics can be used to cluster isolates into groups with similar virulence properties, highlighting the power of label-free quantitative mass spectrometry to distinguish Sa strains.


Figures

Fig. 1.
Fig. 1.
Label-free mass spectrometry quantitation differentiates isogenic Sa mutant exoprotein profiles. A heat map of the protein quantitation data generated using unsupervised clustering is shown. LFQ intensity values were log2 transformed, missing values were imputed from the normal data distribution, and z-scores were calculated. A z-score indicates how many standard deviations a value is from the mean ((z = (X − μ)/σ), X = value, μ = population mean, σ = standard deviation). Unsupervised hierarchical clustering is used to generate a heat map from the z-scores representing protein groups in the matrix as colors. Each row in the heat map is a different protein group and each column is an individual sample. The clustering at the top indicates which samples are most closely related based on the relative intensity of the quantified protein groups. Unsupervised hierarchical clustering confirms that the replicates tightly cluster showing high reproducibility of the workflow.
Fig. 2.
Fig. 2.
The effect of nutrient availability on the exoproteome of Sa master regulator mutants as investigated through the analysis of the levels of secretion of three major classes of virulence factors. The log2 ratio of protein LFQ values from the mutant versus LAC WT are plotted for (A) immunomodulators, (B) exoenzymes, and (C) cytotoxins. Minimal medium (RPMI) values are in red and nutrient rich medium (TSB) are in blue. A positive value indicates the protein is detected at a higher intensity in the mutant than in the LAC WT. A negative value indicates the protein is detected at a higher intensity in the LAC WT than the mutant. All proteins are labeled with the corresponding common protein identifier. Error bars represent the standard deviation of the triplicate analyses. If a protein is only identified in the LAC WT samples the value is set to the minimum of the axis (-15) and if a protein is only identified in the mutant the value is set to the maximum of the axis (+15) and represented by a pale, dotted bar.
Fig. 3.
Fig. 3.
The effect of nutrient availability on the cytotoxicity of mutant Sa. A, Cytotoxicity assay data is plotted for LAC WT and each mutant, where a higher percent of dead cells (hPMNs) indicates greater cytotoxicity. Intoxication of hPMNs from six donors ± the standard error of mean with titration of culture filtrates from the indicated Sa LAC strains grown in rich (TSB) or minimal media (RPMI). Cell death was measured with CellTiter metabolic dye. The culture filtrate from Δagr grown in minimal medium has a cytotoxicity closer to LAC WT, but grown in rich medium the cytotoxicity is drastically reduced. A two-way ANOVA was performed comparing means using Sidak correction for multiple comparisons. Data points with p values less than 0.05 are considered significant and are indicated by the following key: 0.01–0.05 = *, 0.01–0.001 = **, 0.001–0.0001 = ***, and <0.0001 = ****. B, The average LFQ intensity values for the selected cytotoxins are plotted with minimal medium in red and rich medium in blue. Error bars represent the standard deviation of the triplicate analyses. All proteins are labeled with the corresponding protein ID. The intensity of the monomers of the bi-component leukocidin LukAB from Δagr grown in minimal medium is significantly higher than that grown in rich medium. A two-way ANOVA was performed as described above.
Fig. 4.
Fig. 4.
Sa grows to a higher density when grown in a nutrient rich environment. The optical density at 600 nm of four independent colonies of LAC WT grown in both minimal (RPMI) and rich (TSB) media was measured at t = 0, 2, 4, 6, and 8 h. Minimal medium (RPMI) colony density is plotted in red and rich medium (TSB) is plotted in blue. The density of the cultures after 2 h is slightly higher when grown in a nutrient rich environment.
Fig. 5.
Fig. 5.
The effect of nutrient availability and culture density on the exoproteome as investigated through the analysis of three major classes of virulence factors. The log2 ratio LFQ intensities of exoproteins from LAC WT at two time points (5/3 and 5/8 h) are plotted for (A) immunomodulators, (B) exoenzymes, and (C) cytotoxins. Minimal medium (RPMI) values are in red and nutrient rich medium (TSB) are in blue. A positive value indicates the protein is detected at a higher intensity in the later time point. A negative value indicates the protein is detected at a higher intensity in the earlier time point. All proteins are labeled with the common protein ID. Error bars represent the standard deviation of the triplicate analyses. If a protein is only identified at one time point the value is set to the maximum or minimum of the axis (± 10) and represented by a pale, dotted bar.
Fig. 6.
Fig. 6.
The effect of nutrient availability and culture density on the cytotoxicity of Sa. A, Cytotoxicity assay data is plotted for LAC WT grown in both environments at the three time points. A higher percent of dead cells (hPMNs) indicates greater cytotoxicity. Intoxication of hPMNs (from six donors ± the standard error of mean) with a titration of culture filtrates from LAC WT grown in rich (TSB) or minimal media (RPMI) is shown. Cell death was measured with CellTiter metabolic dye. There is a statistically significant increase in the cytotoxicity of the bacteria grown in rich medium as compared with those grown in minimal medium. A two-way ANOVA was performed comparing means using Sidak correction for multiple comparisons. Data points with p values less than 0.05 are considered significant and are indicated by the following key: 0.01–0.05 = *, 0.01–0.001 = **, 0.001–0.0001 = ***, and <0.0001 = ****. B, The median LFQ intensities of the bi-component leukocidins are plotted at log phase (3 h - blue), early stationary phase (5 h - red), and late stationary phase (8 h - green). Bars representing LukAB from Sa grown in minimal medium are solid, LukSF-PV are lined, and bars representing LukAB from Sa grown in rich medium are checkered, LukSF-PV are slashed. The level of LukSF-PV plateaus at stationary phase, but LukAB is levels are highest during early stationary phase and decrease in late stationary phase. Interestingly, at both early and late stationary phase LukAB is more abundant than LukSF-PV when Sa is grown in minimal medium, but the reverse is true when Sa is grown in a nutrient rich environment. A two-way ANOVA was performed as described above.
Fig. 7.
Fig. 7.
The effect of clonal lineages on the exoprotein production by a group of diverse Sa reference strains. A, Heat map of protein quantitation data for the selected virulence factors. The color scheme represents a row-based z-score on a scale from dark purple (most PSMs) to white (fewest PSMs). The protein class is designated by color on the left y axis and the common protein IDs are labeled on the right y axis. Immunomodulators are indicated in green, exoenzymes in blue, and cytotoxins in red. The strain names are indicated along the bottom x axis. The average cytotoxicity using the 5% dilution of the culture filtrate is shown for each strain at the top of the heat map. The same color scheme is used as for the protein data (i.e. the cytotoxicity data was also transformed to z-scores; dark purple (most cytotoxic) to white (least cytotoxic)). The expression of orthologues was compared across the reference strains using LAC as the pivot-strain. The reciprocal best blast hits for every selected virulence factor in each reference strain were determined, peptide intensities for all ortho-conserved and ortho-unique PSMs were summed, results were log10 transformed and z-scores were calculated. The resulting data was clustered using complete linkage agglomerative clustering and 1-r as the distance measure, where r is defined as the Pearson correlation. B, The cytotoxicities of all 13 reference strains is plotted. A higher percent of dead cells (hPMNs) indicates greater cytotoxicity. Intoxication of hPMNs (from three donors ± the standard error of mean) with a titration of culture filtrates from the reference strains. Cell death was measured with CellTiter metabolic dye. The CC8 strains are the most cytotoxic strains, CC5 strains are moderately cytotoxic, and the CC1 and CC30 strains have low cytotoxicity.

References

    1. Diekema D. J., Pfaller M. A., Schmitz F. J., Smayevsky J., Bell J., Jones R. N., Beach M., and Group S. P. (2001) Survey of infections because of Staphylococcus species: frequency of occurrence and antimicrobial susceptibility of isolates collected in the United States, Canada, Latin America, Europe, and the Western Pacific region for the SENTRY Antimicrobial Surveillance Program, 1997–1999. Clin. Infect. Dis. 32, S114–S132 - PubMed
    1. Kluytmans J., van Belkum A., and Verbrugh H. (1997) Nasal carriage of Staphylococcus aureus: epidemiology, underlying mechanisms, and associated risks. Clin. Microbiol. Rev. 10, 505–520 - PMC - PubMed
    1. David M. Z., and Daum R. S. (2010) Community-associated methicillin-resistant Staphylococcus aureus: epidemiology and clinical consequences of an emerging epidemic. Clin. Microbiol. Rev. 23, 616–687 - PMC - PubMed
    1. Tong S. Y., Davis J. S., Eichenberger E., Holland T. L., and Fowler V. G. Jr. (2015) Staphylococcus aureus infections: epidemiology, pathophysiology, clinical manifestations, and management. Clin. Microbiol. Rev. 28, 603–661 - PMC - PubMed
    1. Thurlow L. R., Joshi G. S., and Richardson A. R. (2012) Virulence strategies of the dominant USA300 lineage of community-associated methicillin-resistant Staphylococcus aureus (CA-MRSA). FEMS Immunol. Med. Microbiol. 65, 5–22 - PMC - PubMed

Publication types

MeSH terms

LinkOut - more resources