. 2017 Feb 28;114(9):E1737-E1744.
doi: 10.1073/pnas.1616866114. Epub 2017 Feb 14.

Hemoglobin phase of oxygenation and deoxygenation in early brain development measured using fNIRS

Affiliations

Hemoglobin phase of oxygenation and deoxygenation in early brain development measured using fNIRS

Hama Watanabe et al. Proc Natl Acad Sci U S A. .

Abstract

A crucial issue in neonatal medicine is the impact of preterm birth on the developmental trajectory of the brain. Although a growing number of studies have shown alterations in the structure and function of the brain in preterm-born infants, we propose a method to detect subtle differences in neurovascular and metabolic functions in neonates and infants. Functional near-infrared spectroscopy (fNIRS) was used to obtain time-averaged phase differences between spontaneous low-frequency (less than 0.1 Hz) oscillatory changes in oxygenated hemoglobin (oxy-Hb) and those in deoxygenated hemoglobin (deoxy-Hb). This phase difference was referred to as hemoglobin phase of oxygenation and deoxygenation (hPod) in the cerebral tissue of sleeping neonates and infants. We examined hPod in term, late preterm, and early preterm infants with no evidence of clinical issues and found that all groups of infants showed developmental changes in the values of hPod from an in-phase to an antiphase pattern. Comparison of hPod among the groups revealed that developmental changes in hPod in early preterm infants precede those in late preterm and term infants at term equivalent age but then, progress at a slower pace. This study suggests that hPod measured using fNIRS is sensitive to the developmental stage of the integration of circular, neurovascular, and metabolic functions in the brains of neonates and infants.

Keywords: Hb; fNIRS; infant; neurovascular; preterm.


Conflict of interest statement

The authors declare no conflict of interest.

Figures
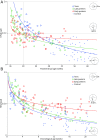
Fig. 1.
Fig. 1.
Development of hPod in different groups of infants classified by GA. (A) Individual values of hPod (rad) viewed as a function of PMA (weeks). (B) Individual values of hPod (rad) viewed as a function of CA (weeks). hPod values of 2π and π correspond to in-phase and antiphase changes in the oxy- and deoxy-Hb signals, respectively. Blue, green, and red circles indicate the data for term, late preterm, and early preterm infants, respectively, and + indicates the data for control infants. Logarithmic trend lines fitted to data from the combined term plus control, late preterm, and early preterm infants are shown using blue, green, and red lines, respectively.
Fig. 2.
Fig. 2.
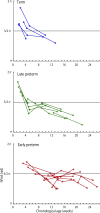
Longitudinal development of hPod values (rad) from individual infants as a function of CA (weeks). The hPod values (rad) that were repeatedly measured within the same infant are connected with lines. Top, Middle, and Bottom show the data from term, late preterm, and early preterm infants, respectively.
Fig. 3.
Fig. 3.
Developmental changes in hPod values during the neonatal period. Vector representations of individual and averaged hPod values (black and colored arrows, respectively) during three measurement periods (34–36, 37–39, and 40–43 wk PMA) are shown for each infant group (term, late preterm, and early preterm).
Fig. 4.
Fig. 4.
Developmental changes in hPod values during the first one-half of the first year after birth. Vector representations of individual and averaged values (black and colored arrows, respectively) during three measurement periods (0–7, 8–13, and 14–21 wk CA) are shown for each infant group (term plus control referred to as term, late preterm, and early preterm).
Fig. S1.
Fig. S1.
hPod of adults in resting state. Vector representations of individual and averaged hPod values (black and red arrows, respectively) are shown. (A) The result using 0.05–0.1 Hz (main frequency) and (B) the results using 0.01–0.05 Hz (lower frequency) and 0.1–5.0 Hz (higher frequency) are shown.
Fig. 5.
Fig. 5.
Possible contributions of hemodynamic and metabolic variables to development of hPod. ΔVbv, ΔPO2, ΔαO˙2, and Δc indicate changes in partial blood volume, partial pressure of oxygen, oxygen utilization rate, and speed of blood flow, respectively. Upward and downward arrows mean contributions to in-phase and antiphase patterns, respectively. Solid and dotted lines are identical to the fitted curves of term plus control and early preterm infants, respectively, in Fig. 1B.
Fig. S2.
Fig. S2.
hPod values in lower frequency (0.01–0.05 Hz). A and B show the data obtained during the neonatal period and the first one-half of the first year after birth, respectively. Vector representations of individual and averaged hPod values (black and colored arrows, respectively) during three measurement periods (34–36, 37–39, and 40–43 wk PMA) are shown for each infant group (term, late preterm, and early preterm).
Fig. S3.
Fig. S3.
hPod values in higher frequency (0.1–5.0 Hz). A and B show the data obtained during the neonatal period and the first one-half of the first year after birth, respectively. Vector representations of individual and averaged hPod values (black and colored arrows, respectively) during three measurement periods (0–7, 8–13, and 14–21 wk CA) are shown for each infant group (term plus control referred to as term, late preterm, and early preterm).
Fig. S4.
Fig. S4.
SO2 curve of Hb. Fetal and adult curves are shown by red and green lines, respectively.
Fig. S5.
Fig. S5.
Contribution of ΔPO2 and ΔVbv vs. ΔαO˙2 and Δc in the capillary compartment to Hb concentration changes. Values of q1(c) and q2(c) as a function of αO˙2Lbv(c)/c(c) are shown by red and green lines, respectively; q1(c) represents the contribution of ΔPO2 and ΔVbv, and q2(c) represents the contribution of ΔαO˙2 and Δc.
Fig. S6.
Fig. S6.
Contribution of ΔPO2 vs. ΔVbv. (A) Values of r1(i) and r2(i) as a function of PO2 are shown by red and green lines, respectively. K = 20 was a constant parameter. (BD) Values of r1(i) and r2(i) as a function of K are shown by red and green lines, respectively. PO2 was a constant parameter: (B) PO2 = 40 mmHg, (C) PO2 = 70 mmHg, and (D) PO2 = 100 mmHg; n = 2.5 was a constant parameter in all calculations.

References

    1. Volpe JJ. Brain injury in premature infants: A complex amalgam of destructive and developmental disturbances. Lancet Neurol. 2009;8(1):110–124. - PMC - PubMed
    1. Inder TE, Warfield SK, Wang H, Hüppi PS, Volpe JJ. Abnormal cerebral structure is present at term in premature infants. Pediatrics. 2005;115(2):286–294. - PubMed
    1. Ball G, et al. The effect of preterm birth on thalamic and cortical development. Cereb Cortex. 2012;22(5):1016–1024. - PMC - PubMed
    1. Zhang Y, et al. Cortical structural abnormalities in very preterm children at 7 years of age. Neuroimage. 2015;109:469–479. - PMC - PubMed
    1. Fischi-Gómez E, et al. Structural brain connectivity in school-age preterm infants provides evidence for impaired networks relevant for higher order cognitive skills and social cognition. Cereb Cortex. 2015;25(9):2793–2805. - PubMed

Publication types