. 2017 Jan 31:10:24.
doi: 10.3389/fnmol.2017.00024. eCollection 2017.

Redundant Postsynaptic Functions of SynCAMs 1-3 during Synapse Formation

Affiliations

Redundant Postsynaptic Functions of SynCAMs 1-3 during Synapse Formation

Daniel K Fowler et al. Front Mol Neurosci. .

Abstract

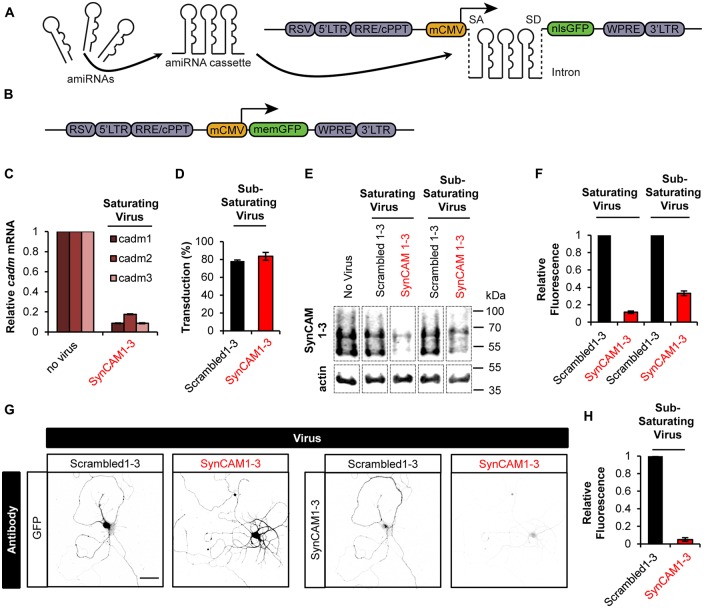
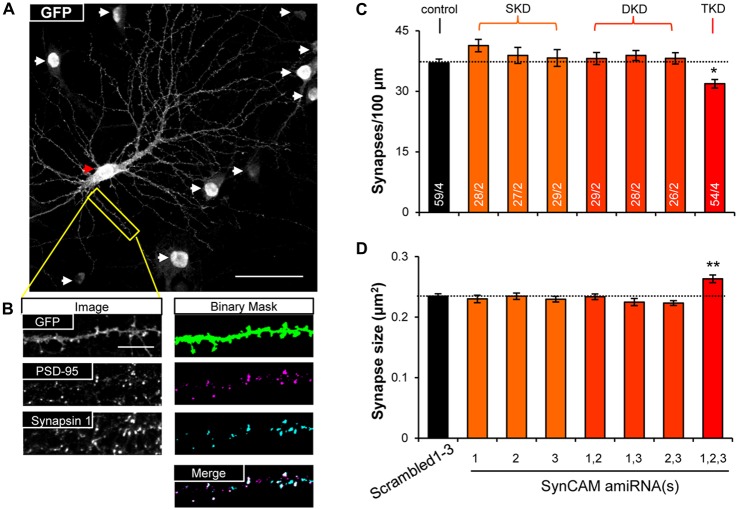
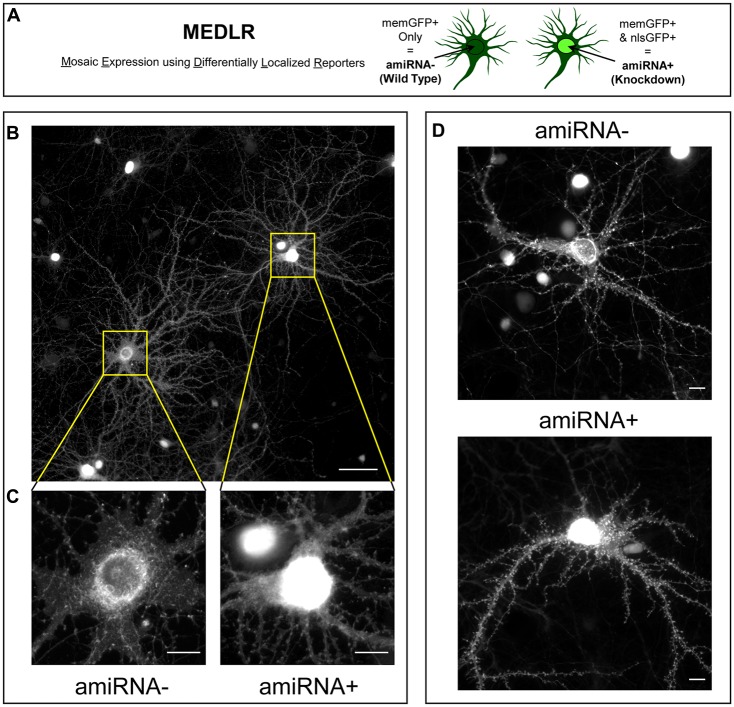
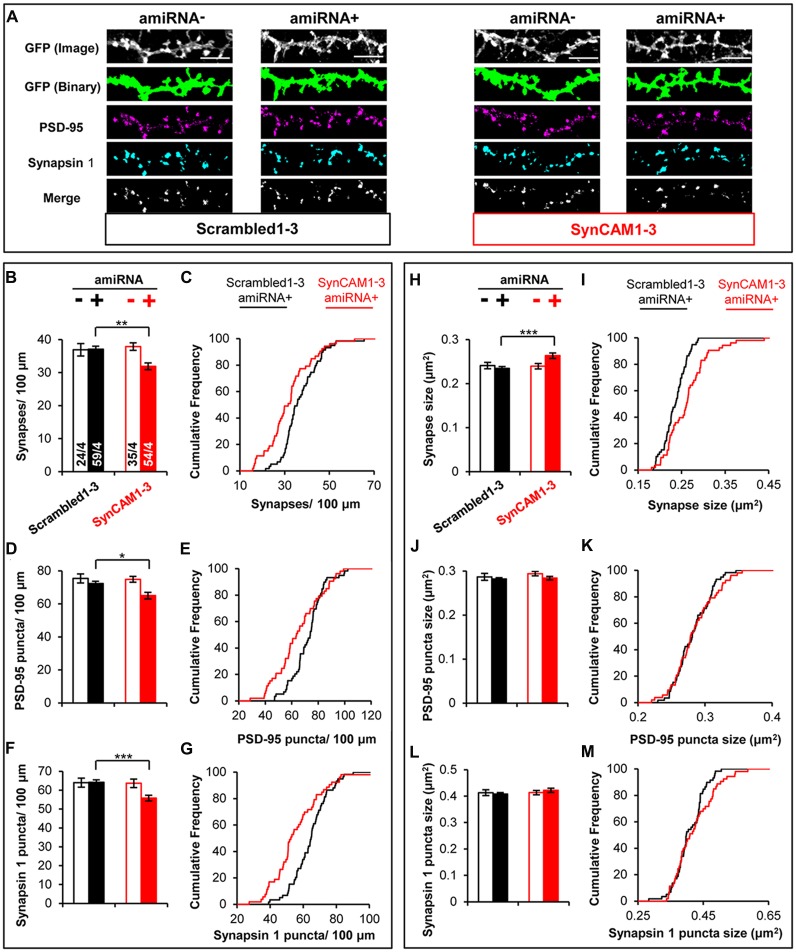
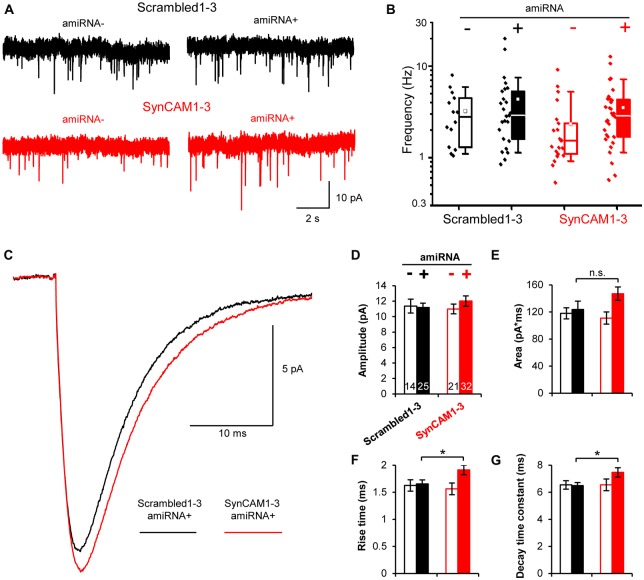
Investigating the roles of synaptogenic adhesion molecules during synapse formation has proven challenging, often due to compensatory functions between additional family members. The synaptic cell adhesion molecules 1-3 (SynCAM1-3) are expressed both pre- and postsynaptically, share highly homologous domains and are synaptogenic when ectopically presented to neurons; yet their endogenous functions during synaptogenesis are unclear. Here we report that SynCAM1-3 are functionally redundant and collectively necessary for synapse formation in cultured hippocampal neurons. Only triple knockdown (KD) of SynCAM1-3 using highly efficient, chained artificial microRNAs (amiRNAs) reduced synapse density and increased synapse area. Electrophysiological recordings of quantal release events supported an increase in synapse size caused by SynCAM1-3 depletion. Furthermore, a combinatorial, mosaic lentiviral approach comparing wild type (WT) and SynCAM1-3 KD neurons in the same culture demonstrate that SynCAM1-3 set synapse number and size through postsynaptic mechanisms. The results demonstrate that the redundancy between SynCAM1-3 has concealed their synaptogenic function at the postsynaptic terminal.

Keywords: SynCAM; adhesion; artificial miRNA; hippocampus; knockdown; mosaic; redundancy; synapse formation.


Figures

Figure 1
Figure 1
Sub-saturating lentiviral artificial microRNA (amiRNA) transduction potently knocks down synaptic cell adhesion molecules 1–3 (SynCAM1–3) in amiRNA+ cells while keeping a subpopulation of wild type (WT) amiRNA- cells. (A) Lentiviral knockdown (KD) vectors were generated with a minimal CMV (mCMV) promoter, intronic amiRNAs, and nlsGFP. RSV, Rous sarcoma virus promoter; LTR, long-terminal repeat; RRE, Rev-response element; cPPT, central polypurine tract; WPRE, woodchuck hepatitis virus posttranscriptional regulatory element; SA, splice acceptor; SD, splice donor. (B) memGFP-expressing lentiviral vector for dendrite labeling. (C) Comparison of cadm1–3 mRNA levels at 14–15 days in vitro (DIV) by quantitative reverse transcription polymerase chain reaction (qRT-PCR) in cultured rat hippocampal neurons using saturating viral titers relative to levels in uninfected control cultures. n = 2 experiments. (D) Transduction rate of cultured neurons at 14–15 DIV using sub-saturating viral titers. n = 2 experiments. (E) Representative blots and (F) relative SynCAM1–3 protein levels at 13–15 DIV measured by quantitative western blotting of cultured neurons following indicated amiRNA lentiviral treatments at saturating or sub-saturating viral titers compared to Scrambled1–3 amiRNA control treatments. Actin was used as a loading control. n = 4 (saturating) or n = 2 (sub-saturating) experiments. A single gel image of the same intensity was cropped as marked by dotted lines and rearranged for presentation. (G) Representative images and (H) quantification of relative SynCAM1–3 immunofluorescence at 14 DIV of individual neurons cultured at low density normalized to immunofluorescent intensity of control Scrambled 1–3 amiRNA treated neurons. Scale, 50 μm. Scrambled1–3 condition n = 13 cells/2 coverslips, SynCAM1–3 condition n = 20 cells/2 coverslips. Error bars, SEM.
Figure 2
Figure 2
SynCAM1–3 function redundantly to set synapse density and size. (A) Representative 60× confocal microscopy image of cultured rat hippocampal neurons at 14 DIV treated with sub-saturating lentivirus carrying Scrambled1–3 amiRNAs linked to nlsGFP, and very low titer memGFP lentivirus. An individual pyramidal cell co-labeled by memGFP and nlsGFP is marked by a red arrowhead. White arrowheads mark nuclei in the field of view only expressing nlsGFP. Scale, 50 μm. (B) Sample images of automated puncta and synapse detection from co-immunostaining for presynaptic protein Synapsin 1 and postsynaptic protein PSD-95 following manual selection of an individual dendrite segment from the image in (A). Synapses are defined as the co-localized regions of pre- and postsynaptic puncta (white areas in merged image). Scale, 10 μm. (C) Average synapse density and (D) average synapse puncta area from 13 to 15 DIV neurons co-transduced with memGFP and sub-saturating amounts of the SynCAM amiRNAs listed or control Scrambled1–3 amiRNAs. n = cells/isolations is listed on the bars. SKD, single knockdown; DKD, double knockdown; TKD, triple knockdown. *p < 0.05, **p < 0.01, one-way analyses of variance (ANOVA) with Tukey’s post hoc pairwise comparisons on cell average values. Error bars, SEM.
Figure 3
Figure 3
Mosaic Expression using Differentially Localized Reporters (MEDLR) is a novel method to compare WT and KD neurons on the same coverslip. (A) MEDLR uses combinatorial lentiviral transgenesis with memGFP lentivirus and nlsGFP-linked amiRNA lentivirus to compare WT and KD cells. (B) Representative immunolabled GFP images at 20× or (C) 60× magnification of memGFP-labled amiRNA− and amiRNA+ neurons at 15 DIV in cultures transduced with sub-saturating amounts of Scrambled1-3 amiRNAs. (D) Representative 40× images of live GFP fluorescence in 15 DIV amiRNA− and amiRNA+ neurons. (B–D) Note the perisynaptic memGFP accumulation that could potentially be misinterpreted as nlsGFP in amiRNA− cells. (B) Scale, 50 μm; (C,D) Scale, 10 μm.
Figure 4
Figure 4
MEDLR shows synaptic phenotypes are due to postsynaptic SynCAM1–3 depletion. (A) Representative images of memGFP-labled basal dendrites from amiRNA− and amiRNA+ neurons at 15 DIV in cultures transduced with sub-saturating amounts of Scrambled1–3 or SynCAM1–3 amiRNAs. Automated puncta detection for PSD-95 and Synapsin 1 immunostaining and synapses (merge) was performed after manual selection of GFP masks. Scale, 5 μm. (B,D,F) Average dendritic puncta density as indicated on graph of amiRNA− and amiRNA+ neurons and (C,E,G) corresponding cumulative puncta density distribution plot (%) of amiRNA+ neurons from cultures transduced with Scrambled1–3 or SynCAM1–3 amiRNAs. (H,J,L) Average puncta area as indicated on graph of amiRNA− and amiRNA+ neurons and (I,K,M) corresponding cumulative puncta area distribution plot (%) of amiRNA+ neurons from cultures transduced with Scrambled1–3 or SynCAM1–3 amiRNAs. n = number of cells/isolations as indicated on bars from 13 to 15 DIV cultures. *p < 0.05, **p < 0.01, ***p < 0.001, t test on cell average values. Cumulative distribution plots represent cell average values. Error bars, SEM.
Figure 5
Figure 5
Postsynaptic SynCAM1–3 loss does not alter miniature excitatory postsynaptic current (mEPSC) frequency but broadens mEPSC events. (A) Representative whole-cell patch clamp mEPSC traces of amiRNA− and amiRNA+ neurons from cultures treated with sub-saturating amounts of Scrambled1–3 or SynCAM1–3 amiRNAs. (B) Box and whisker plot of mEPSC frequencies with individual data points plotted to left of boxes. Box = 25–75%, whiskers = 10–90%, line = median, square = mean. (C) Average mEPSC event traces for amiRNA+ cells in cultures transduced with Scrambled1–3 or SynCAM1–3 amiRNAs. (D–G) Average mEPSC measurements as indicated on graph for amiRNA− and amiRNA+ cells in cultures transduced with Scrambled1–3 or SynCAM1–3 amiRNAs. (B–G) n = number of cells as indicated on bars in (D) from three isolations recorded at 13–16 DIV. *p < 0.05, n.s., not significant, t test between Scrambled1–3 and SynCAM1–3 amiRNA+ conditions using cell average values. Error bars, SEM.

Similar articles

Cited by

References

    1. Arase N., Takeuchi A., Unno M., Hirano S., Yokosuka T., Arase H., et al. . (2005). Heterotypic interaction of CRTAM with Necl2 induces cell adhesion on activated NK cells and CD8+ T cells. Int. Immunol. 17, 1227–1237. 10.1093/intimm/dxh299 - DOI - PubMed
    1. Biederer T. (2006). Bioinformatic characterization of the SynCAM family of immunoglobulin-like domain-containing adhesion molecules. Genomics 87, 139–150. 10.1016/j.ygeno.2005.08.017 - DOI - PubMed
    1. Biederer T., Sara Y., Mozhayeva M., Atasoy D., Liu X., Kavalali E. T., et al. . (2002). SynCAM, a synaptic adhesion molecule that drives synapse assembly. Science 297, 1525–1531. 10.1126/science.1072356 - DOI - PubMed
    1. Boles K. S., Barchet W., Diacovo T., Cella M., Colonna M. (2005). The tumor suppressor TSLC1/NECL-2 triggers NK-cell and CD8+ T-cell responses through the cell-surface receptor CRTAM. Blood 106, 779–786. 10.1182/blood-2005-02-0817 - DOI - PubMed
    1. Breillat C., Thoumine O., Choquet D. (2007). Characterization of SynCAM surface trafficking using a SynCAM derived ligand with high homophilic binding affinity. Biochem. Biophys. Res. Commun. 359, 655–659. 10.1016/j.bbrc.2007.05.152 - DOI - PubMed

LinkOut - more resources