. 2017 Jan 31:9:8.
doi: 10.3389/fnagi.2017.00008. eCollection 2017.

Increase of TREM2 during Aging of an Alzheimer's Disease Mouse Model Is Paralleled by Microglial Activation and Amyloidosis

Affiliations

Increase of TREM2 during Aging of an Alzheimer's Disease Mouse Model Is Paralleled by Microglial Activation and Amyloidosis

Matthias Brendel et al. Front Aging Neurosci. .

Abstract

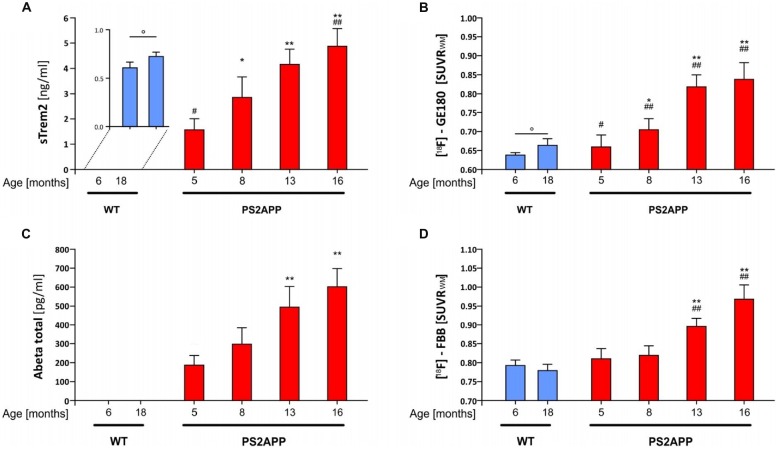
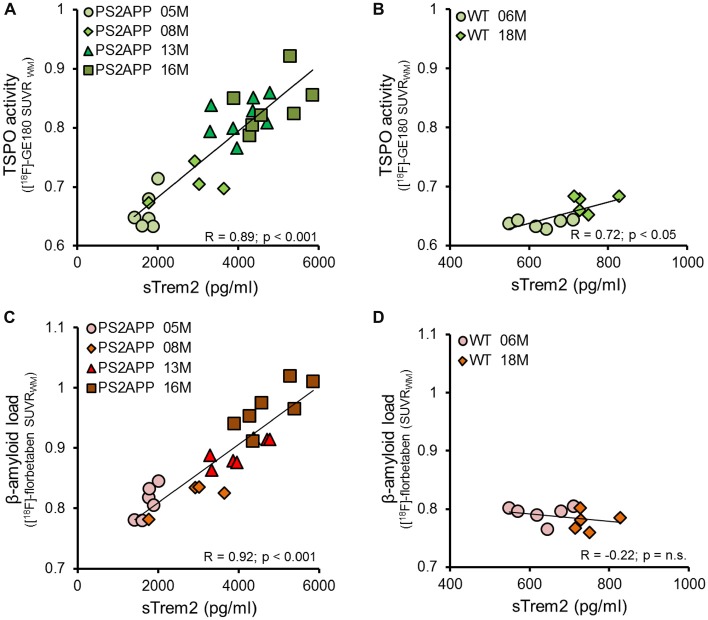
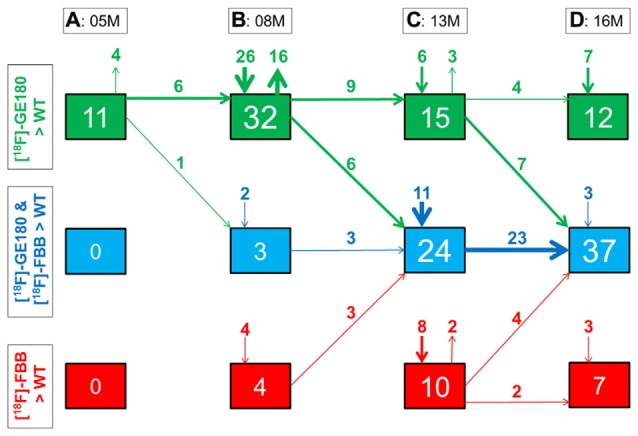
Heterozygous missense mutations in the triggering receptor expressed on myeloid cells 2 (TREM2) have been reported to significantly increase the risk of developing Alzheimer's disease (AD). Since TREM2 is specifically expressed by microglia in the brain, we hypothesized that soluble TREM2 (sTREM2) levels may increase together with in vivo biomarkers of microglial activity and amyloidosis in an AD mouse model as assessed by small animal positron-emission-tomography (μPET). In this cross-sectional study, we examined a strong amyloid mouse model (PS2APP) of four age groups by μPET with [18F]-GE180 (glial activation) and [18F]-florbetaben (amyloidosis), followed by measurement of sTREM2 levels and amyloid levels in the brain. Pathology affected brain regions were compared between tracers (dice similarity coefficients) and pseudo-longitudinally. μPET results of both tracers were correlated with terminal TREM2 levels. The brain sTREM2 levels strongly increased with age of PS2APP mice (5 vs. 16 months: +211%, p < 0.001), and correlated highly with μPET signals of microglial activity (R = 0.89, p < 0.001) and amyloidosis (R = 0.92, p < 0.001). Dual μPET enabled regional mapping of glial activation and amyloidosis in the mouse brain, which progressed concertedly leading to a high overlap in aged PS2APP mice (dice similarity 67%). Together, these results substantiate the use of in vivo μPET measurements in conjunction with post mortem sTREM2 in future anti-inflammatory treatment trials. Taking human data into account sTREM2 may increase during active amyloid deposition.

Keywords: Alzheimer’s disease; TREM2; TSPO-PET; amyloid-PET; neuroinflammation.


Figures

Figure 1
Figure 1
Soluble triggering receptor expressed on myeloid cells 2 (sTREM2) increases in an age dependent manner in brains of PS2APP mice. (A) Post mortem levels of sTREM2 were quantified by ELISA from forebrain tissue at indicated time-points (n = 4–8 mice per group). (B) Forebrain in vivo glial activation assessed by 18-kDA translocator protein (TSPO) [18F]-GE180 μPET is presented as standard-uptake-value-ratios (SUVR) relative to white matter reference tissue uptake (n = 8 mice per group). (C) Post mortem levels of total β-amyloid peptide (Aβ) were quantified by ELISA from forebrain tissue at indicated time-points (n = 4–8 mice per group). (D) Forebrain in vivo amyloidosis assessed by [18F]-florbetaben μPET is presented as SUVR relative to white matter reference tissue uptake (n = 8 mice per group). Data information: in (A–D), data are presented as mean ± SD. *significant differences in PS2APP mice vs. their 5 month old littermates (*p < 0.05; **p < 0.001); #significant differences in PS2APP mice vs. age-matched wild-type (WT; #p < 0.05; ##p < 0.001); °significant differences between young and aged WT (°p < 0.05). Analysis of variance (ANOVA) with Tukey post hoc applies for all. Please note that data of (B,D) were partially previously published (Brendel et al., 2016).
Figure 2
Figure 2
Standardized differences for biochemical and imaging modalities during the life course of PS2APP mice. Data information: standardized differences between PS2APP and WT mice were computed by the delta divided by the standard deviation for all assessment points in PS2APP. The development of measures in WT was assumed linear when no direct comparison time-point was available.
Figure 3
Figure 3
sTREM2 levels strongly correlate with dual tracer μPET in vivo measurements of TSPO and amyloidosis. (A,B) Correlation of post mortem levels of sTREM2 in the forebrain with in vivo TSPO [18F]-GE180 μPET measurements in PS2APP and WT mice. (C,D) Correlation of post mortem levels of sTREM2 in the forebrain with in vivo amyloid [18F]-florbetaben μPET measurements in PS2APP and WT mice. Data information: for all data Pearson’s coefficient of correlation (R) was calculated together with the significance level using SPSS.
Figure 4
Figure 4
Glial activation and fibrillar amyloidosis progress regionally concerted during the life-cycle of PS2APP mice. (A–D) Voxel-wise regional distribution of elevated in vivo radiotracer uptake in PS2APP mice compared to WT at all four different age stages. Increases in TSPO [18F]-GE180 μPET binding, indicating glial activation (green), increases in amyloid [18F]-florbetaben μPET binding (red), and areas of overlapping increases for both radiotracers (blue) are projected upon sagittal slices of an MRI mouse atlas. Data information: in (A–D) all voxels of the mouse brain were compared by a student’s t-test in SPM. All significant differences exceeding a threshold of p < 0.05, including FDR-correction for multiple comparisons were binarized for each tracer.
Figure 5
Figure 5
Immunohistochemistry confirms μPET findings. (A–D) Immunohistochemistry in the frontal cortex of PS2APP and WT mice at different ages. TSPO staining is depicted in green. IBA-1 positive cells are illustrated in red. Fibrillar Aβ plaques stained by methoxy-X04 are shown in blue. Scale bar in (A) indicates 100 μm. (E,F) Immunohistochemistry in the frontal cortex of WT mice at different ages. TSPO staining is depicted in green. IBA-1 positive cells are illustrated in red. Please note that anti-TSPO recognizes an antigen in blood vessels a phenomenon that is well described in the literature. Therefore a higher zoom was used for a proper visualization of increasing IBA-1 positive microglia in aged WT. Scale bar in (E) indicates 20 μm.
Figure 6
Figure 6
Quantitative progression of glial activation and fibrillar amyloidosis during the life-cycle of PS2APP mice. (A–D) Percentage (%) of brain voxels relative to the whole brain in which binding of either [18F]-GE180 (green) or [18F]-florbetaben (FBB, red) or both tracers (blue) in groups of PS2APP mice exceeded that in WT mice at 5, 8, 13 or 16 months of age. Data information: arrows between boxes indicate the propagation of changing volume percentages for the two markers between groups of increasing age. Inward and outward arrows indicate the amount volume percentage of newly presenting/disappearing voxels for the markers at each specific age group. Thin arrows indicate 1–5% volume changes, medium arrows 5–10% changes, and thick arrow show changes exceeding 10% volumes. In (A–D) all voxels of the mouse brain were compared by a student’s t-test in statistical parametric mapping (SPM). All significant differences exceeding a threshold of p < 0.05, including FDR-correction for multiple comparisons were binarized for each tracer.

References

    1. Bateman R. J., Xiong C., Benzinger T. L., Fagan A. M., Goate A., Fox N. C., et al. . (2012). Clinical and biomarker changes in dominantly inherited Alzheimer’s disease. N. Engl. J. Med. 367, 795–804. 10.1056/NEJMoa1202753 - DOI - PMC - PubMed
    1. Birch A. M., Katsouri L., Sastre M. (2014). Modulation of inflammation in transgenic models of Alzheimer’s disease. J. Neuroinflammation 11:25. 10.1186/1742-2094-11-25 - DOI - PMC - PubMed
    1. Brendel M., Högenauer M., Delker A., Sauerbeck J., Bartenstein P., Seibyl J., et al. . (2015a). Improved longitudinal [18F]-AV45 amyloid PET by white matter reference and VOI-based partial volume effect correction. Neuroimage 108, 450–459. 10.1016/j.neuroimage.2014.11.055 - DOI - PubMed
    1. Brendel M., Jaworska A., Grießinger E., Rötzer C., Burgold S., Gildehaus F. J., et al. . (2015b). Cross-sectional comparison of small animal [18F]-florbetaben amyloid-PET between transgenic AD mouse models. PLoS One 10:e0116678. 10.1371/journal.pone.0116678 - DOI - PMC - PubMed
    1. Brendel M., Jaworska A., Herms J., Trambauer J., Rotzer C., Gildehaus F. J., et al. . (2015c). Amyloid-PET predicts inhibition of de novo plaque formation upon chronic γ-secretase modulator treatment. Mol. Psychiatry 20, 1179–1187. 10.1038/mp.2015.74 - DOI - PMC - PubMed

LinkOut - more resources