Therapeutic Effects of Fermented Flax Seed Oil on NC/Nga Mice with Atopic Dermatitis-Like Skin Lesions
- PMID: 28197211
- PMCID: PMC5288556
- DOI: 10.1155/2017/5469125
Therapeutic Effects of Fermented Flax Seed Oil on NC/Nga Mice with Atopic Dermatitis-Like Skin Lesions
Abstract
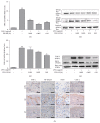
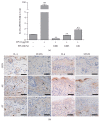
Background. Atopic Dermatitis (AD) is one of the most common chronic inflammatory skin diseases. Objective. This experiment aimed to study the effects of Fermented Flax Seed Oil (FFSO) on symptoms such as redness, eczema, and pruritus induced by AD. Materials and Methods. AD-induced NC/Nga mice were used to observe the immunological and therapeutic effects of FFSO on skin in vivo. Raw 264.7 cells were used to investigate the effects of FFSO in cells. Fc receptor expression and concentration of beta-hexosaminidase were measured. Nitric oxide assay, Western blotting, real-time PCR, image analysis, and statistical analysis were performed in vitro. Results. In the immunohistochemical results, p-ERK 1/2 expression decreased, fibrogenesis strongly increased, and distribution reduction is observed. Distribution of IL-4-positive cells in the corium near the basal portion of the epithelium in the AT group was reduced. FFSO treatment reduced the number of cells showing NF-κB p65 and iNOS expression. The level of LXR in the AT group was higher than that in the AE group, and elevation of PKC expression was significantly reduced by FFSO treatment. Conclusion. FFSO could alleviate symptoms of AD such as epithelial damage, redness, swelling, and pruritus.
Conflict of interest statement
The authors declare that there is no conflict of interests regarding the publication of this paper.
Figures


Similar articles
-
Douchi (fermented Glycine max Merr.) alleviates atopic dermatitis-like skin lesions in NC/Nga mice by regulation of PKC and IL-4.BMC Complement Altern Med. 2016 Oct 24;16(1):416. doi: 10.1186/s12906-016-1394-4. BMC Complement Altern Med. 2016. PMID: 27776525 Free PMC article.
-
Substance P restores normal skin architecture and reduces epidermal infiltration of sensory nerve fiber in TNCB-induced atopic dermatitis-like lesions in NC/Nga mice.J Dermatol Sci. 2018 Mar;89(3):248-257. doi: 10.1016/j.jdermsci.2017.11.013. Epub 2017 Dec 1. J Dermatol Sci. 2018. PMID: 29269174
-
Therapeutic Effects of Chinese Herbal Formula (PTQX) on NC/Nga Mice with Atopic Dermatitis-Like Skin Lesions.Evid Based Complement Alternat Med. 2019 Dec 7;2019:8359252. doi: 10.1155/2019/8359252. eCollection 2019. Evid Based Complement Alternat Med. 2019. PMID: 31885666 Free PMC article.
-
Gardenia jasminoides extract without crocin improved atopic dermatitis-like skin lesions via suppression of Th2-related cytokines in Dfe-induced NC/Nga mice.J Ethnopharmacol. 2019 Sep 15;241:112015. doi: 10.1016/j.jep.2019.112015. Epub 2019 Jun 4. J Ethnopharmacol. 2019. PMID: 31173875
-
Hataedock treatment has preventive therapeutic effects for atopic dermatitis through skin barrier protection in Dermatophagoides farinae-induced NC/Nga mice.J Ethnopharmacol. 2017 Jul 12;206:327-336. doi: 10.1016/j.jep.2017.06.001. Epub 2017 Jun 3. J Ethnopharmacol. 2017. PMID: 28583294
Cited by
-
Highly Biocompatible Lamellar Liquid Crystals Based on Hempseed or Flaxseed Oil with Incorporated Betamethasone Dipropionate: A Bioinspired Multi-Target Dermal Drug Delivery System for Atopic Dermatitis Treatment.Int J Nanomedicine. 2024 Dec 21;19:13687-13715. doi: 10.2147/IJN.S488684. eCollection 2024. Int J Nanomedicine. 2024. PMID: 39723176 Free PMC article.
-
Utilizing the healing power of flaxseed: a narrative review of its therapeutic applications.J Diabetes Metab Disord. 2025 May 28;24(1):128. doi: 10.1007/s40200-025-01636-2. eCollection 2025 Jun. J Diabetes Metab Disord. 2025. PMID: 40454185 Review.
-
The Therapeutic Role of Genistein in Perimenopausal and Postmenopausal Women.J Clin Aesthet Dermatol. 2024 Oct;17(10):45-53. J Clin Aesthet Dermatol. 2024. PMID: 39445324 Free PMC article. Review.
References
LinkOut - more resources
Full Text Sources
Other Literature Sources
Miscellaneous

