. 2017 Jan 20;6(1):e126.
doi: 10.1038/cti.2016.87. eCollection 2017 Jan.

Defective T-cell control of Epstein-Barr virus infection in multiple sclerosis

Affiliations

Defective T-cell control of Epstein-Barr virus infection in multiple sclerosis

Michael P Pender et al. Clin Transl Immunology. .

Erratum in

Abstract

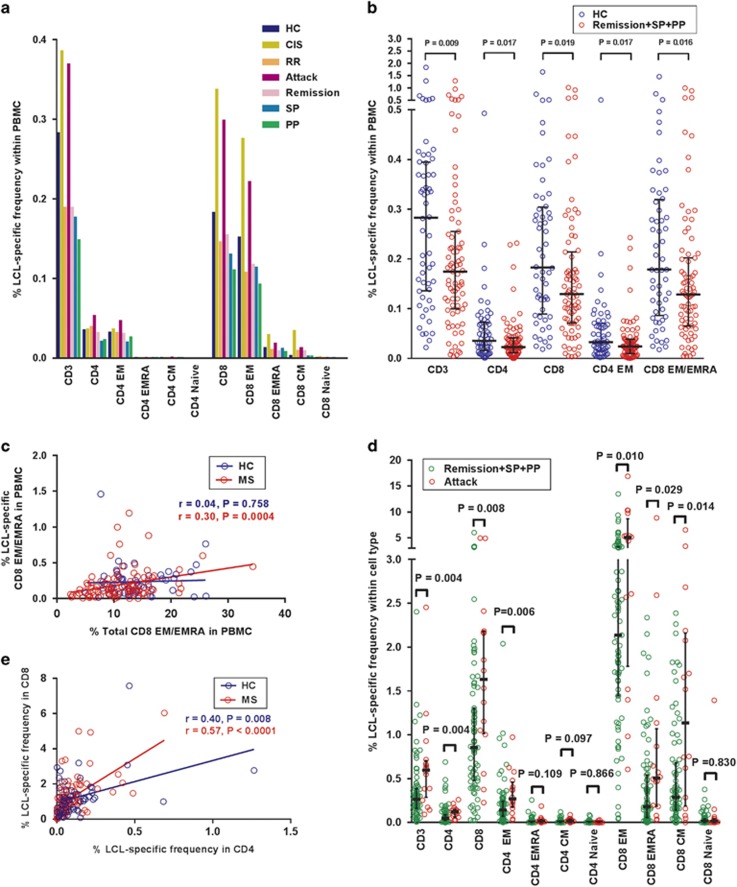
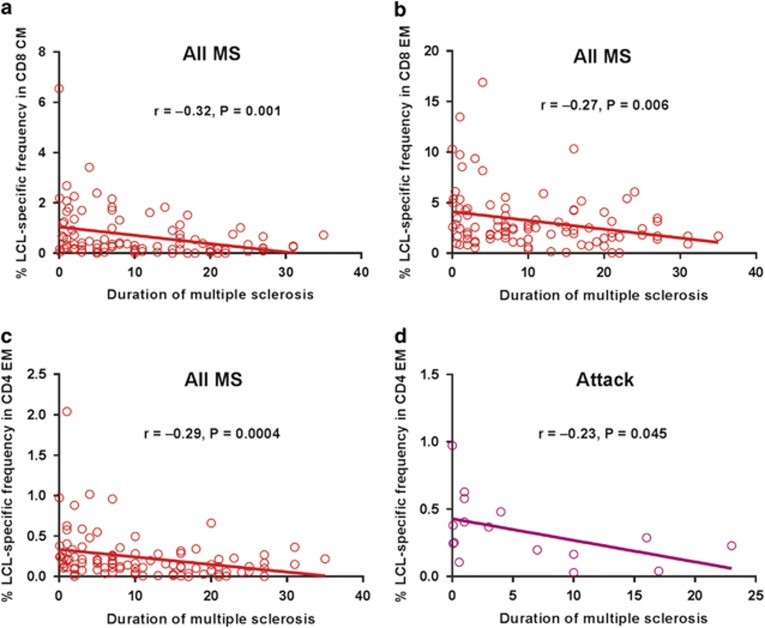
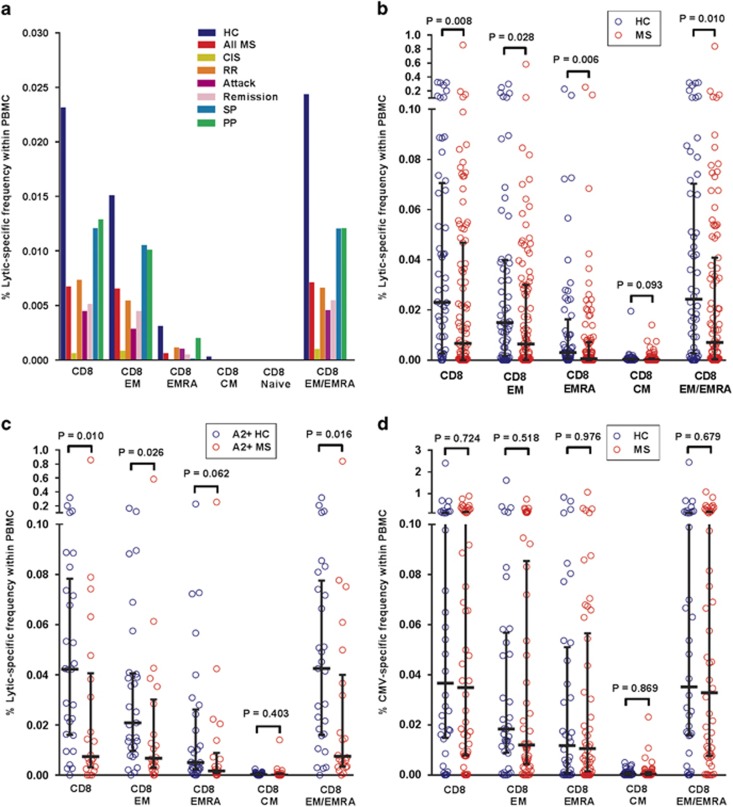
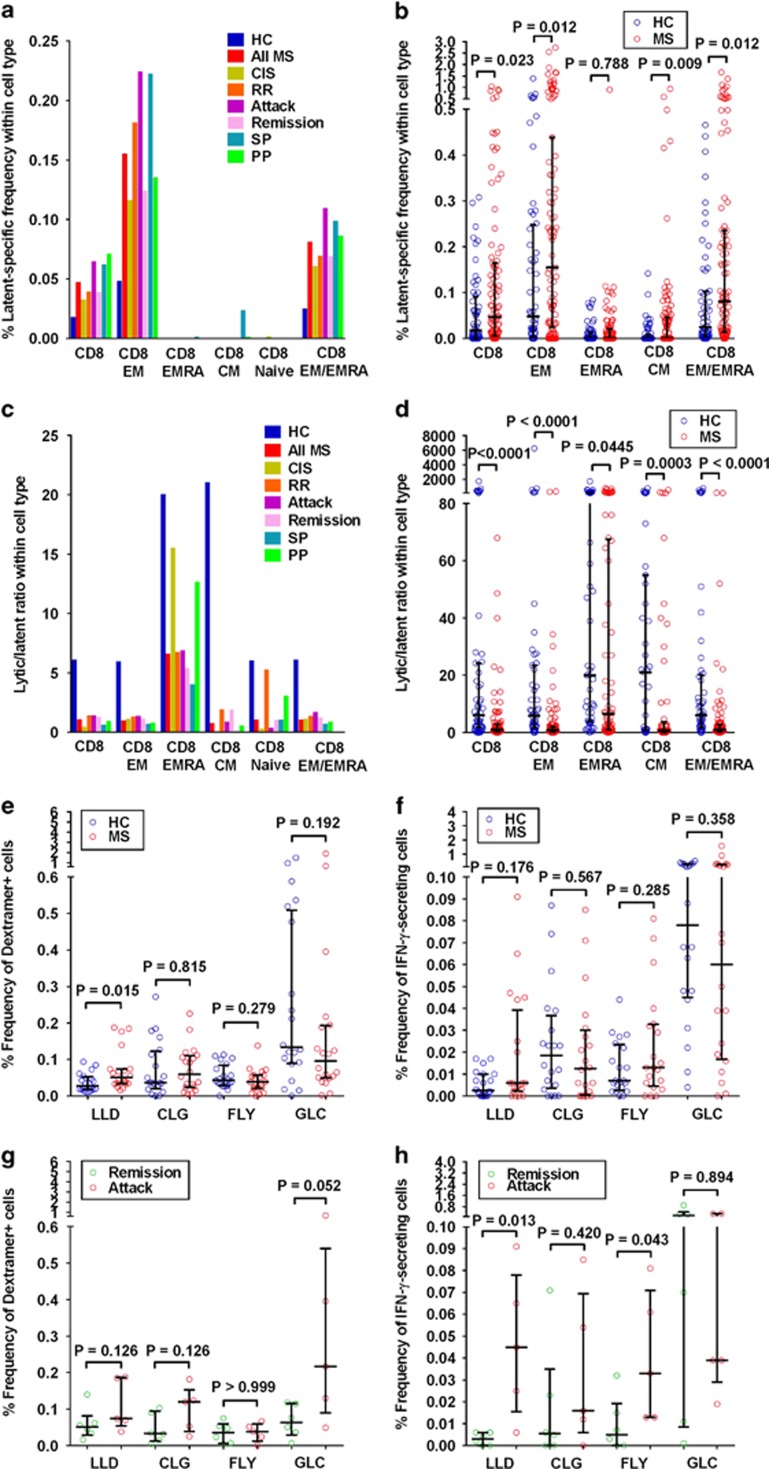
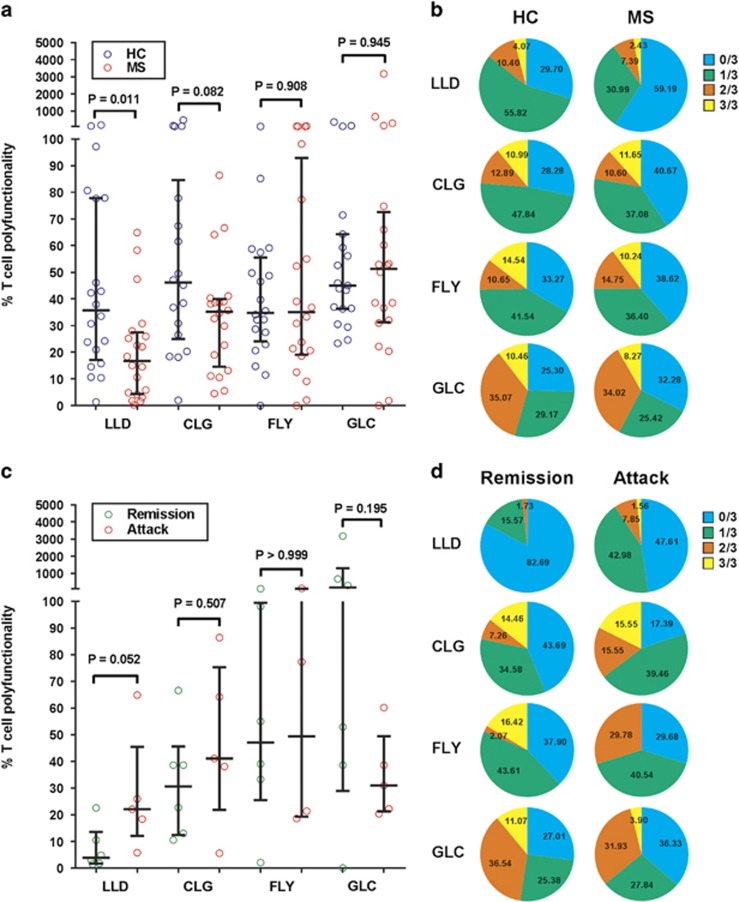
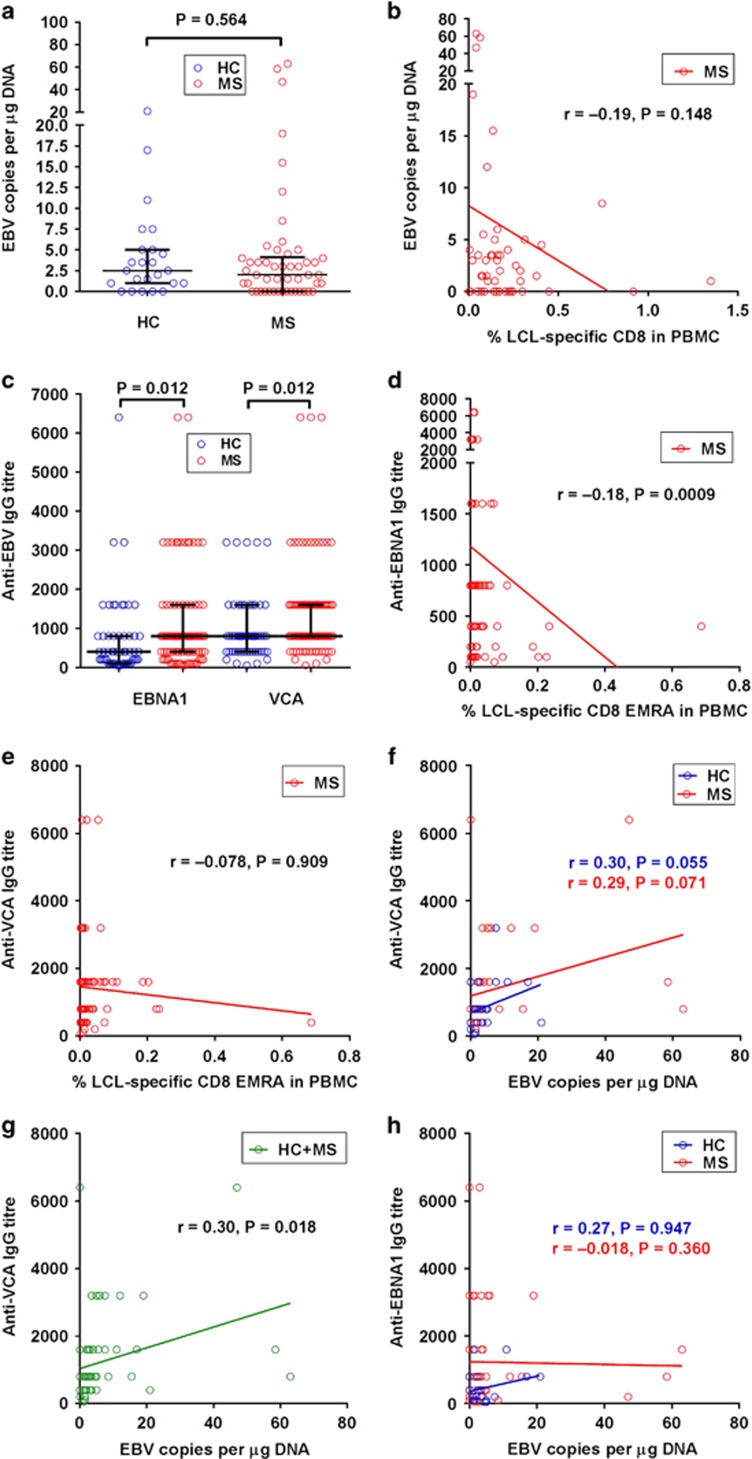
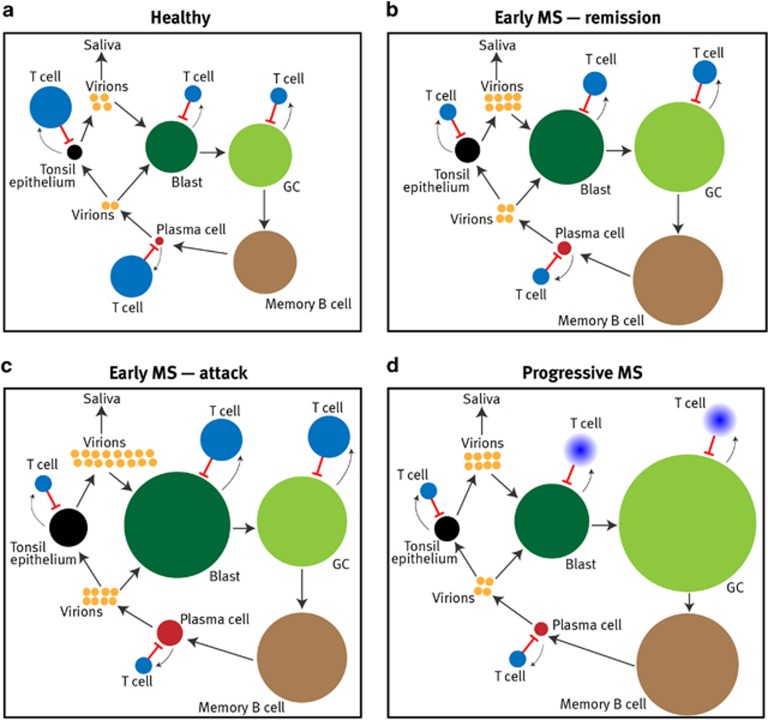
Mounting evidence indicates that infection with Epstein-Barr virus (EBV) has a major role in the pathogenesis of multiple sclerosis (MS). Defective elimination of EBV-infected B cells by CD8+ T cells might cause MS by allowing EBV-infected autoreactive B cells to accumulate in the brain. Here we undertake a comprehensive analysis of the T-cell response to EBV in MS, using flow cytometry and intracellular IFN-γ staining to measure T-cell responses to EBV-infected autologous lymphoblastoid cell lines and pools of human leukocyte antigen (HLA)-class-I-restricted peptides from EBV lytic or latent proteins and cytomegalovirus (CMV), in 95 patients and 56 EBV-seropositive healthy subjects. In 20 HLA-A2+ healthy subjects and 20 HLA-A2+ patients we also analysed CD8+ T cells specific for individual peptides, measured by binding to HLA-peptide complexes and production of IFN-γ, TNF-α and IL-2. We found a decreased CD8+ T-cell response to EBV lytic, but not CMV lytic, antigens at the onset of MS and at all subsequent disease stages. CD8+ T cells directed against EBV latent antigens were increased but had reduced cytokine polyfunctionality indicating T-cell exhaustion. During attacks the EBV-specific CD4+ and CD8+ T-cell populations expanded, with increased functionality of latent-specific CD8+ T cells. With increasing disease duration, EBV-specific CD4+ and CD8+ T cells progressively declined, consistent with T-cell exhaustion. The anti-EBNA1 IgG titre correlated inversely with the EBV-specific CD8+ T-cell frequency. We postulate that defective CD8+ T-cell control of EBV reactivation leads to an expanded population of latently infected cells, including autoreactive B cells.


Conflict of interest statement

The authors declare no conflict of interest.

Figures

Figure 1
Figure 1
Frequencies of T cells producing IFN-γ in response to autologous EBV-infected LCL. (a) Median percentages of T cells of different phenotypes producing IFN-γ in response to autologous EBV-infected LCL in the PBMC in EBV-seropositive healthy controls (HC), patients with clinically isolated syndrome (CIS), patients with relapsing–remitting (RR), secondary progressive (SP) and primary progressive (PP) MS, as well as patients during a clinical attack (Attack) and during remission (Remission). (b) Percentages of LCL-specific T cells in the PBMC in patients not having a clinical attack (Remission+SP+PP) compared with HC (medians with interquartile ranges indicated by black horizontal lines), with bracketed P values determined by the Mann–Whitney test. (c) Percentage of LCL-specific CD8+ EM/EMRA T cells in the PBMC plotted against the percentage of total CD8+ EM/EMRA T cells in the PBMC in healthy subjects (HC) and the total group of MS patients (MS). (d) Percentages of LCL-specific cells within the CD3+, CD4+, CD8+, CD4+ EM, CD4+ EMRA+, CD4+ CM, CD4+ naive, CD8+ EM, CD8+ EMRA, CD8+ CM and CD8+ naive T-cell populations in patients during a clinical attack (Attack) compared with patients not having an attack (Remission+SP+PP) (medians with interquartile ranges indicated by black horizontal lines), with bracketed P values determined by the Mann–Whitney test. (e) The frequency of LCL-specific T cells within the CD8+ population strongly correlated with the frequency of LCL-specific T cells within the CD4+ population in MS patients whereas this correlation was weaker in healthy subjects. On multiple linear regression analysis, the slope of the regression line in the MS patients was significantly greater than that in healthy subjects (P=0.006).
Figure 2
Figure 2
The relationship between the frequency of LCL-specific T cells and duration of MS. (ac) In the total group of patients, the percentage of LCL-specific T cells within the CD8+ CM population progressively decreased with increasing duration of MS (a), as did the frequency of LCL-specific T cells within the CD8+ EM population (b), and within the CD4+ EM population (c). (d) In patients having an attack the percentage of LCL-specific T cells within the CD4+ EM population also declined with increasing disease duration.
Figure 3
Figure 3
Decreased CD8+ T-cell response to EBV lytic phase antigens throughout the course of MS. (a) Median percentages of CD8+ T cells of different phenotypes producing IFN-γ in response to a pool of HLA-class-I-restricted EBV lytic peptides in the PBMC in EBV-seropositive healthy controls (HC), the total group of MS patients (All MS), patients with clinically isolated syndrome (CIS), patients with relapsing–remitting (RR), secondary progressive (SP) and primary progressive (PP) MS, as well as patients during a clinical attack (Attack) and during remission (Remission). As expected, there was no CD4+ T-cell response to these HLA-class-I-restricted peptides. (b) Percentages of EBV-lytic-specific CD8+ T cells in the PBMC in the total group of patients (MS) compared with healthy controls (HC) (medians with interquartile ranges indicated by black horizontal lines), with bracketed P values determined by the Mann–Whitney test. (c) Percentages of EBV-lytic-specific CD8+ T cells in the PBMC in HLA-A*02+ patients (A2+ MS) compared with HLA-A*02+ healthy controls (A2+ HC) (medians with interquartile ranges indicated by black horizontal lines), with bracketed P values determined by the Mann–Whitney test. (d) Percentages of CD8+ T cells of different phenotypes producing IFN-γ in response to a pool of HLA-class-I-restricted CMV peptides in the PBMC in CMV-seropositive HC, and CMV-seropositive MS patients (MS) (medians with interquartile ranges indicated by black horizontal lines), with bracketed P-values determined by the Mann–Whitney test. There was no CD4+ T-cell response.
Figure 4
Figure 4
Skewing of the EBV-specific CD8+ T-cell response in MS away from lytic to latent antigens. (a) Median percentages of CD8+ T cells within the different phenotypes producing IFN-γ in response to a pool of HLA-class-I-restricted EBV latent peptides in EBV-seropositive healthy controls (HC), the total group of MS patients (All MS), patients with clinically isolated syndrome (CIS), patients with relapsing–remitting (RR), secondary progressive (SP) and primary progressive (PP) MS, as well as patients during a clinical attack (Attack) and during remission (Remission). As expected, there was no CD4+ T-cell response to these HLA-class-I-restricted peptides. (b) Percentages of latent-specific cells within the CD8+, CD8+ EM, CD8+ EMRA, CD8+ CM and CD8+ EM/EMRA T-cell populations in patients with MS (MS) compared with healthy controls (HC) (medians with interquartile ranges indicated by black horizontal lines), with bracketed P-values determined by the Mann–Whitney test. (c) Median lytic/latent ratio within the different phenotypes in EBV-seropositive HC, the total group of MS patients (All MS), patients with CIS, patients with RR, SP and PP MS, as well as patients during a clinical attack (Attack) and during remission (Remission). For each subject the ratio was calculated by dividing the frequency of CD8+ T cells producing IFN-γ in response to pooled lytic peptides by the frequency of CD8+ T cells producing IFN-γ in response to pooled latent peptides. (d) Lytic/latent ratio within the CD8+, CD8+ EM, CD8+ EMRA, CD8+ CM and CD8+ EM/EMRA T-cell populations in the total group of MS patients (MS) compared with HC (medians with interquartile ranges indicated by black horizontal lines), with bracketed P values determined by the Mann–Whitney test. (e and f) Percentages of T cells specific for individual EBV latent (LLD, CLG and FLY) and lytic (GLC) peptides in the CD8+ population in 20 HLA-A*02+ EBV-seropositive healthy subjects (HC) and 20 HLA-A*02+ MS patients (MS) measured by binding to peptide-HLA-A*02 Dextramers (e) and IFN-γ production (f) (medians with interquartile ranges indicated by black horizontal lines), with bracketed P-values determined by the Mann–Whitney test. (g and h) Percentages of T cells specific for individual EBV latent and lytic peptides in the CD8+ population in HLA-A*02+ patients during clinical attacks (Attack) or during remission (Remission) measured by binding to peptide-HLA-A*02 Dextramers (g) and IFN-γ production (h) (medians with interquartile ranges indicated by black horizontal lines), with bracketed P-values determined by the Mann–Whitney test.
Figure 5
Figure 5
EBV-specific CD8+ T-cell polyfunctionality in MS. (a and b) Polyfunctionality of CD8+ T cells specific for individual EBV latent (LLD, CLG and FLY) and lytic (GLC) peptides in 20 HLA-A*02+ EBV-seropositive healthy subjects (HC) and 20 HLA-A*02+ MS patients (MS) determined by measuring the frequencies of T cells producing IL-2, TNF-α and IFN-γ in response to stimulation with each peptide and, in a different tube of cells, the frequencies of T cells binding to the respective peptide-HLA-A*02 Dextramer. (a) Ratio of the polyfunctionality index to the percentage of T cells binding the respective peptide-HLA-A*02 Dextramer in the CD8+ population (medians with interquartile ranges indicated by black horizontal lines), with bracketed P-values determined by the Mann–Whitney test. (b) Pie charts showing the mean percentages of Dextramer+ CD8+ T cells producing zero, one, two or three cytokines. (c and d) Polyfunctionality of CD8+ T cells specific for individual EBV latent and lytic peptides in HLA-A*02+ MS patients during clinical attacks (Attack) or during remission (Remission). (c) Ratio of the polyfunctionality index to the percentage of T cells binding the respective peptide-HLA-A*02 Dextramer in the CD8+ population (medians with interquartile ranges indicated by black horizontal lines), with bracketed P-values determined by the Mann–Whitney test. (d) Pie charts showing the mean percentages of Dextramer+ CD8+ T cells producing zero, one, two or three cytokines.
Figure 6
Figure 6
The relationships of EBV genome load and anti-EBV antibody titres with the frequency of EBV-specific CD8+ T cells in MS. (a) EBV DNA copy number in the PBMC in healthy EBV-seropositive subjects (healthy controls (HC)) and patients with MS (MS) (medians with interquartile ranges indicated by black horizontal lines), with P-value determined by the Mann–Whitney test. (b) Relationship between the EBV genome load and the LCL-specific CD8+ T-cell frequency in MS patients. (c) Titres of anti-EBNA1 IgG and anti-VCA IgG in the sera of healthy EBV-seropositive subjects (HC) and patients with MS (MS) (medians with interquartile ranges indicated by black horizontal lines), with bracketed P-values determined by the Mann–Whitney test. (d) Relationship between the anti-EBNA1 IgG titre and the LCL-specific CD8+ EMRA T-cell frequency in the PBMC in MS patients. (e) Relationship between the anti-VCA IgG titre and the LCL-specific CD8+ EMRA T-cell frequency in the PBMC in MS patients (f) Relationship between the anti-VCA IgG titre and the EBV genome load in HC and patients with MS (MS). (g) Relationship between the anti-VCA IgG titre and the EBV genome load in the combined groups of HC and patients with MS. (h) Relationship between the anti-EBNA1 IgG titre and the EBV genome load in HC and patients with MS.
Figure 7
Figure 7
Proposed model of defective CD8+ T-cell control of EBV infection in MS. In healthy EBV carriers, (a) there is a dynamic equilibrium between the EBV-infected cell populations and the T-cell response. EBV-specific CD8+ T cells (T cell) exert a key role in controlling EBV infection by killing infected cells in the B blast, germinal centre (GC) B cell, plasma cell and tonsil epithelial cell, but not memory B cell, populations. The large arrows indicate the cycle of EBV infection: virion→B blast→GC B cell→memory B cell→plasma cell→virion→epithelial cell→virion→B blast. Smaller arrows indicate stimulation of T cells by EBV antigens from the infected populations. The relative sizes of the different EBV-infected cell populations are indicated by the circle sizes, based on the study by Hawkins et al. The relative sizes of the EBV-specific CD8+ T-cell populations are also indicated by the circle sizes; however, it is important to note that the EBV-specific CD8+ T-cell population is several orders of magnitude larger than the EBV-infected cell population, a distinction not depicted here. For simplicity, the EBV-specific CD4+ T-cell population and anti-EBV antibody response are not shown. At all stages of MS (bd) the EBV-lytic-specific CD8+ T-cell population is decreased, allowing increased production of virions which infect naive B cells driving them into the blast phase. The resultant expansion of the infected blast population stimulates EBV-latent-specific CD8+ T cells which proliferate and restrict this expansion, but not without increased flow out of infected blast cells into a consequently enlarged EBV-infected GC cell population, which in turn is partially controlled by the augmented EBV-latent-specific CD8+ T-cell population. In the same way the EBV-infected memory B cell pool also grows, as does the population of plasma cells reactivating EBV infection. During clinical attacks of MS (c) there is increased differentiation of EBV-infected memory B cells into lytically infected plasma cells as a result of the various microbial infections that trigger attacks of MS. This EBV reactivation is inadequately regulated by the already deficient EBV-lytic-specific CD8+ T-cell response, resulting in increased virion production and increased infection of the blast pool, this in turn stimulating proliferation of the EBV-latent-specific CD8+ T-cell population which restricts further growth of the infected blast population. In progressive MS (d) the EBV-latent-specific CD8+ T-cell response becomes exhausted (indicated by fading), resulting in unchecked expansion of the infected GC population and the development of EBV-infected lymphoid tissue in the CNS.

References

    1. Ascherio A, Munger KL, Lünemann JD. The initiation and prevention of multiple sclerosis. Nat Rev Neurol 2012; 8: 602–612. - PMC - PubMed
    1. Pender MP, Burrows SR. Epstein–Barr virus and multiple sclerosis: potential opportunities for immunotherapy. Clin Transl Immunol 2014; 3: e27. - PMC - PubMed
    1. Thorley-Lawson DA, Gross A. Persistence of the Epstein-Barr virus and the origins of associated lymphomas. N Engl J Med 2004; 350: 1328–1337. - PubMed
    1. Laichalk LL, Thorley-Lawson DA. Terminal differentiation into plasma cells initiates the replicative cycle of Epstein-Barr virus in vivo. J Virol 2005; 79: 1296–1307. - PMC - PubMed
    1. Hadinoto V, Shapiro M, Sun CC, Thorley-Lawson DA. The dynamics of EBV shedding implicate a central role for epithelial cells in amplifying viral output. PLoS Pathog 2009; 5: e1000496. - PMC - PubMed