Review
. 2017 Jan 31:7:3.
doi: 10.3389/fonc.2017.00003. eCollection 2017.

Characterization of the Tumor Microenvironment and Tumor-Stroma Interaction by Non-invasive Preclinical Imaging

Affiliations
Review

Characterization of the Tumor Microenvironment and Tumor-Stroma Interaction by Non-invasive Preclinical Imaging

Nirilanto Ramamonjisoa et al. Front Oncol. .

Abstract

Tumors are often characterized by hypoxia, vascular abnormalities, low extracellular pH, increased interstitial fluid pressure, altered choline-phospholipid metabolism, and aerobic glycolysis (Warburg effect). The impact of these tumor characteristics has been investigated extensively in the context of tumor development, progression, and treatment response, resulting in a number of non-invasive imaging biomarkers. More recent evidence suggests that cancer cells undergo metabolic reprograming, beyond aerobic glycolysis, in the course of tumor development and progression. The resulting altered metabolic content in tumors has the ability to affect cell signaling and block cellular differentiation. Additional emerging evidence reveals that the interaction between tumor and stroma cells can alter tumor metabolism (leading to metabolic reprograming) as well as tumor growth and vascular features. This review will summarize previous and current preclinical, non-invasive, multimodal imaging efforts to characterize the tumor microenvironment, including its stromal components and understand tumor-stroma interaction in cancer development, progression, and treatment response.

Keywords: cancer; metabolic cooperation; microenvironment; preclinical multimodal imaging; stroma; tumor–stroma interaction.


Figures

Figure 1
Figure 1
The tumor microenvironment (TME). (A) Components and in vivo imaging of the TME. Immune cells include tumor-associated macrophages, antigen-presenting cells, myeloid-derived suppressor cells, and lymphocytes; CAFs, cancer-associated fibroblasts; MSCs, mesenchymal stem cells; ECM, extracellular matrix, consisting of collagens, laminins, and other matrix proteins, which is remodeled by ECM-degrading proteases; endothelial cells, pericytes, and vascular ECM compose the tumor blood and lymph vasculature. (B) Preclinical in vivo imaging of the TME. MRI, magnetic resonance imaging; PET, positron emission tomography; SPECT, single photon emission computer tomography; CT, computer tomography; US, ultrasound.
Figure 2
Figure 2
Models of cancer cell–cancer-associated fibroblast (CAF) metabolic cooperation in the tumor microenvironment, promoting survival, growth, and metastases (38, 39).
Figure 3
Figure 3
Intravital microscopy of the tumor microenvironment. (A) Epifluorescence microscopy was used to monitor and quantify tumor growth in a human fibrosarcoma xenograft model. The invasion of tumor into the surrounding tissue during growth can be visualized (white arrowheads). Bar 50 µm. Adapted with permission from Ref. (66). (B) Tumor morphology, vascularization, proliferation, and apoptosis in a human fibrosarcoma xenograft, as detected by intravital microscopy: tumor cells express cytoplasmic DsRed2 and nuclear histone 2B (H2B)-EGFP. Collagen fibers are detected by second-harmonic generation. Non-disrupted vessels are detected from the fluorescence signal of i.v.-administered Alexa660-Dextran. Bar 50 µm. Nuclear morphology including mitotic (white arrowheads) and apoptotic figures (black arrowhead) can be derived and quantified from imaging H2B-EGFP and DsRed2. Insets show prophase (P), metaphase (M), late anaphase (LA), and apoptotis (A). Bar 50 µm. Adapted with permission from Ref. (66).
Figure 4
Figure 4
Different motility and invasion of low-metastatic, GFP-expressing (green) and high-metastatic, CFP-expressing (white) mammary tumor cells within the collagen network (purple) was imaged by in vivo intravital microscopy with FL and second-harmonic generation. Bars 25 µm. (A) Time series demonstrating the migration of GFP-expressing (arrow head) and CFP-expressing (arrow) tumor cells along collagen fibers. (B) Metastatic growth of color-coded cells in the lung. (C) Protruding filopod (arrow, left) and lamellapod (arrow, right) of CFP-expressing cell near GFP-expressing cells. (D) Overall, the high-metastatic cells (outlined in white) move more frequently (see orange arrow path) than the low-metastatic cells (green). Adapted with permission from Ref. (67).
Figure 5
Figure 5
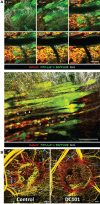
Intravital microscopy of the tumor blood vessels, lymph vasculature, and vascular response to treatment. (A) Top: Z-stack of lymphatics detected by near-infrared fluorescence (NIRF) multiphoton microscopy of FITC-tagged LyP-1 peptide (green), collagen fibers detected by second-harmonic generation, and tumor cells imaged by epifluorescence of cytoplasmic DsRed2 (red) and nuclear histone 2B (H2B)-EGFP (green) shows lymph vessels at the tumor margin. Bottom: intralymphatic (white arrowheads) and perilymphatic (black arrowheads) invasion of fibrosarcoma cells expressing cytoplasmic DsRed2 (red) and H2B-EGFP (green). Bars 100 µm. Adapted with permission from Ref. (66). (B) In vivo optical frequency domain imaging of blood [depth denoted from red (up to 2 mm deep) to yellow (superficial)] and lymph (blue) vessels in control and DC101-treated tumors, depicting the antivascular effect of VEGFR-2 inhibition. Adapted with permission from Ref. (68).
Figure 6
Figure 6
In vivo immune cell imaging. (A,B) Specificity of in vivo imaging of immune cells in 4T1 mammary breast tumors by fluorescence-reflectance imaging with a Cy5.5-labeled polyclonal antibody against murine S100A9 (aS100A9-C5.5). (C) Fluorescence molecular tomography of coinjected rabIgG-Cy7 and aS100A9-C5.5 demonstrates homogeneous perfusion (left) and immune cell distribution (right), respectively. (D) Ex vivo validation shoe S100A+ cells in the tumor periphery corresponding to F4/80+ TAMs. Adapted with permission from Ref. (69) © by the Society of Nuclear Medicine and Molecular Imaging, Inc.
Figure 7
Figure 7
In a carcinoembryonic antigen (CEA)-expressing colorectal adenocarcinoma model, simultaneous magnetic resonance imaging (MRI)/positron emission tomography (PET) at 4 h and 20 h after the injection of a radiolabeled antibody against CEA (64Cu-DOTA-NHS-M5A) demonstrates its accumulation in the tumor over time, while the apparent diffusion coefficient across the tumor remained largely unchanged. Adapted with permission from Ref. (70) © by the Society of Nuclear Medicine and Molecular Imaging, Inc.

References

    1. Vaupel P, Kallinowski F, Okunieff P. Blood flow, oxygen and nutrient supply, and metabolic microenvironment of human tumors: a review. Cancer Res (1989) 49(23):6449–65. - PubMed
    1. Liotta LA, Kohn EC. The microenvironment of the tumour-host interface. Nature (2001) 411(6835):375–9.10.1038/35077241 - DOI - PubMed
    1. Swietach P, Vaughan-Jones RD, Harris AL. Regulation of tumor pH and the role of carbonic anhydrase 9. Cancer Metastasis Rev (2007) 26(2):299–310.10.1007/s10555-007-9064-0 - DOI - PubMed
    1. Pathak AP, Artemov D, Ward BD, Jackson DG, Neeman M, Bhujwalla ZM. Characterizing extravascular fluid transport of macromolecules in the tumor interstitium by magnetic resonance imaging. Cancer Res (2005) 65(4):1425–32.10.1158/0008-5472.CAN-04-3682 - DOI - PubMed
    1. LeBleu VS. Imaging the tumor microenvironment. Cancer J (2015) 21(3):174–8.10.1097/PPO.0000000000000118 - DOI - PMC - PubMed