. 2017 Aug;20(3):325-340.
doi: 10.1007/s10456-017-9540-2. Epub 2017 Feb 14.

MCPIP1 contributes to clear cell renal cell carcinomas development

Affiliations

MCPIP1 contributes to clear cell renal cell carcinomas development

Janusz Ligeza et al. Angiogenesis. 2017 Aug.

Abstract

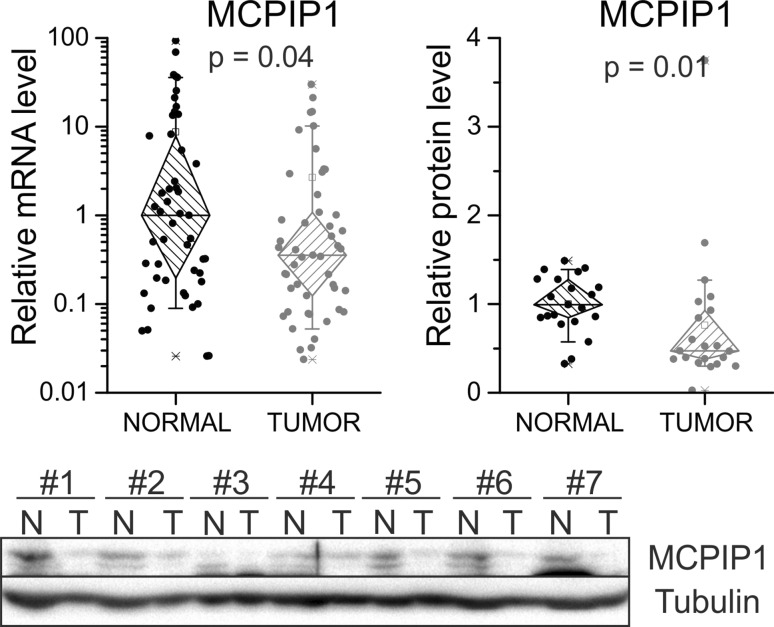
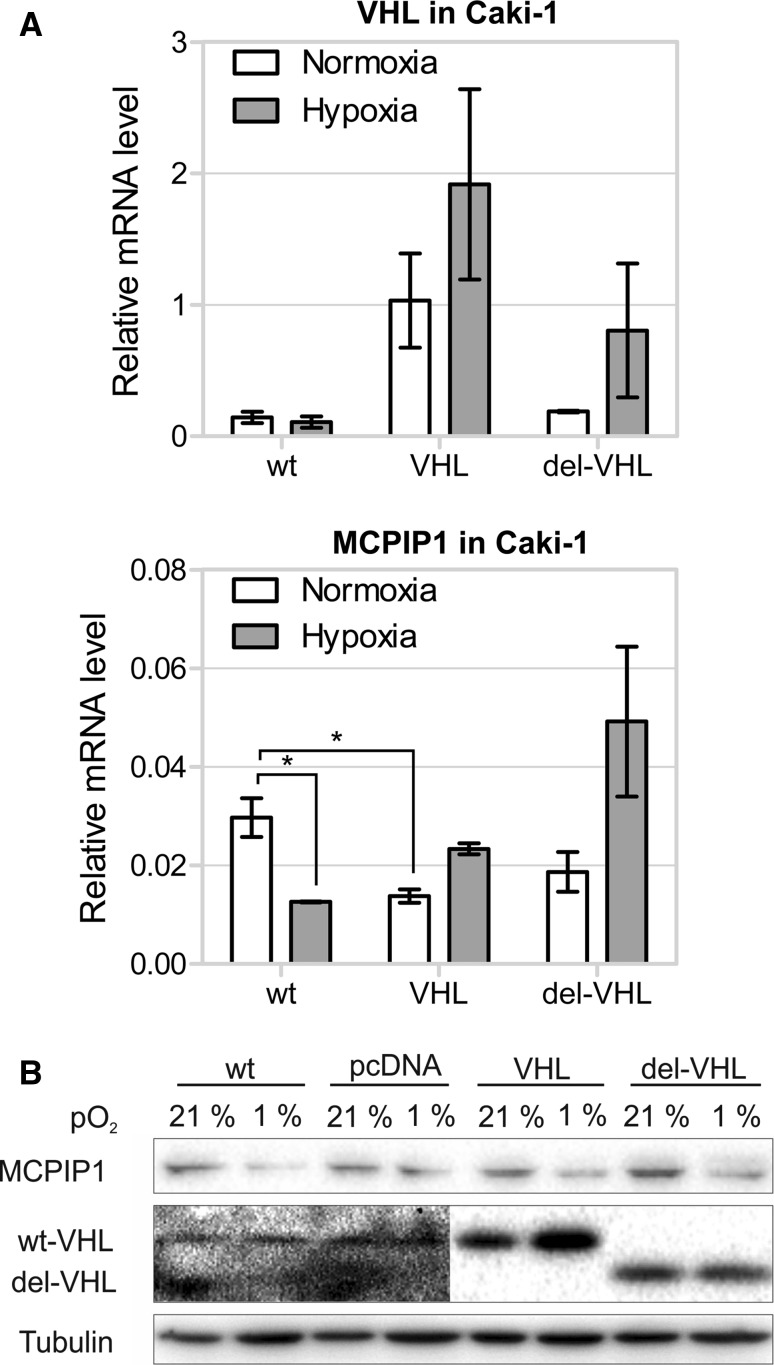
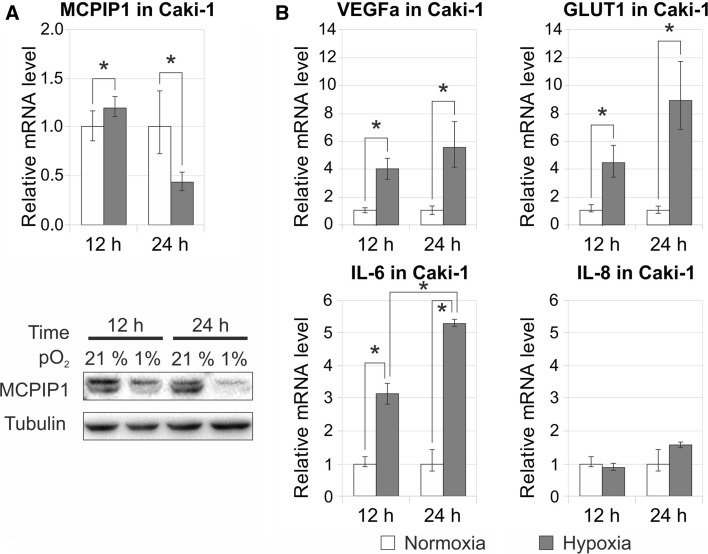
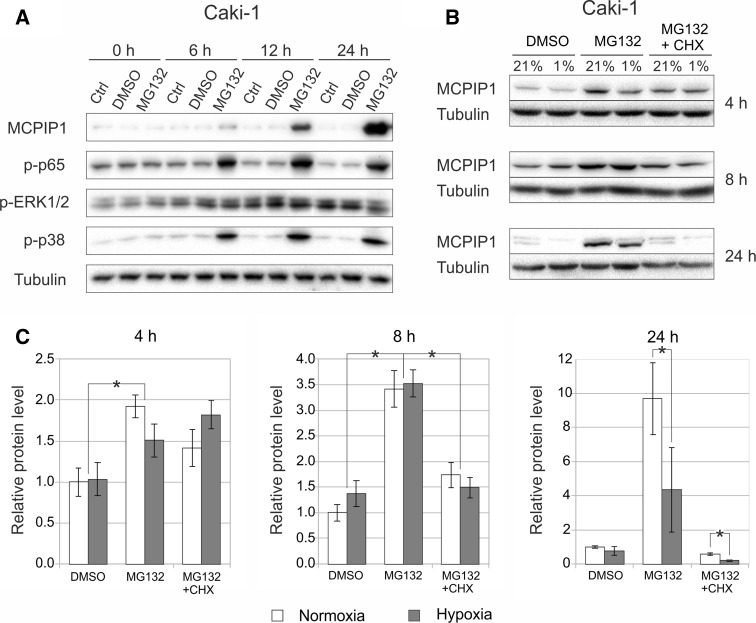
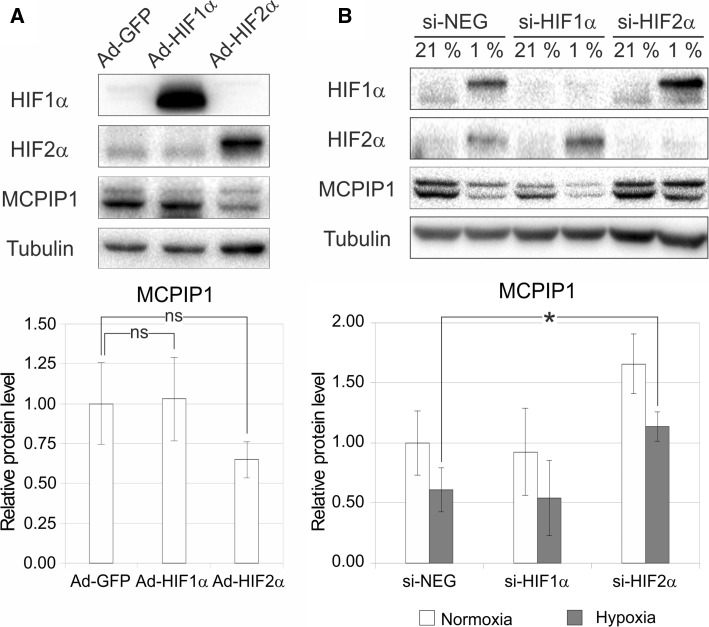
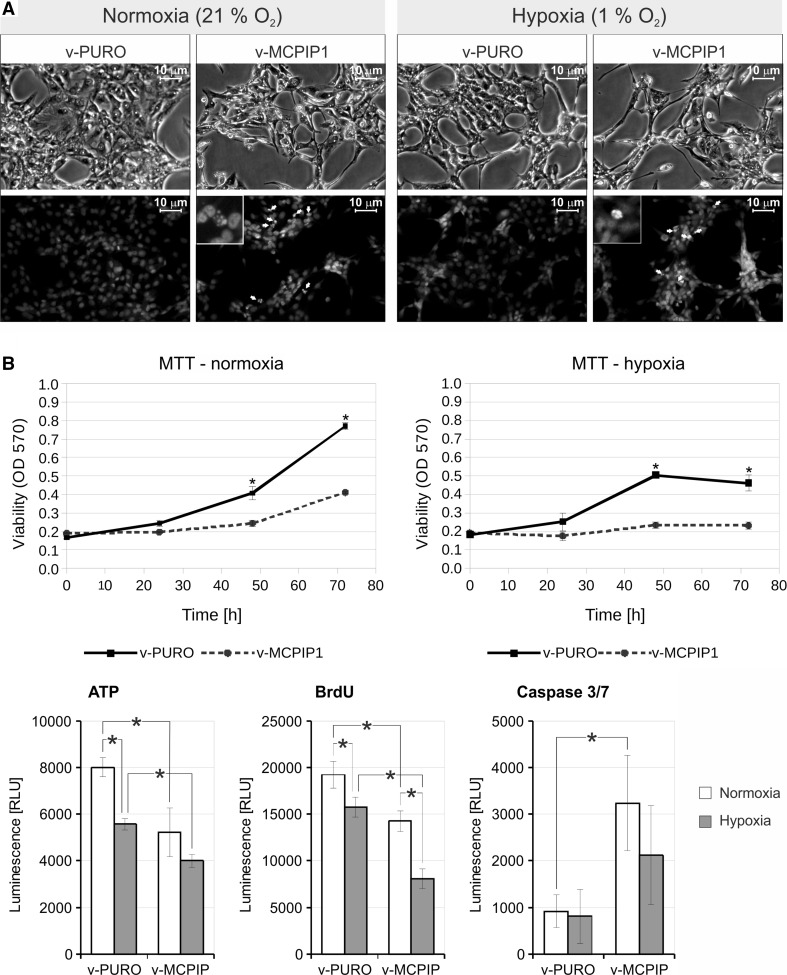
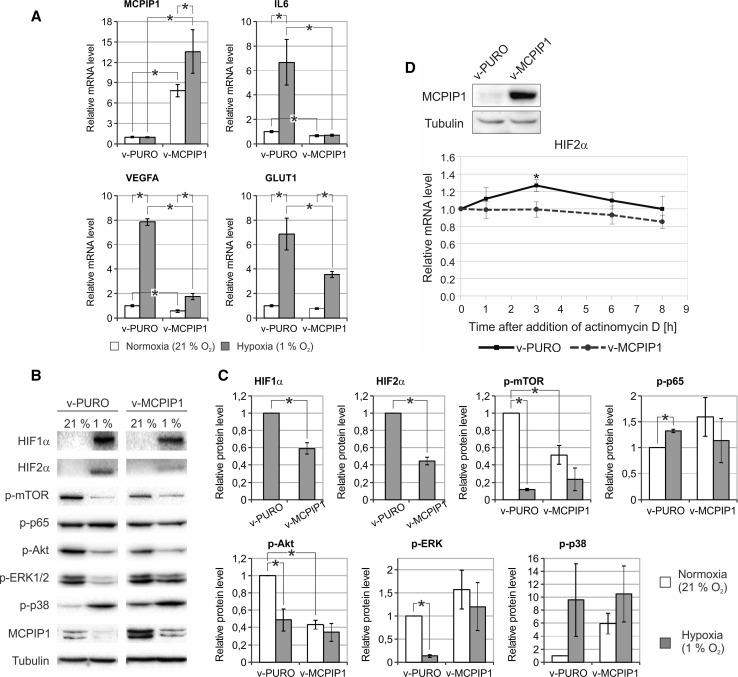
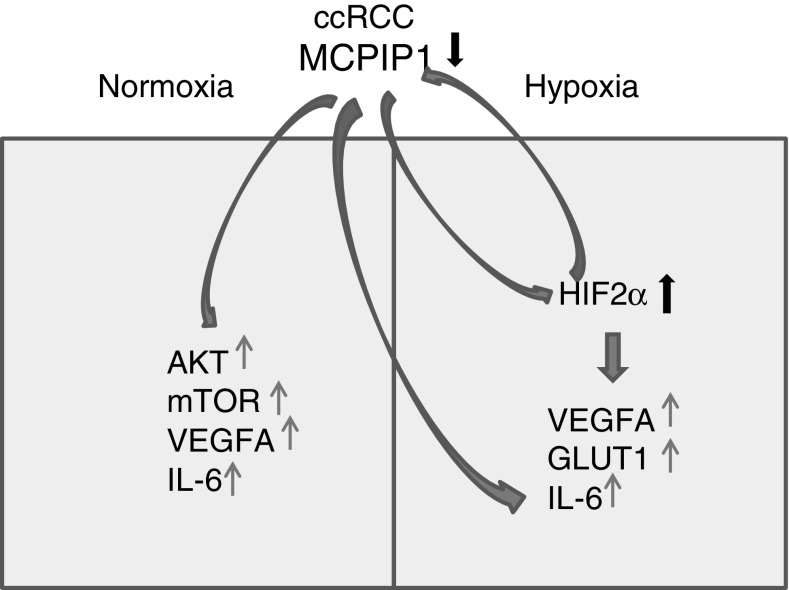
Monocyte Chemoattractant protein-induced protein 1 (MCPIP1), also known as Regnase-1, is encoded by the ZC3H12a gene, and it mediates inflammatory processes by regulating the stability of transcripts coding for proinflammatory cytokines and controlling activity of transcription factors, such as NF-κB and AP1. We found that MCPIP1 transcript and protein levels are strongly downregulated in clear cell renal cell carcinoma (ccRCC) samples, which were derived from patients surgically treated for renal cancer compared to surrounded normal tissues. Using Caki-1 cells as a model, we analyzed the role of MCPIP1 in cancer development. We showed that MCPIP1 expression depends on the proteasome activity; however, hypoxia and hypoxia inducible factor 2 alfa (HIF2α) are key factors lowering MCPIP1 expression. Furthermore, we found that MCPIP1 negatively regulates HIF1α and HIF2α levels and in the case of the last one, the mechanism is based on the regulation of the half time of transcript coding for HIF2α. Enhanced expression of MCPIP1 in Caki-1 cells results in a downregulation of transcripts encoding VEGFA, GLUT1, and IL-6. Furthermore, MCPIP1 decreases the activity of mTOR and protein kinase B (Akt) in normoxic conditions. Taken together, MCPIP1 contributes to the ccRCC development.

Keywords: Angiogenesis; Clear cell renal cell carcinoma (ccRCC); HIF1α; HIF2α; MCPIP1 (Regnase-1).


Conflict of interest statement

The authors declare that there is no conflict of interests regarding the publication of this paper.

Figures

Fig. 1
Fig. 1
Transcript and protein level of MCPIP1 in ccRCC tissue samples. mRNA levels were analyzed using qRT-PCR for 47 patients in ccRCC tissue (referred as tumor) and non-neoplastic kidney tissue (normal). For each sample, transcript levels were normalized to the reference gene (PPIA—peptidylprolyl isomerase A) expression level. The mRNA level for non-tumor samples was set to 1. The MCPIP1 protein level was analyzed by western blot from 21 tumor samples and adjacent normal tissues. Then, densitometry was performed. Tubulin and GAPDH were used as a loading control and tubulin was used as a reference. The p values were estimated using Mann–Whitney (Wilcoxon) W test
Fig. 2
Fig. 2
Overexpression pVHL in Caki-1 cells. a Cells were transfected with plasmid HA-VHL-pRc/CMV containing wild-type VHL gene (VHL) and a mutant form of VHL (deletion of C-terminal domain, del-VHL and non-treated cells (WT) as a control. Cells were cultured under hypoxic and normoxic conditions for 24 h. RNA level was estimated by Q-RT-PCR with specific primers for mentioned genes. Q-RT-PCR results are presented as mean ± SEM of three independent experiments. The p values were estimated using ANOVA with post hoc Bonferroni test (*p < 0.05). b Cells were transfected with plasmid HA-VHL-pRc/CMV containing wild-type VHL gene (VHL) and a mutant form of VHL (deletion of C-terminal domain, del-VHL). As control, non-treated cells (NT) and cells transfected with empty pcDNA3 plasmid (pcDNA) were used. After 24 h Western blots were performed with antibodies specific for MCPIP1, VHL, and α-tubulin
Fig. 3
Fig. 3
Influence of hypoxic condition on transcript and protein expression of MCPIP1 (a) and on expression of transcript coding for VEGFA, GLUT1, IL-6, and IL-8 (B) in Caki-1. Cells were cultured under hypoxic and normoxic conditions for 12 and 24 h. RNA level was estimated by Q-RT-PCR with specific primers for mentioned genes. Q-RT-PCR results are presented as mean ± SEM of three independent experiments. For each sample, the transcript level was normalized to reference gene (RPS13) expression level. The mRNA level for Caki-1 cells in normoxia was set to 1. The p values were estimated using ANOVA followed by Tukey’s HSD test (*p < 0.05). Protein level was analyzed by western blot with specific antibodies for MCPIP1 and α-tubulin. Presented western blot data are representative of three independent experiments
Fig. 4
Fig. 4
Proteasome inhibitor MG132 increases the expression of MCPIP1 and activates NF-κB (p65), and p38. a Caki-1 cells were treated with 1 µM MG132 or DMSO (control) for the indicated time periods. Protein extracts were subjected to western blot analysis with antibodies specific for MCPIP1 and phosphorylated signaling proteins (p65, Akt and p38). α-Tubulin was used as loading control. Blots are representative of three independent experiments. b Influence of MG132 and MG132 + cycloheximide (CHX) treatment on MCPIP1 expression in normoxia and hypoxia was analyzed by western blot. Graphs show mean ± SEM of three independent experiments (c). Statistical analysis was performed with ANOVA followed by Tukey’s HSD test (*p < 0.05)
Fig. 5
Fig. 5
Influence of HIF1α and HIF2α overexpression (a) and silencing (b) in Caki-1 cells on MCPIP1 protein level. a Caki-1 cells were transduced for 24 h with adenoviral vectors containing HIF-1α or HIF-2α cDNA (Ad-HIF1α, Ad-HIF2α) or a control vector harboring green fluorescent protein (GFP) cDNA (Ad-GFP) with 50 MOI. b HIF1α or HIF2α expression was silenced using specific siRNAs. Control cells were transfected with negative (non-targeting) control siRNA. Cells were incubated under normoxic and hypoxic conditions for 24 h after transduction. Overexpression and silencing of HIF1α and HIF2α was confirmed by western blot. Representative immunoblots are shown. Graphs show mean ± SEM of three independent experiments. Statistical analysis was performed with ANOVA followed by Tukey’s HSD test (*p < 0.05)
Fig. 6
Fig. 6
Overexpression of MCPIP1 in Caki-1 and its impact on cell biology. Cells were transduced with a Tet-ON vector overexpressing MCPIP1 (v-MCPIP1). Cells transduced with an empty vector served as a control (v-PURO). In this experiment Caki-1 cells were cultured in FBS-free medium to decrease Tet-ON system leakage. Prior to protein or mRNA isolation, cells were stimulated for 24 h with doxycycline (1 µg/ml) and then transferred to normoxic or hypoxic conditions for next 24 h. a Morphological changes and Hoechst 33325 staining were followed by fluorescent microscope analysis of Caki-1 cells 48 h after doxycycline induced MCPIP1 overexpression. Apoptotic cells are marked with arrows. b Viability of Caki-1 cells, proliferation rate, ATP cellular content and activity of caspase 3/7 were carried out in parallel 48 h after doxycycline addition. Graphs show mean ± SEM of three independent experiments. Statistical analysis was performed with ANOVA followed by Tukey’s HSD test (*p < 0.05)
Fig. 7
Fig. 7
Influence of MCPIP1 overexpression on transcript level of selected genes and signaling pathways in Caki-1 cells. a mRNA coding for MCPIP1, VEGFA, GLUT1, and IL-6 was assessed by qRT-PCR. Results are presented as mean ± SEM of three independent experiments. For each sample transcript levels were normalized to reference gene (RPS13) expression level. The mRNA level for v-PURO Caki-1 cells in normoxia was set to 1. The p values were estimated using ANOVA followed by Tukey’s HSD test. Differences between cells overexpressing MCPIP1 (v-MCPIP1) and control (v-PURO) are marked (*) when statistically significant (p < 0.05). b Representative data from western blot analysis performed with specific antibodies in order to assess the phosphorylation status of selected signaling proteins. Presented data are from representative image of three independent experiments. c Densitometric analysis of western blots. All graphs show mean ± SEM of three independent experiments. Statistical analysis was performed with ANOVA followed by Tukey’s HSD test (*p < 0.05). d Caki-1 cells were transduced with a Tet-ON vector overexpressing MCPIP1 (v-MCPIP1). Cells transduced with an empty vector served as a control (v-PURO). Following 24 h stimulation with doxycycline (1 µg/ml), actinomycin D was added (5 μg/ml) for a further 1, 3, 6, and 8 h and mRNA coding for HIF2α was assessed by qRT-PCR. The transcript level was normalized to reference gene (28S rRNA) expression level. Statistical analysis was performed with ANOVA followed by Fisher’s least significant difference (LSD) test (*p < 0.05)
Fig. 8
Fig. 8
Role of MCPIP1 in ccRCC development—detailed description in the “Discussion” section

Similar articles

Cited by

References

    1. Siegel R, Naishadham D, Jemal A. Cancer statistics, 2013. CA Cancer J Clin. 2013;63:11–30. doi: 10.3322/caac.21166. - DOI - PubMed
    1. Zbar B, Brauch H, Talmadge C, Linehan M. Loss of alleles of loci on the short arm of chromosome 3 in renal cell carcinoma. Nature. 1987;327:721–724. doi: 10.1038/327721a0. - DOI - PubMed
    1. Maxwell PH, Wiesener MS, Chang G, Clifford SC, Vaux EC, Cockman ME, Wykoff CC, Pugh CW, Maher ER, Ratcliffe PJ. The tumour suppressor protein VHL targets hypoxia-inducible factors for oxygen-dependent proteolysis. Nature. 1999;399:271–275. doi: 10.1038/20459. - DOI - PubMed
    1. Linehan WM, Rubin JS, Bottaro DP. VHL loss of function and its impact on oncogenic signaling networks in clear cell renal cell carcinoma. Int J Biochem Cell Biol. 2009;41:753–756. doi: 10.1016/j.biocel.2008.09.024. - DOI - PMC - PubMed
    1. Dalgliesh GL, Furge K, Greenman C, Chen L, Bignell G, Davies H, Edkins S, Hardy C, Latimer C, Teague J, Barthorpe S, Beare D, Buck G, et al. Systematic sequencing of renal carcinoma reveals inactivation of histone modifying genes. Nature. 2010;463:360–363. doi: 10.1038/nature08672. - DOI - PMC - PubMed

MeSH terms

Substances