. 2017 Feb 15:8:14449.
doi: 10.1038/ncomms14449.

Usp9x regulates Ets-1 ubiquitination and stability to control NRAS expression and tumorigenicity in melanoma

Affiliations

Usp9x regulates Ets-1 ubiquitination and stability to control NRAS expression and tumorigenicity in melanoma

Harish Potu et al. Nat Commun. .

Abstract

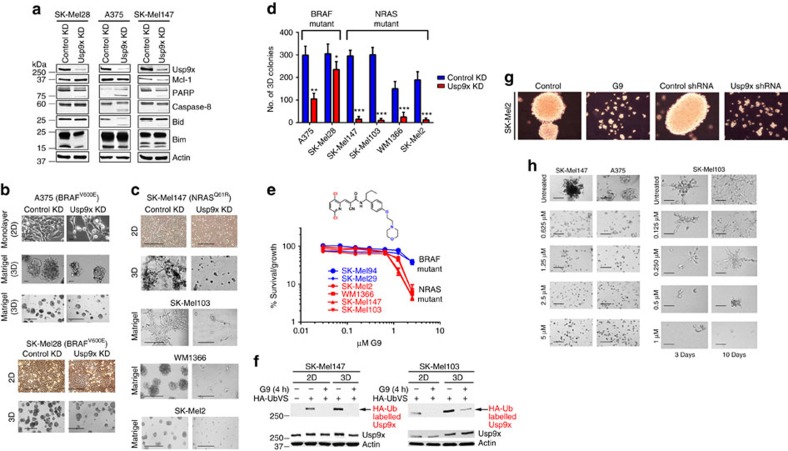
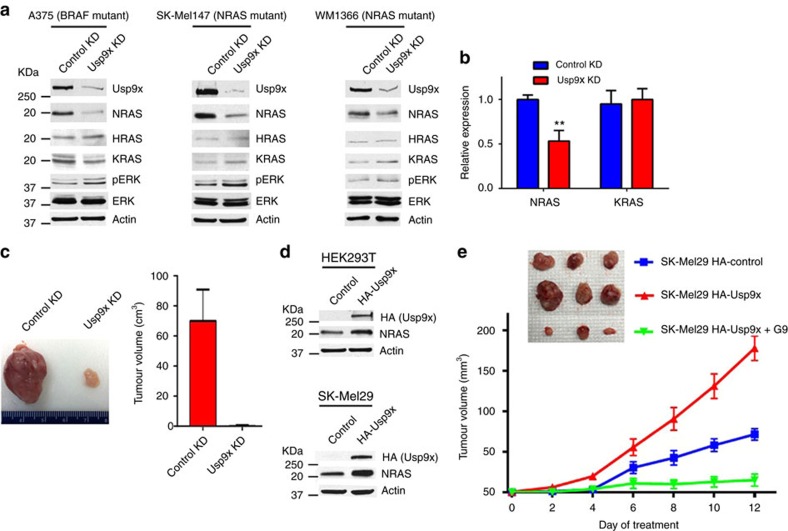
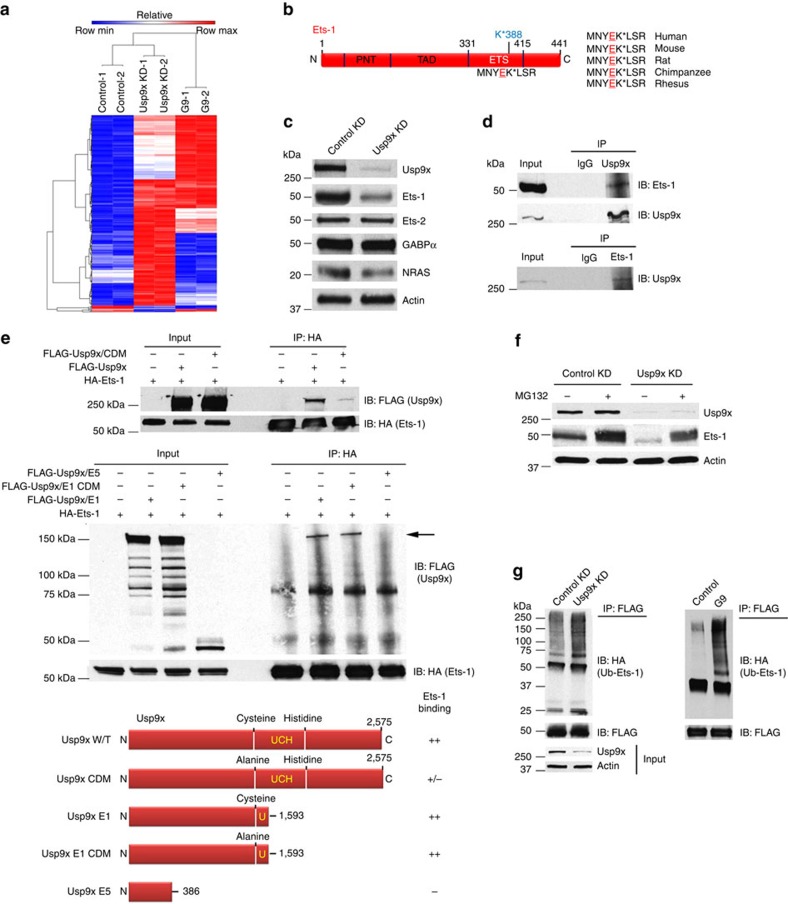
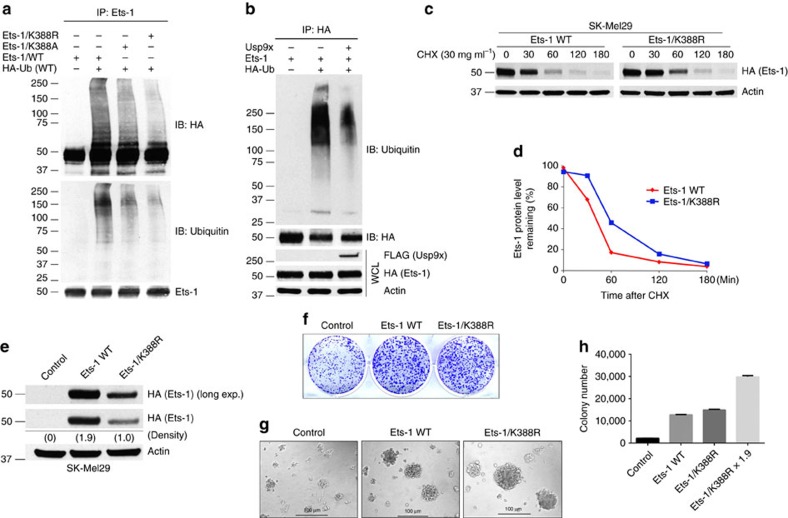
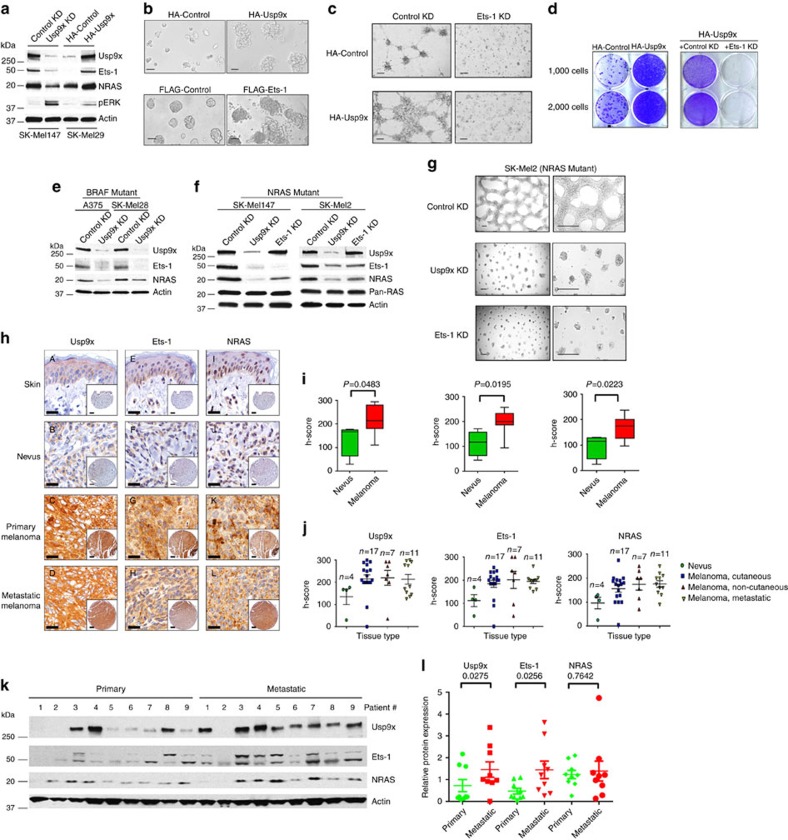
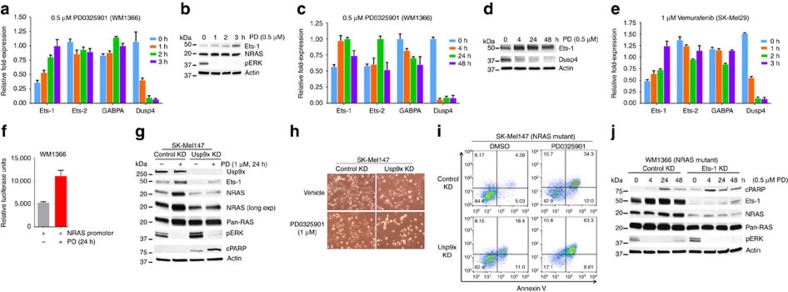
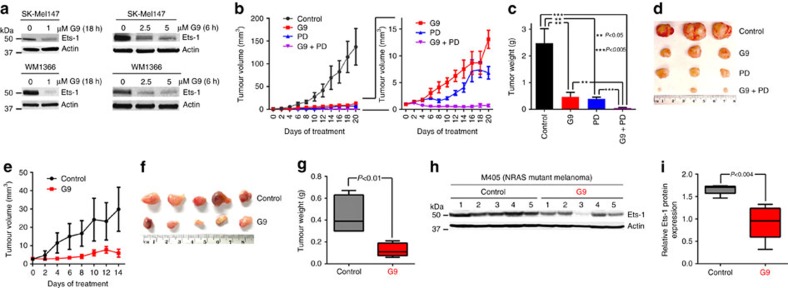
ETS transcription factors are commonly deregulated in cancer by chromosomal translocation, overexpression or post-translational modification to induce gene expression programs essential in tumorigenicity. Targeted destruction of these proteins may have therapeutic impact. Here we report that Ets-1 destruction is regulated by the deubiquitinating enzyme, Usp9x, and has major impact on the tumorigenic program of metastatic melanoma. Ets-1 deubiquitination blocks its proteasomal destruction and enhances tumorigenicity, which could be reversed by Usp9x knockdown or inhibition. Usp9x and Ets-1 levels are coincidently elevated in melanoma with highest levels detected in metastatic tumours versus normal skin or benign skin lesions. Notably, Ets-1 is induced by BRAF or MEK kinase inhibition, resulting in increased NRAS expression, which could be blocked by inactivation of Usp9x and therapeutic combination of Usp9x and MEK inhibitor fully suppressed melanoma growth. Thus, Usp9x modulates the Ets-1/NRAS regulatory network and may have biologic and therapeutic implications.


Conflict of interest statement

A patent (Patent No: US 8,809,377 B2, Date of Patent: Aug. 19, 2014) covering the synthesis and use of G9 has been filed with L.F.P., M.T. and N.J.D. as authors and constitutes a competing financial interest. The remaining authors declare no competing financial interests.

Figures

Figure 1
Figure 1. Effect of Usp9x KD and DUB inhibitor (G9) on the growth and expansion of melanoma cells.
(a) Immunoblot for the protein indicated in control and Usp9x KD (shRNA) melanoma cell lines. (b) Phase contrast images of BRAF mutant cells with or without Usp9x KD, grown in monolayer (2D—top) and matrigel (3D—bottom panels) for 7 days. Scale bars, 500 μm. (c) Phase contrast images of NRAS mutant cells with or without Usp9x KD, grown in 2D and 3D. Scale bars, 500 μm. (d) Quantification of colony growth in BRAF and NRAS mutant cells with and without Usp9x KD 7 days after plating. (e) Cell growth (by MTT) of NRAS mutant (SK-Mel2, WM1366, SK-Mel147, SK-Mel103) and BRAF mutant (SK-Mel94, SK-Mel29) cells treated with G9 at the indicated concentrations. The chemical structure of G9 (EOAI3401243) is shown. (f) DUB activity by HA-UbVS labelling in NRAS-mutant melanoma cells grown in 2D (monolayer) or 3D (agarose) and treated with G9 (5 μM, 4 h); HA-UbVS-labeled Usp9x is noted (top); Usp9x protein levels (bottom). (g) Phase contrast images of SK-Mel2 melanoma cells on agarose treated with or without 1 μM G9 for 3 days (left), and phase contrast images of control or Usp9x KD SK-Mel2 melanoma cells grown on agarose 3 days (right). (h) Phase contrast images of NRAS mutant (SK-Mel147) and BRAF mutant (A375) melanoma cells treated with G9 on matrigel for 3 days (left) and phase contrast images of NRAS mutant (SK-Mel103) melanoma cells treated with low dose of G9 (0–1 μM) on matrigel for 3 (left) or 10 days (right). Scale bars, 100 μm.
Figure 2
Figure 2. Usp9x regulates NRAS levels and is required for 3D growth.
(a) Immunoblot of RAS proteins and pERK in BRAF and NRAS mutant melanoma cells with and without Usp9x KD. (b) NRAS and KRAS gene expression in control and Usp9x KD SK-Mel147 cells by RT-PCR. (c) Tumour size in xenograft mice 6 weeks after injection with control (N=3) or Usp9x (N=3) KD SK-Mel147 cells. (d) Immunoblot for NRAS in 293T (top) or SK-Mel29 (bottom) control or Usp9x-overexpressing (HA-Usp9x) cells. Actin served as loading control. (e) Tumour volume in NSG mice injected subcutaneously with SK-Mel29 cells expressing HA-Control or HA-Usp9x. Mice were treated with vehicle (red, N=3; blue, N=3) or G9 (green, N=3). At day 12 of treatment, tumours were excised and photographed (top).
Figure 3
Figure 3. Usp9x deubiquitinates Ets-1 and regulates its degradation.
(a) Heat maps of differentially ubiquitinated proteins. NRAS mutant SK-Mel147 cells were exposed to control and Usp9x KD or G9 treatment as noted. The number of unique peptides and proteins reproducibly detected is shown. (b) Schematic diagram of the human Ets-1 protein showing the PNT (pointed domain, aa 53–136), TAD (transactivation domain, aa 137–242) and ETS domains. The putative site of ubiquitination (MNYEK*LSR) in human Ets-1 is shown and is conserved in mammalian species (right). (c) Immunoblot of ETS family proteins and NRAS in NRAS mutant melanoma cells with and without Usp9x KD. Actin served as a loading control. (d) Reciprocal immunoprecipitation of Usp9x and Ets-1 with endogenous Ets-1 and Usp9x in NRAS mutant SK-Mel2 cells. Immunoblotting was performed to detect Ets-1 or Usp9x in pulldowns and a portion of the input sample. (e) Top—Ectopically expressed FLAG-Usp9x (full-length) or FLAG-Usp9x-CDM (catalytic domain mutant, C1566A) was co-expressed with HA-Ets-1 in HEK293T cells. HA (Ets-1) immunoprecipitation was followed by immunoblotting of FLAG (Usp9x—top) or HA (Ets-1—bottom). Input lysate was also immunoblotted. Center—Ectopically expressed FLAG-Usp9x deletion constructs (FLAG-Usp9x E1, FLAG-Usp9x E1/CDM (catalytic domain mutant—C1566A), FLAG-Usp9x E5 (C-terminal deletion)) (illustrated in the bottom panel) were co-expressed with HA-Ets-1 in HEK293T cells. HA (Ets-1) immunoprecipitation was followed by FLAG (Usp9x) or HA (Ets-1) immunoblotting. Input lysate was also immunoblotted. Bottom—Map and summary of the Usp9x deletion constructs and their Ets-1 binding activity. The position of the ubiquitin C-terminal hydrolase (UCH) in the catalytic domain is shown by bold letters. Numbers and letters designate highlighted amino acids. (f) Immunoblot for Usp9x, Ets-1 and actin in control and Usp9x KD WM1366 NRAS mutant cells treated±MG132 for 8 h (10 μM). (g) HEK293T cells ectopically expressing FLAG-Ets-1 and HA-Ubiquitin were subjected to control or Usp9x KD (left) or treated with vehicle or G9 (2.5 μM, 6 h—right). FLAG immunoprecipitation was followed by HA blotting to detect Ub-Ets-1 levels. Immunoblot for FLAG (Ets-1) in the pulldowns (top) and input lysate (Usp9x and actin—bottom) is shown.
Figure 4
Figure 4. Site-specific Ets-1 deubiquitination by Usp9x.
(a) HEK293T cells ectopically expressing HA-Ets-1 (WT), HA-Ets-1/K388A or HA-Ets-1/K388R co-expressed with HA-Ub were subjected to immunoprecipitation with Ets-1 antibody (Bethyl) followed by immunoblotting for HA (top) or Ubiquitin (bottom). Ets-1 in the pulldown was also immunoblotted with anti-Ets-1 (Bethyl—bottom). (b) HEK293T cells ectopically expressing HA-Ets-1 alone or co-expressed with FLAG-Usp9x and HA-Ub (as noted) were subjected to HA (Ets-1) immunoprecipitation followed by immunoblotting of Ubiquitin (top). Whole cell lysates (WCL) were also immunoblotted for the protein indicated (bottom). (c) BRAF mutant SK-Mel29 cells were stably transfected with HA-Ets-1 WT or the K388R mutant plasmid, treated with 30 μg ml−1 of cycloheximide (CHX), and harvested at the time points indicated after CHX addition. Immunoblot for HA (Ets-1) is shown. (d) The blot from c was subjected to densitometric scanning (ImageJ software) to detect changes in HA-Ets-1 protein levels over time. (e) Immunoblot for HA and actin in SK-Mel29 cells stably expressing HA-Ets-1 WT or HA-Ets-1/K388R. Protein expression levels were quantified by densitometry (ImageJ software). (f) Colony growth (detected by crystal violet staining) of SK-Mel29 cells expressing control, HA-Ets-1 WT or HA-Ets-1/K388R and grown 21 days in standard 2D culture. (g) Phase contrast images of SK-Mel29 cells expressing control, HA-Ets-1 WT or HA-Ets-1/K388R and grown on matrigel for 7 days. (h) Quantification of growth of colonies in (f) after 21 days. All data shown are mean values±s.d. (error bar) from three replicates.
Figure 5
Figure 5. Usp9x overexpression in tumours correlates with increased Ets-1 and NRAS protein expression.
(a) Immunoblot for Usp9x, Ets-1, NRAS, pERK and actin in control and Usp9x KD SK-Mel147 cells and HA-Control and HA-Usp9x-overexpressing SK-Mel29 cells. (b) Phase contrast images of SK-Mel29 cells expressing HA-Control or HA-Usp9x and grown on matrigel for 7 days (top) or SK-Mel29 cells expressing Flag-Control or Flag-Ets-1 and grown on matrigel for 7 days (bottom). Scale bars, 100 μm. (c) Phase contrast images of HA-Control and HA-Usp9x expressing SK-Mel29 cells alone or with Ets-1 KD grown on matrigel for 7 days. Scale bars, 100 μm. (d) Colony growth (detected by crystal violet staining) of SK-Mel29 cells expressing HA-Control or HA-Usp9x after 21 days in standard 2D culture (left) or after Ets-1 KD before plating (right). (e) Immunoblot for Usp9x, Ets-1, NRAS and actin in BRAF mutant cell lines 5 days after Usp9x KD. (f) Immunoblot for Usp9x, Ets-1, NRAS, Pan-RAS and actin in NRAS mutant cell lines after 5 days of KD. (g) Phase contrast images of NRAS-mutant SK-Mel2 cells with or without Usp9x KD and Ets-1 KD and grown in 3D (matrigel) for 7 days. Scale bars, 500 μm (100 μm inset). (h) Immunostaining for Usp9x, Ets-1 and NRAS in normal skin, benign nevi, primary melanoma and metastatic melanoma (insets show whole tissue microarray). Scale bars, 20 μm. (i,j) Quantitation of Usp9x, Ets-1 and NRAS immunohistochemical staining by multiplying staining percentage (0–100%) by staining intensity on a numerical scale (none=1, weak=2, moderate=3, strong=4). (k) Immunoblot for Usp9x, Ets-1, NRAS and actin in nine primary and nine metastatic melanoma tumours. (l) Quantification of Usp9x, Ets-1 and NRAS expression in immunoblots from nine primary and nine metastatic melanoma patient tumours.
Figure 6
Figure 6. Ets-1 activates the proximal NRAS promoter.
(a) Immunoblot for FLAG in BRAF mutant SK-Mel29 cells (express low endogenous Usp9x and Ets-1 levels) stably transfected with FLAG-Usp9x or FLAG-Ets-1 (top). Relative luciferase units (firefly/Renilla) in lysates from SK-Mel29 cells expressing (48 h) the proximal NRAS promoter, FLAG-Ets-1 or FLAG-Usp9x (bottom). (b) Immunoblot for FLAG in NRAS mutant WM1366 cells expressing FLAG-Ets-1 or FLAG-Usp9x (top). Relative luciferase units (firefly/Renilla) in lysates from WM1366 cells expressing the proximal NRAS promoter, FLAG-Ets-1 or full-length FLAG-Usp9x (bottom). (c) Proximal NRAS promoter sequence cloned from NRAS mutant SK-Mel147 cells, highlighting 5 putative ETS sites (designated E1M through E5M) derived from ChIP-SEQ analysis in other cell lines and visual inspection of the sequence. The consensus ETS binding sequence is highlighted below (boxed). (d) Relative luciferase units (firefly/Renilla) in lysates from SK-Mel29 cells expressing FLAG-Ets-1 and the proximal NRAS promoter (WT) or point mutants of each ETS putative binding site in the promoter region (E1M, E2M, E3M, E4M and E5M). (e) DNA-protein crosslinks from control and Usp9x KD cells were subjected to immunoprecipitation (as noted) before being used to prime a PCR reaction to detect the NRAS promoter. PCR products are shown (top) and compared with the input fraction (unfractionated DNA–protein complexes). Relative enrichment of the NRAS promoter for each condition is graphed below and represents the ave.±s.d. of three independent experiments.
Figure 7
Figure 7. Ets-1 expression induced by BRAF and MEK inhibitors is blocked by Usp9x inhibition.
(a) Expression levels of the indicated genes (Ets-1, Ets-2, GABPA and Dusp4) by RT-PCR in NRAS mutant (WM1366) cells treated with PD0325901 for 0–3 h. (b) Immunoblot of the indicated proteins in NRAS mutant (WM1366) cells treated with PD0325901 for the interval noted. (c) Expression levels of the indicated genes (Ets-1, Ets-2, GABPA and Dusp4) by RT-PCR in NRAS mutant (WM1366) cells treated with PD0325901 for the interval noted. (d) Immunoblot for the proteins indicated in NRAS mutant (WM1366) cells treated with PD0325901 as described. (e) Expression levels of the genes indicated (Ets-1, Ets-2, GABPA and Dusp4) by RT-PCR in BRAF mutant (SK-Mel29) cells treated with vemurafenib for the interval indicated. (f) Relative luciferase units (firefly/Renilla) from NRAS mutant (WM1366) cells expressing the NRAS promoter for 24 h and treated with PD0325901 (0.5 μM) as noted. (g) Immunoblot for the proteins indicated in control and Usp9x KD NRAS mutant (SK-Mel147) cells treated with PD0325901 as indicated. (h) Phase contrast images of control and Usp9x KD NRAS mutant (SK-Mel147) cells treated with PD0325901 for 48 h. (i) Annexin V assessment in control and Usp9x KD NRAS mutant (SK-MEL147) cells treated with PD0325901 (1 μM) for 48 h as indicated. (j) Immunoblot for the proteins indicated in control and Ets-1 KD NRAS mutant (WM1366) cells treated with PD0325901 as indicated.
Figure 8
Figure 8. Usp9x inhibition has anti-melanoma activity.
(a) Immunoblot for Ets-1 in NRAS mutant SK-Mel147 (top) or WM1366 (bottom) cells treated with G9 (1 μM) for the interval and condition indicated. Actin was blotted as a loading control (b) Left—Tumour volumes in NSG mice injected subcutaneously with SK-Mel147 cells and treated intraperitoneally with either vehicle, G9 (15 mg kg−1, QOD), PD0325901 (5 mg kg−1; OD) or both for 3 weeks (N=3/group). Right—Comparison of tumour growth in inhibitor treated mice. (c) Average±s.d. of tumour weight (from b) at the end of treatment (Day 21). (d) Photographs of individual tumours (from b) at the end of treatment. (e) Tumour volumes in NSG mice injected subcutaneously with tumour derived from a patient with NRAS mutant melanoma (M405) and treated intraperitoneally with either vehicle or G9 (15 mg kg−1, QOD) for 2 weeks (N=5/group). (f) Photographs of individual tumours (from e) at the end of treatment. (g) Average±s.d. of tumour weight at the end of treatment (from e, day 14). (h) Immunoblot for assessment of Ets-1 protein levels in tumours from (e) Actin was blotted as a loading control. (i) Ets-1 protein levels (from h) were quantified by densitometry (ImageJ software).

References

    1. Merlino G. et al.. The state of melanoma: challenges and opportunities. Pigment Cell Melanoma Res. 29, 404–416 (2016). - PMC - PubMed
    1. Flaherty K. T. et al.. Combined BRAF and MEK inhibition in melanoma with BRAF V600 mutations. New Engl. J. Med. 367, 1694–1703 (2012). - PMC - PubMed
    1. Orloff M., Weight R., Valsecchi M. E. & Sato T. Immune check point inhibitors combination in melanoma: worth the toxicity? Rev. Recent Clin. Trials 11, 81–86 (2016). - PubMed
    1. Piskounova E. et al.. Oxidative stress inhibits distant metastasis by human melanoma cells. Nature 527, 186–191 (2015). - PMC - PubMed
    1. Kaur A. et al.. sFRP2 in the aged microenvironment drives melanoma metastasis and therapy resistance. Nature 532, 250–254 (2016). - PMC - PubMed

Publication types

MeSH terms