. 2017 Feb 15:8:14435.
doi: 10.1038/ncomms14435.

No saturation in the accumulation of alien species worldwide

Affiliations

No saturation in the accumulation of alien species worldwide

Hanno Seebens et al. Nat Commun. .

Abstract

Although research on human-mediated exchanges of species has substantially intensified during the last centuries, we know surprisingly little about temporal dynamics of alien species accumulations across regions and taxa. Using a novel database of 45,813 first records of 16,926 established alien species, we show that the annual rate of first records worldwide has increased during the last 200 years, with 37% of all first records reported most recently (1970-2014). Inter-continental and inter-taxonomic variation can be largely attributed to the diaspora of European settlers in the nineteenth century and to the acceleration in trade in the twentieth century. For all taxonomic groups, the increase in numbers of alien species does not show any sign of saturation and most taxa even show increases in the rate of first records over time. This highlights that past efforts to mitigate invasions have not been effective enough to keep up with increasing globalization.


Conflict of interest statement

The authors declare no competing financial interests.

Figures

Figure 1
Figure 1. Number of first records of established alien species per region (mainlands and islands) for major taxonomic groups.
(af) Colour and size of circles indicate the number of first records of established alien species. Circles denote first records on small islands and archipelagos otherwise not visible. The world maps were created using the ‘maptools' package of the open source software R.
Figure 2
Figure 2. Global temporal trends in first record rates.
Global temporal trends in first record rates (dots) for all species (a) and taxonomic groups (bq) with the total number of established alien species during the respective time periods given in parentheses. Data after 2000 (grey dots) are incomplete because of the delay between sampling and publication, and therefore not included in the analysis. As first record rates were recorded on a regional scale, species may be included multiple times in one plot. (a) First record rates are the number of first records per year during 1500–2014. (bq) First record rates constitute the number of first records per 5 years during 1800–2014 for various taxonomic groups. The trend is indicated by a running median with 25-year moving window (red line). For visualization, 50-year periods are distinguished by white/grey shading.
Figure 3
Figure 3. Relationships between the values of annually imported commodities and first record rates.
Relationships between the values of annually imported commodities and first record rates of the same regions for all taxonomic groups separately (ap). Each dot represents a single year during 1870–2000, depending on data availability. Following previous studies, a Michaelis–Menten curve (lines) was fitted to test for an improved fit using a nonlinear relationship with an attenuation of first record rates at large import values. The goodness-of-fit between observed data and the fitted curve is indicated by the Pearson's correlation coefficient given in the upper left corner of sub-panels, except for bacteria and protozoans, where the fitting function did not converge.
Figure 4
Figure 4. Temporal trends in continental first record rates.
Temporal trends in continental first record rates (that is, first records of established alien species on a continent per 5 years, dots) for various taxonomic groups and continents (for delineation of continents see Supplementary Fig. 12). It is noteworthy that for the inter-continental comparison, we only considered first records of established alien species on a continent, to avoid a bias due to varying numbers of countries in a continent, which resulted in a reduced number of first records (56% of the full data set). The trends are indicated by a running median with 25-year moving window (red line). Data after 2000 (grey dots) are incomplete and were removed from analysis. Time series with <70 first records are not shown. For visualization, 50-year periods are distinguished by white/grey shading. Time series for taxonomic groups with low numbers of first records are shown in Supplementary Fig. 6.
Figure 5
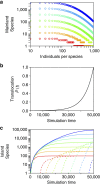
Figure 5. Simulation results for the accumulation of alien species on an island.
(a) Nine arbitrary mainland communities (colours) with log-normally distributed species numbers ranging from n=100 (red) to n=100,000 (blue) species were considered. (b) At each simulation time step, a propagule from a mainland community was selected with time-dependent probability P(t), which exponentially increased with simulation time t, shown in b and translocated to the island (see Supplementary Fig. 5 for the results using different shapes of P(t)). (c) The resulting accumulation of species numbers on the island (solid lines) shows that the timing of saturation highly depends on the size of the mainland community. Considering an Allee effect in the model, expressed as a certain number of propagules (here >10 propagules) necessary to establish an alien population during a given time period, delayed the accumulation of species (dashed lines), but did not change the results qualitatively. The lowest probability for establishment on the island is given by a low probability of translocation of an individual, which is randomly depicted from the mainland community, and a high species richness of the mainland community (blue lines): in the rare case of translocation, chances are high that an individual of a new species will be selected, which resulted in low population sizes of the same species on the island and a high chance of going extinct due to the Allee effect. This resulted in a distinct delay of the accumulation of established alien species on the island when the mainland community consists of many species with high abundances (blue dashed line).

References

    1. Hulme P. E., Pyšek P., Nentwig W. & Vilà M. Will threat of biological invasions unite the European Union? Science 324, 40–41 (2009). - PubMed
    1. Tittensor D. P. et al.. A mid-term analysis of progress toward international biodiversity targets. Science 346, 241–244 (2014). - PubMed
    1. Blackburn T. M., Dyer E., Su S. & Cassey P. Long after the event, or four things we (should) know about bird invasions. J. Ornithol. 156, 15–25 (2015).
    1. Winter M. et al.. Plant extinctions and introductions lead to phylogenetic and taxonomic homogenization of the European flora. Proc. Natl Acad. Sci. USA 106, 21721–21725 (2009). - PMC - PubMed
    1. Capinha C., Essl F., Seebens H., Moser D. & Pereira H. M. The dispersal of alien species redefines biogeography in the Anthropocene. Science 348, 1248–1251 (2015). - PubMed

Publication types