

MicroRNA-205 targets SMAD4 in non-small cell lung cancer and promotes lung cancer cell growth in vitro and in vivo
- PMID: 28199217
- PMCID: PMC5458170
- DOI: 10.18632/oncotarget.10339
MicroRNA-205 targets SMAD4 in non-small cell lung cancer and promotes lung cancer cell growth in vitro and in vivo
Abstract
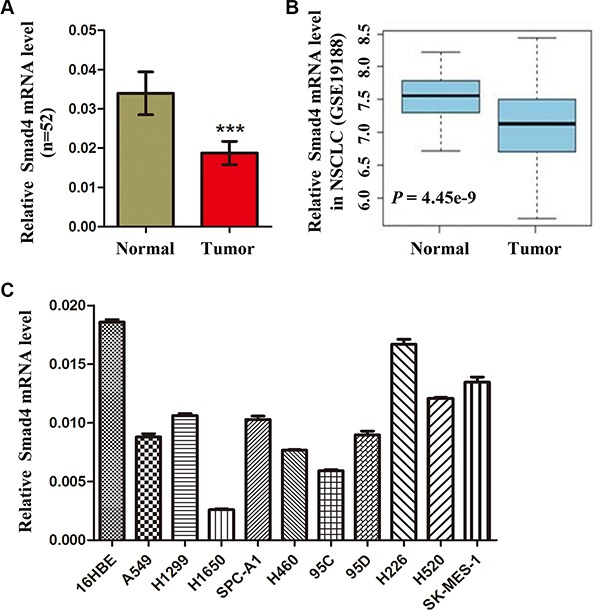
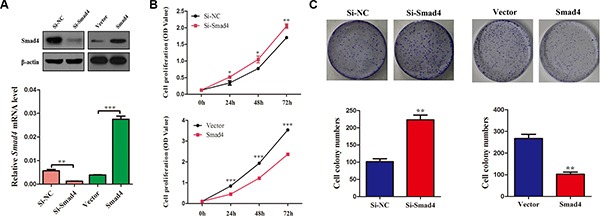
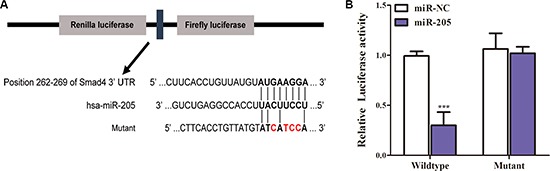
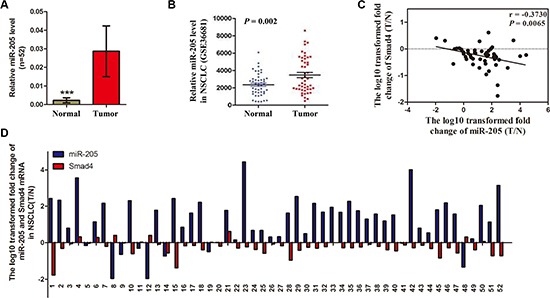
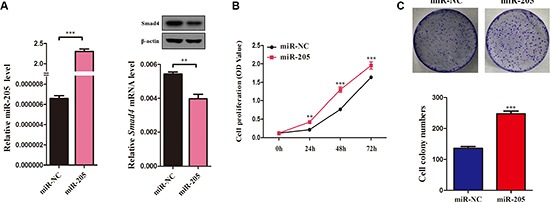
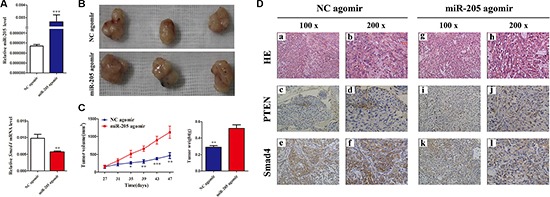
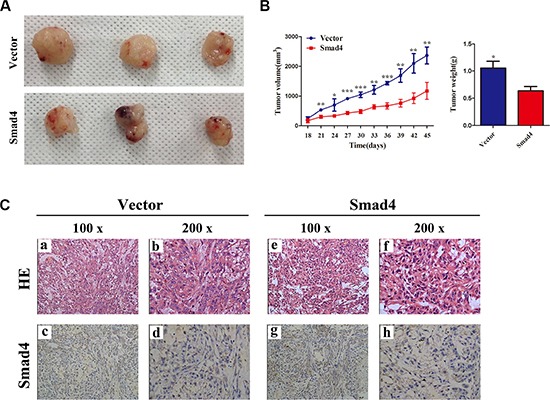
Despite advances in diagnosis and treatment, the survival of non-small cell lung cancer (NSCLC) patients remains poor; therefore, improved understanding of the disease mechanism and novel treatment strategies are needed. Downregulation of SMAD4 and dysregulated expression of miR-205 have been reported. However, the relationship between them remains unclear. We investigated the effect of microRNA (miR)-205 on the expression of SMAD4 in NSCLC. Knockdown and overexpression of SMAD4 promoted or suppressed cellular viability and proliferation, and accelerated or inhibited the cell cycle in NSCLC cells, respectively. The 3'-untranslated region (3'-UTR) of SMAD4 was predicted as a target of miR-205. Luciferase assays validated that miR-205 binds directly to the SMAD4 3'-UTR. Protein and mRNA expression analyses confirmed that miR-205 overexpression in NSCLC cells inhibited the expression of SMAD4 mRNA and protein. In human NSCLC tissues, increased miR-205 expression was observed frequently and was inversely correlated with decreased SMAD4 expression. Ectopic expression of miR-205 in NSCLC cells suppressed cellular viability and proliferation, accelerated the cell cycle, and promoted tumor growth of lung carcinoma xenografts in nude mice. Our study showed that miR-205 decreased SMAD4 expression, thus promoting NSCLC cell growth. Our findings highlighted the therapeutic potential of targeting miR-205 in NSCLC treatment.
Keywords: NSCLC; SMAD4; cell cycle; miR-205; proliferation.
Conflict of interest statement
We have no conflicts of interests to disclose.
Figures


Similar articles
-
miR-1238 inhibits cell proliferation by targeting LHX2 in non-small cell lung cancer.Oncotarget. 2015 Aug 7;6(22):19043-54. doi: 10.18632/oncotarget.4232. Oncotarget. 2015. PMID: 26189214 Free PMC article.
-
Knockdown of LncRNA PVT1 inhibits tumorigenesis in non-small-cell lung cancer by regulating miR-497 expression.Exp Cell Res. 2018 Jan 1;362(1):172-179. doi: 10.1016/j.yexcr.2017.11.014. Epub 2017 Nov 11. Exp Cell Res. 2018. PMID: 29133127
-
The candidate oncogene (MCRS1) promotes the growth of human lung cancer cells via the miR-155-Rb1 pathway.J Exp Clin Cancer Res. 2015 Oct 14;34:121. doi: 10.1186/s13046-015-0235-5. J Exp Clin Cancer Res. 2015. PMID: 26467212 Free PMC article.
-
Exosomal microRNA Therapy for Non-Small-Cell Lung Cancer.Technol Cancer Res Treat. 2023 Jan-Dec;22:15330338231210731. doi: 10.1177/15330338231210731. Technol Cancer Res Treat. 2023. PMID: 37936417 Free PMC article. Review.
-
MicroRNA-214 in Health and Disease.Cells. 2021 Nov 23;10(12):3274. doi: 10.3390/cells10123274. Cells. 2021. PMID: 34943783 Free PMC article. Review.
Cited by
-
miR-205 Expression Elevated With EDS Treatment and Induced Leydig Cell Apoptosis by Targeting RAP2B via the PI3K/AKT Signaling Pathway.Front Cell Dev Biol. 2020 Jun 9;8:448. doi: 10.3389/fcell.2020.00448. eCollection 2020. Front Cell Dev Biol. 2020. PMID: 32596241 Free PMC article.
-
MicroRNA‑373‑3p inhibits the proliferation and invasion of non‑small‑cell lung cancer cells by targeting the GAB2/PI3K/AKT pathway.Oncol Lett. 2024 Mar 22;27(5):221. doi: 10.3892/ol.2024.14353. eCollection 2024 May. Oncol Lett. 2024. PMID: 38586211 Free PMC article.
-
Icotinib and pemetrexed in treatment of lung adenocarcinoma and the effects on prognostic survival rate of patients.Oncol Lett. 2019 Oct;18(4):4153-4159. doi: 10.3892/ol.2019.10763. Epub 2019 Aug 16. Oncol Lett. 2019. PMID: 31516614 Free PMC article.
-
MiR-185 inhibits tumor growth and enhances chemo-resistance via targeting SRY-related high mobility group box transcription factor 13 in non-small-cell carcinoma.Am J Transl Res. 2018 Aug 15;10(8):2600-2609. eCollection 2018. Am J Transl Res. 2018. PMID: 30210696 Free PMC article.
-
Hsa-miR-335 enhances cell migration and invasion in lung adenocarcinoma through targeting Copine-1.MedComm (2020). 2021 Nov 4;2(4):810-820. doi: 10.1002/mco2.93. eCollection 2021 Dec. MedComm (2020). 2021. PMID: 34977878 Free PMC article.
References
-
- Jemal A, Bray F, Center MM, Ferlay J, Ward E, Forman D. Global cancer statistics. CA Cancer J Clin. 2011;61:69–90. - PubMed
-
- Wang T, Nelson RA, Bogardus A, Grannis FW., Jr Five-year lung cancer survival: which advanced stage nonsmall cell lung cancer patients attain long-term survival? Cancer. 2010;116:1518–1525. - PubMed
-
- Lewis BP, Burge CB, Bartel DP. Conserved seed pairing, often flanked by adenosines, indicates that thousands of human genes are microRNA targets. Cell. 2005;120:15–20. - PubMed
MeSH terms
Substances
LinkOut - more resources
Full Text Sources
Other Literature Sources
Medical
Miscellaneous
