Randomized Controlled Trial
. 2017 Feb 23;542(7642):445-449.
doi: 10.1038/nature21060. Epub 2017 Feb 15.

Sterile protection against human malaria by chemoattenuated PfSPZ vaccine

Affiliations
Randomized Controlled Trial

Sterile protection against human malaria by chemoattenuated PfSPZ vaccine

Benjamin Mordmüller et al. Nature. .

Abstract

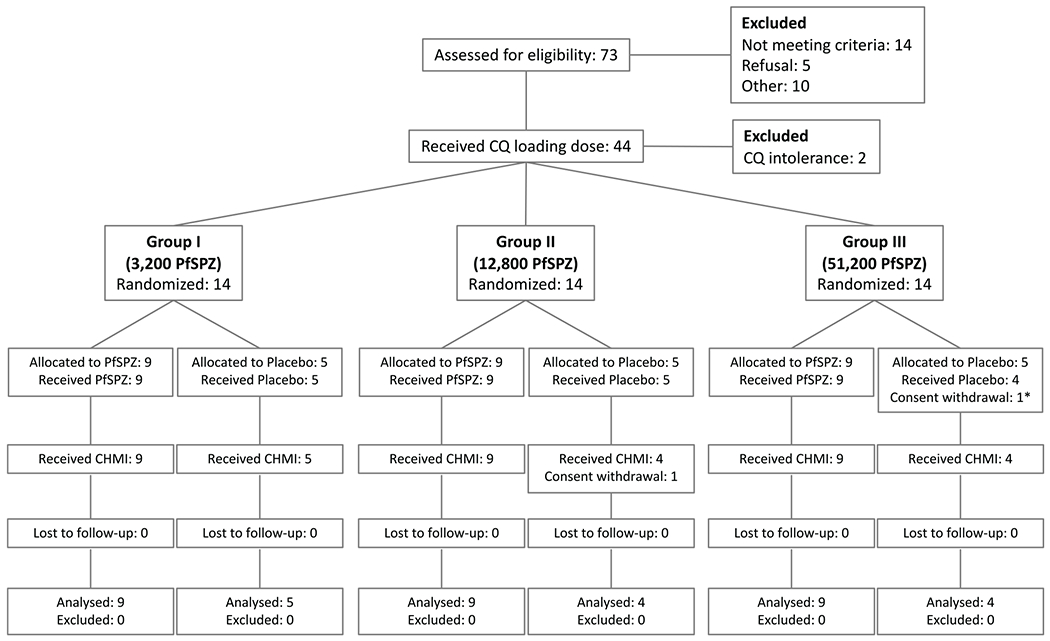
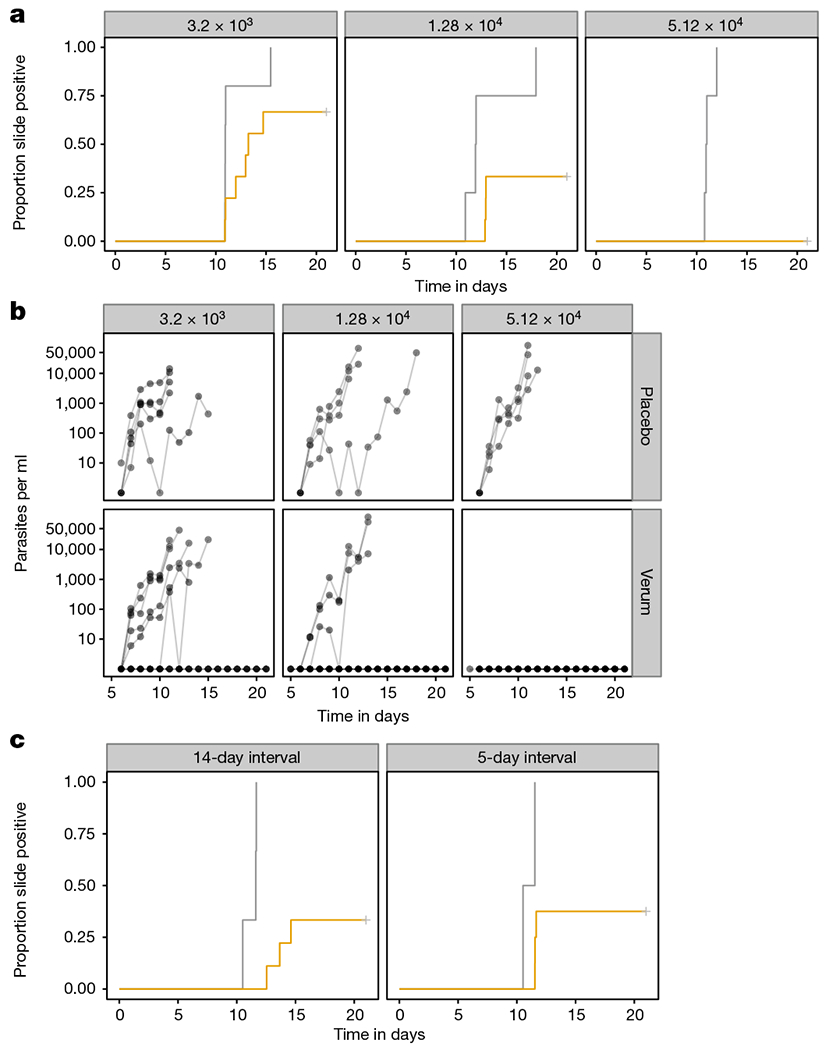
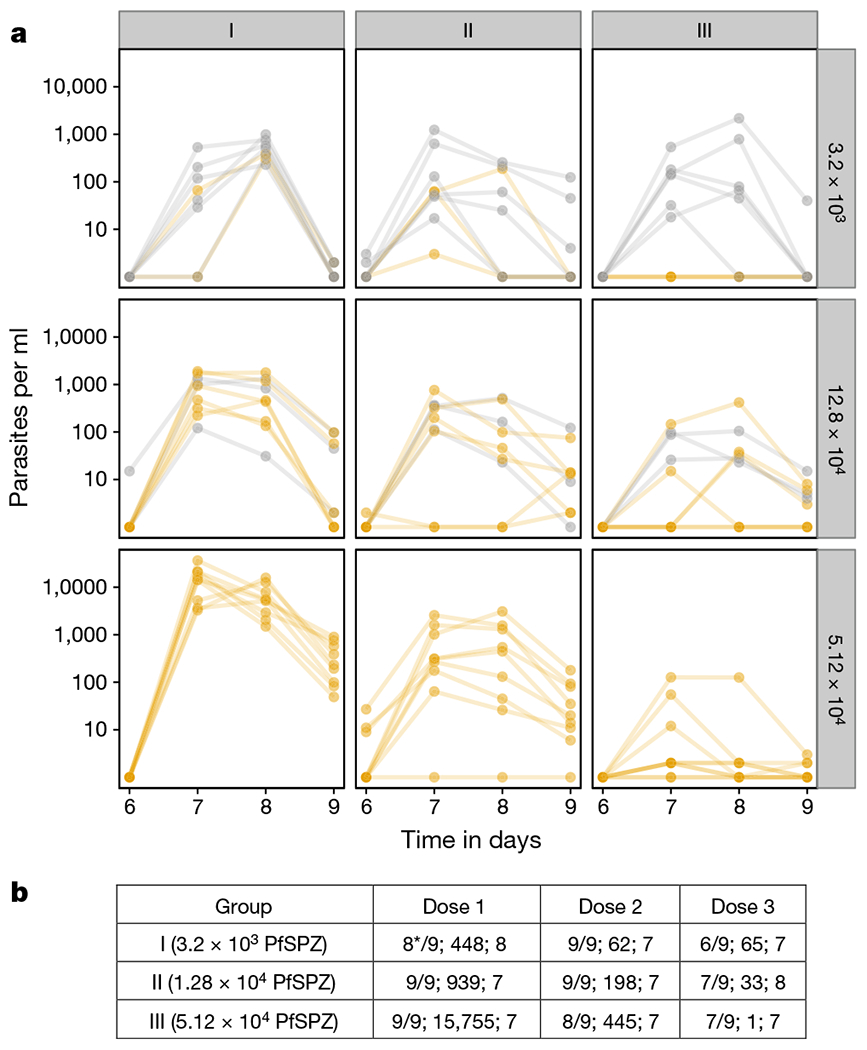
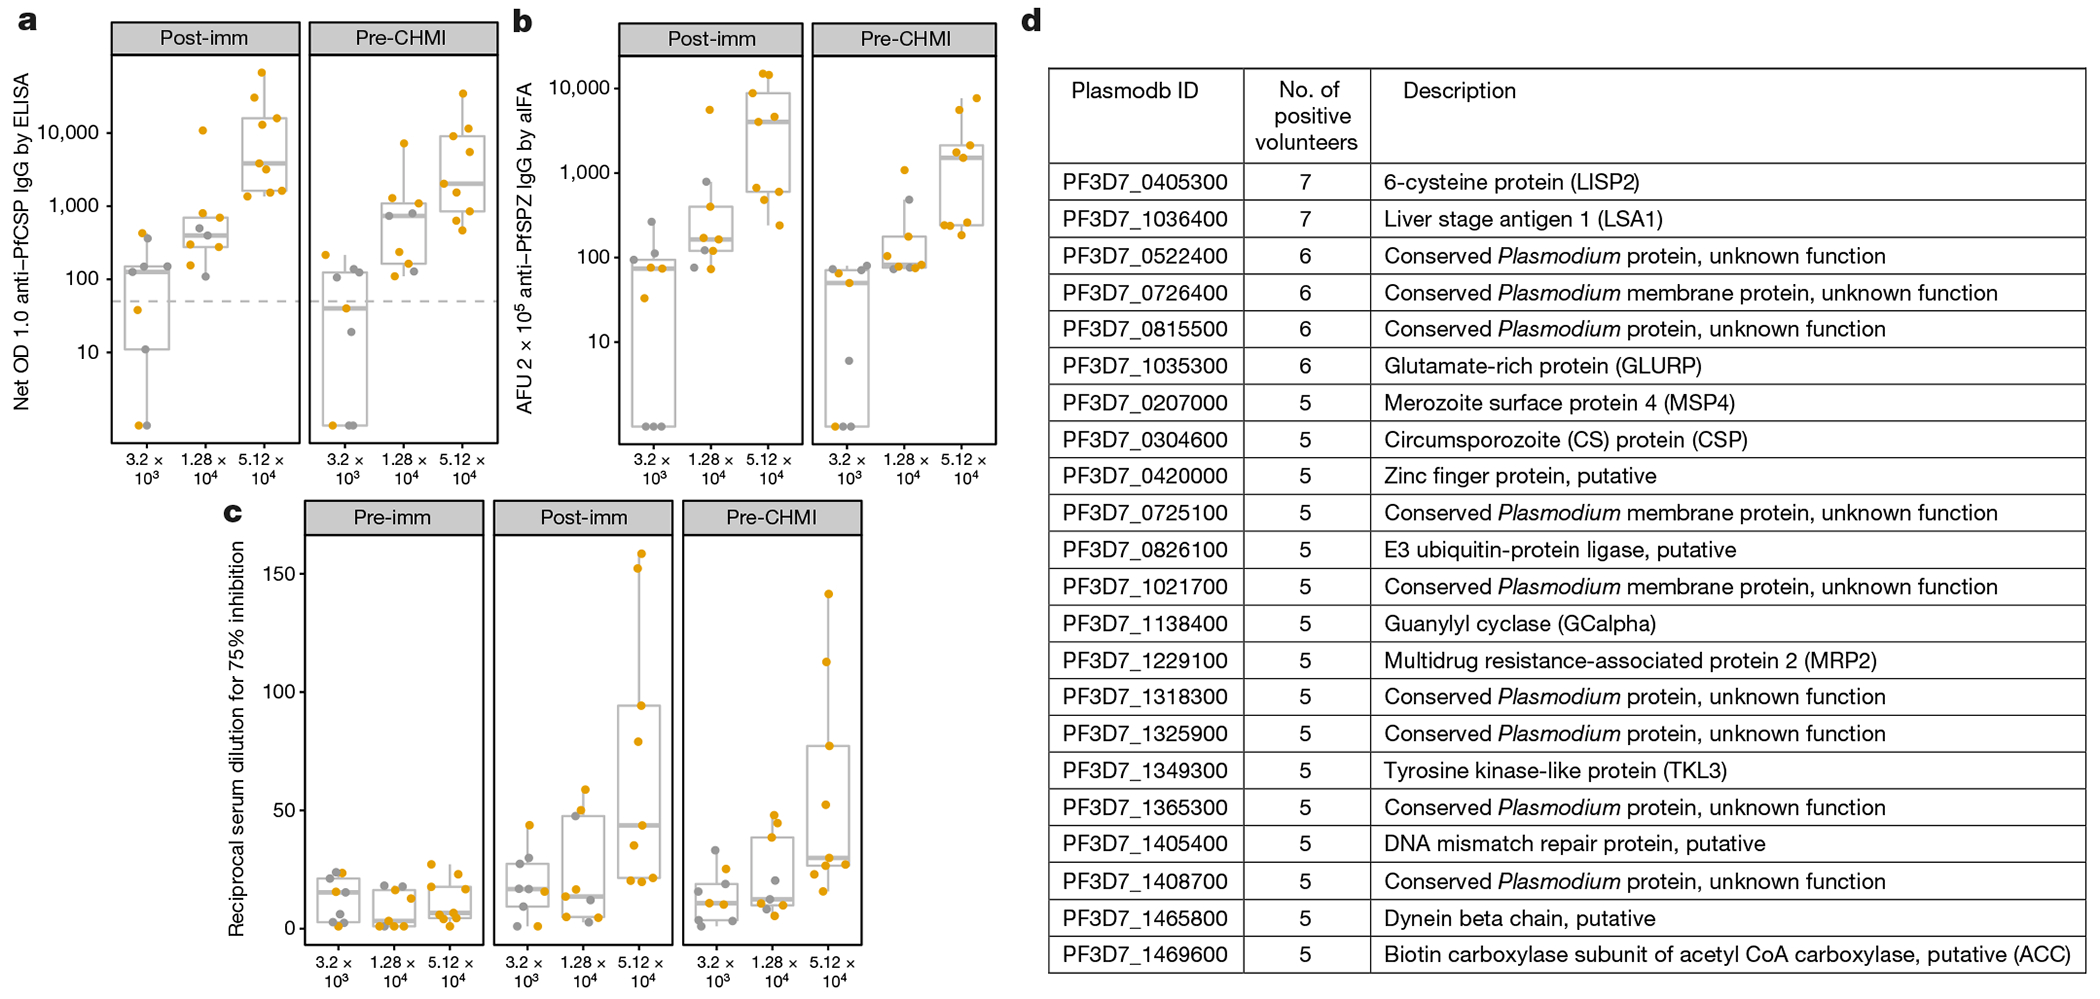
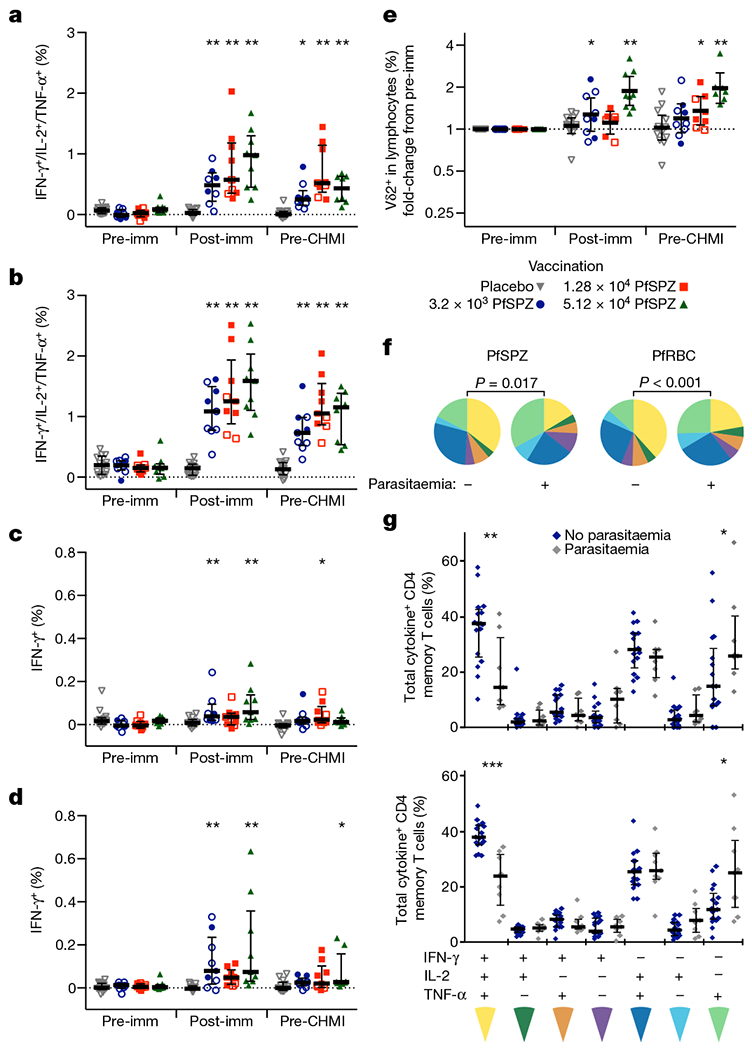
A highly protective malaria vaccine would greatly facilitate the prevention and elimination of malaria and containment of drug-resistant parasites. A high level (more than 90%) of protection against malaria in humans has previously been achieved only by immunization with radiation-attenuated Plasmodium falciparum (Pf) sporozoites (PfSPZ) inoculated by mosquitoes; by intravenous injection of aseptic, purified, radiation-attenuated, cryopreserved PfSPZ ('PfSPZ Vaccine'); or by infectious PfSPZ inoculated by mosquitoes to volunteers taking chloroquine or mefloquine (chemoprophylaxis with sporozoites). We assessed immunization by direct venous inoculation of aseptic, purified, cryopreserved, non-irradiated PfSPZ ('PfSPZ Challenge') to malaria-naive, healthy adult volunteers taking chloroquine for antimalarial chemoprophylaxis (vaccine approach denoted as PfSPZ-CVac). Three doses of 5.12 × 10⁴ PfSPZ of PfSPZ Challenge at 28-day intervals were well tolerated and safe, and prevented infection in 9 out of 9 (100%) volunteers who underwent controlled human malaria infection ten weeks after the last dose (group III). Protective efficacy was dependent on dose and regimen. Immunization with 3.2 × 10³ (group I) or 1.28 × 10⁴ (group II) PfSPZ protected 3 out of 9 (33%) or 6 out of 9 (67%) volunteers, respectively. Three doses of 5.12 × 10⁴ PfSPZ at five-day intervals protected 5 out of 8 (63%) volunteers. The frequency of Pf-specific polyfunctional CD4 memory T cells was associated with protection. On a 7,455 peptide Pf proteome array, immune sera from at least 5 out of 9 group III vaccinees recognized each of 22 proteins. PfSPZ-CVac is a highly efficacious vaccine candidate; when we are able to optimize the immunization regimen (dose, interval between doses, and drug partner), this vaccine could be used for combination mass drug administration and a mass vaccination program approach to eliminate malaria from geographically defined areas.


Conflict of interest statement

The authors declare competing financial interests: details are available in the online version of the paper. Readers are welcome to comment on the online version of the paper.

Figures

Extended Data Figure 1 |
Extended Data Figure 1 |. Distribution of adverse events.
a, b, The number of adverse events (AEs) regardless of attribution to investigational product. Each bar represents one volunteer sorted on the number of adverse events from the time of first injection with normal saline (controls) or PfSPZ-CVac until the time of CHMI, approximately 17 weeks later (a) and adverse events in the same volunteers from initiation of CHMI until the end of follow-up (b). Mild (grade 1) adverse events are depicted in grey, moderate (grade 2) in yellow and severe (grade 3) in blue. Non-protected volunteers are marked with an ‘M’ on the x axis.
Extended Data Figure 2 |
CONSORT study flow chart. *Participant received only the first Placebo injection
Extended Data Figure 3 |
Extended Data Figure 3 |. CD4 T-cell cytokine polyfunctionality.
PBMCs from subjects were drawn 14 days after third immunization (post-imm) or 1 day before CHMI (pre-CHMI), stimulated with PfSPZ, PfRBC, or stimulation controls, and stained for intracellular cytokine expression. a, b, The pie charts show the proportion of memory CD4 T cells expressing any combination of IFN-γ, IL-2, or TNF-α for each dose group after stimulation with PfSPZ (a) or PfRBC (b). Responses are background subtracted from control antigen stimulations 1% HSA or uninfected erythrocytes. c, d, The magnitude of the memory CD4 T-cell response for each combination of cytokines is shown in c and d. There is a trend towards higher polyfunctionality as dose increases. e, f, The median fluorescence intensity (MFI) for IFN-γ is shown for the different combination of IFN-γ+ cells following PfSPZ or PfRBC stimulation. Cells that simultaneously produce IFN-γ, IL-2, and TNF-α have the highest IFN-γ MFI.
Extended Data Figure 4 |
Extended Data Figure 4 |. T-cell immunogenicity.
a, b, Memory CD4 T cells producing IL-4 (a) or IL-10 (b) after PfRBC stimulation. Memory γδ T cells producing IFN-γ, IL-2, or TNF-α following PfSPZ (c) or PfRBC stimulation (d). For ad, results are the percentage of cytokine-producing cells after incubation with PfSPZ minus the percentage of cells after incubation with vaccine diluent (medium with 1% HSA) as control or percentage of cytokine-producing cells after incubation with asexual Pf-infected red blood cells (PfRBC) minus uninfected RBCs as control. e, f, Total memory γδ T cells assessed before immunization (pre-imm) and 14 days after third immunization (post-imm) for the percentage of cells expressing CD38. The absolute frequencies are shown in e and the change from pre-vaccination to post-vaccination is shown in f. For ad, within a dose group, the difference from pre-vaccine was assessed by two-way ANOVA with Bonferroni correction. Data are median ± interquartile range. For e, f, difference from pre-vaccine was assessed by Wilcoxon signed rank test. P values were corrected for multiple comparisons by the Bonferroni method. *P < 0.05, *P < 0.01. Data are median ± interquartile range. Pre-imm, 3 days before first immunization; post-imm, 14 days after third immunization; pre-CHMI, 1 day before CHMI.
Extended Data Figure 5 |
Extended Data Figure 5 |. Sub-family analysis of γδ T cells.
af, The frequency of the circulating γδ T-cell subsets as a percentage of total lymphocytes was assessed in unstimulated PBMCs before the first immunization (pre-imm), 2 weeks after final immunization (post-imm), and the day before CHMI (pre-CHMI). Fold change compared to pre-imm is shown for total memory γδ T cells (a), Vγ9+Vδ2+ (b), Vγ9+Vδ1+ (c), Vγ9Vδ1+ (d), Vγ9+Vδ1Vδ2 (e), and Vγ9Vδ1Vδ2 (f) subfamilies. The frequency of Vγ9Vδ2+ subset is low to undetectable. Within a dose group, the difference from pre-imm was assessed by two-way ANOVA with Bonferroni correction. *P < 0.05, **P < 0.01. Data are geometric mean ± 95% CI.
Extended Data Figure 6 |
Extended Data Figure 6 |. Anti-plasmodial antibody responses in vaccinated volunteers who were immunized with three doses of 5.12 × 10⁴ PfSPZ at 28-day, 14-day, or 5-day intervals.
Antibodies to PfCSP by ELISA were assessed in sera taken before any immunizations (pre-immunization), two weeks following last immunization (post-immunization) and 10 weeks after last immunization, which was one day before CHMI (pre-CHMI). PfCSP ELISA results are reported as net OD 1.0; the reciprocal serum dilution at which the optical density was 1.0 in post-immunization or pre-CHMI sera minus the OD 1.0 in pre-immunization sera. All values met criteria for positivity. Protected volunteers are represented by yellow circles and unprotected volunteers by grey circles.
Extended Data Figure 7 |
Extended Data Figure 7 |. Development of PfSPZ Vaccine and PfSPZ-CVac in hepatocytes.
Radiation-attenuated PfSPZ in PfSPZ Vaccine invade hepatocytes and partially develop, but do not replicate. They are metabolically active and non-replicating. Infectious PfSPZ in PfSPZ-CVac invade hepatocytes and fully develop. A single PfSPZ replicates exponentially producing more than 104 merozoites. These merozoites are released into the circulation, and each merozoite can invade a different erythrocyte. Chloroquine prevents complete parasite development within erythrocytes, thereby preventing the development of merozoites that can invade new erythrocytes.
Extended Data Figure 8 |
Extended Data Figure 8 |. Transient parasitaemia following vaccination at 5-day intervals.
Parasitaemia measured by qPCR over 22 days. The subjects who were protected and not protected against CHMI are in yellow and grey, respectively. The times of PfSPZ inoculations are shown as vertical red lines and the time of last CQ administration as a vertical blue line. CQ was given as 10 mg kg−1 (maximum 620 mg) loading dose on day 0 followed by 5 mg kg−1 (maximum 310 mg) chloroquine base on days 5, 10, and 15.
Figure 1 |
Figure 1 |. Protective efficacy of PfSPZ-CVac.
a, Proportion of controls and vaccinees who developed microscopically detectable parasitaemia after CHMI by DVI of 3.2 × 10³ PfSPZ Challenge, 8–10 weeks after last immunization, and 7–9 weeks after last dose of chloroquine. Vaccinees received three doses of 3.2 × 10³ (n = 9), 1.28 × 10⁴ (n = 9), or 5.12 × 10⁴ (n = 9) PfSPZ and controls (n = 13) received three doses of normal saline (vaccinees in yellow, placebo recipients in grey). b, Parasitaemia over time measured by qPCR. c, Proportion of controls and vaccinees who developed microscopically detectable parasitaemia after CHMI by DVI of 3.2 × 10³ PfSPZ Challenge 70–72 days after last immunization, and 65–67 days after last dose of chloroquine. Vaccinees received three doses of 5.12 × 10⁴ PfSPZ at 14-day (n = 9) and 5-day intervals (n = 9) PfSPZ and controls (n = 6) received three doses of normal saline (vaccinees in yellow, placebo recipients in grey). One vaccinee in the 5-day interval group and one control did not participate in the CHMI.
Figure 2 |
Figure 2 |. Transient parasitaemia following vaccination.
a, Parasitaemia measured by qPCR in the three dosage groups after each immunization. The subjects who were protected and not protected against CHMI are in yellow and grey, respectively. b, Number of subjects positive per number injected, median peak parasite density, and day of peak parasite density after each dose of PfSPZ-CVac. *Technical problem with day 7 and 8 samples of one volunteer.
Figure 3 |
Figure 3 |. Anti-plasmodial antibody responses in vaccinated volunteers.
Antibodies were assessed in sera taken before any immunizations (pre-immunization), two weeks following last immunization (post-immunization) and one day before CHMI (pre-CHMI). ad, Antibodies were assessed to PfCSP by ELISA (a); air-dried PfSPZ by automated immunofluorescence assay (b); live PfSPZ by inhibition of sporozoite invasion (c); and 7,455 Pf peptides on a proteome array (d). a, PfCSP ELISA results are reported as net optical density (OD) 1.0; reciprocal serum dilution at which the optical density was 1.0 in post-immunization or pre-CHMI sera minus the OD 1.0 in pre-immunization sera. All negative net values were assigned a value of 1. Values above the dashed line are considered positive. b, Automated immunofluorescence assay (aIFA) results are reported as arbitrary fluorescent units (AFU) 2 × 10⁵; reciprocal serum dilution at which the AFU were 2 × 10⁵ in post-immunization and pre-CHMI sera. c, Inhibition of sporozoite invasion values are reported as the reciprocal dilution of pre-immunization, post-immunization and pre-CHMI sera that inhibited by 75% the numbers of PfSPZ invading as compared to in negative controls without serum. d, The 22 proteins on the proteome array recognized by post-immunization sera from at least five volunteers from group III (highest dose) are delineated. The list is derived from bipartite graph analysis following normalization and background correction using values from sera taken before injection of PfSPZ Challenge in vaccinees and controls, and after injection of normal saline in controls. The threshold of positivity for the array studies was more conservative compared to the ELISA analyses; for example, for PfCSP, 5 out of 9 array-positive compared to 9 out of 9 ELISA-positive. In ac, protected individuals are represented in yellow and unprotected ones in grey, and box plots display median (middle line), 25th (lower hinge) and 75th (upper hinge) quartile. Whiskers extend to values within 1.5× the inter-quartile ranges of the lower and upper hinges, respectively.
Figure 4 |
Figure 4 |. T-cell immunogenicity and correlates of protection.
a, b, Memory CD4 T cells producing IFN-γ, IL-2, and/or TNF-α following PfSPZ (a) or PfRBC stimulation (b). c, d, Memory CD8 T cells producing IFN-γ following PfSPZ (c) or PfRBC stimulation (d). For ad, results are the percentage of cytokine-producing cells after incubation with Pf antigen minus the percentage of cells after incubation with control antigen stimulation. e, Fold change compared to pre-immunization in the frequency of Vδ2+ T cells as a percentage of total lymphocytes. f, Cytokine polyfunctionality of PfSPZ- or PfRBC-specific memory CD4 T cells. Pie charts show the fraction of each cytokine combination out of the total cytokine response comparing subjects that were parasitaemic (+) or not parasitaemic (−) after CHMI. g, Individual data points for f, showing the composition of PfSPZ- (top) or PfRBC-specific (bottom) memory CD4 T cells producing any combination of IFN-γ, IL-2, and/or TNF-α at the time of CHMI. Subjects that remained without parasitaemia are shown in blue and subjects that developed parasitaemia are shown in grey. ae, The difference from pre-vaccine within a dose group was assessed by two-way ANOVA with Bonferroni correction. Open symbols denote parasitaemic after CHMI; closed symbols denote not parasitaemic after CHMI. f, Comparison between pie graphs was by a non-parametric partial permutation test; g, comparison between parasitaemic and not parasitaemic responses was by Wilcoxon test. Bars are median ± interquartile range (ad, g) or geometric mean and 95% confidence interval (e). Pre-imm, 3 days before first immunization; post-imm, 14 days after third immunization; pre-CHMI, 1 day before CHMI. *P < 0.05, **P < 0.01, *** P < 0.001.

References

    1. malERA Consultative Group on Vaccines. A research agenda for malaria eradication: vaccines. PLoS Med. 8, e1000398 (2011). - PMC - PubMed
    1. Clyde DF, Most H, McCarthy VC & Vanderberg JP Immunization of man against sporozite-induced falciparum malaria. Am. J. Med. Sci 266, 169–177 (1973). - PubMed
    1. Rieckmann KH, Carson PE, Beaudoin RL, Cassells JS & Sell KW Letter: Sporozoite induced immunity in man against an Ethiopian strain of Plasmodium falciparum. Trans. R. Soc. Trop. Med. Hyg 68, 258–259 (1974). - PubMed
    1. Hoffman SL et al. Protection of humans against malaria by immunization with radiation-attenuated Plasmodium falciparum sporozoites. J. Infect. Dis 185, 1155–1164 (2002). - PubMed
    1. Seder RA et al. Protection against malaria by intravenous immunization with a nonreplicating sporozoite vaccine. Science 341, 1359–1365 (2013). - PubMed

Publication types

MeSH terms