. 2017 Feb 15;12(2):e0171873.
doi: 10.1371/journal.pone.0171873. eCollection 2017.

Cortical porosity not superior to conventional densitometry in identifying hemodialysis patients with fragility fracture

Affiliations

Cortical porosity not superior to conventional densitometry in identifying hemodialysis patients with fragility fracture

Bernhard Bielesz et al. PLoS One. .

Abstract

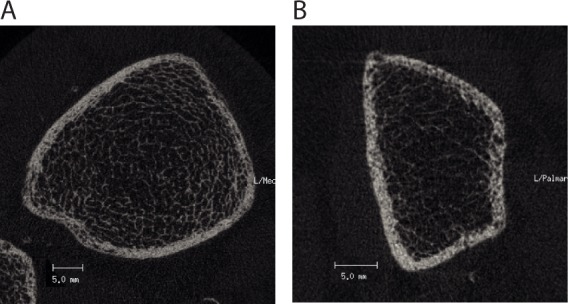
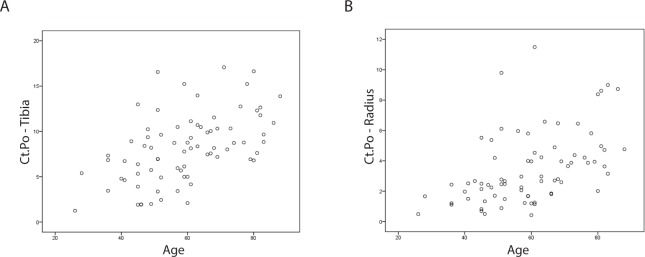
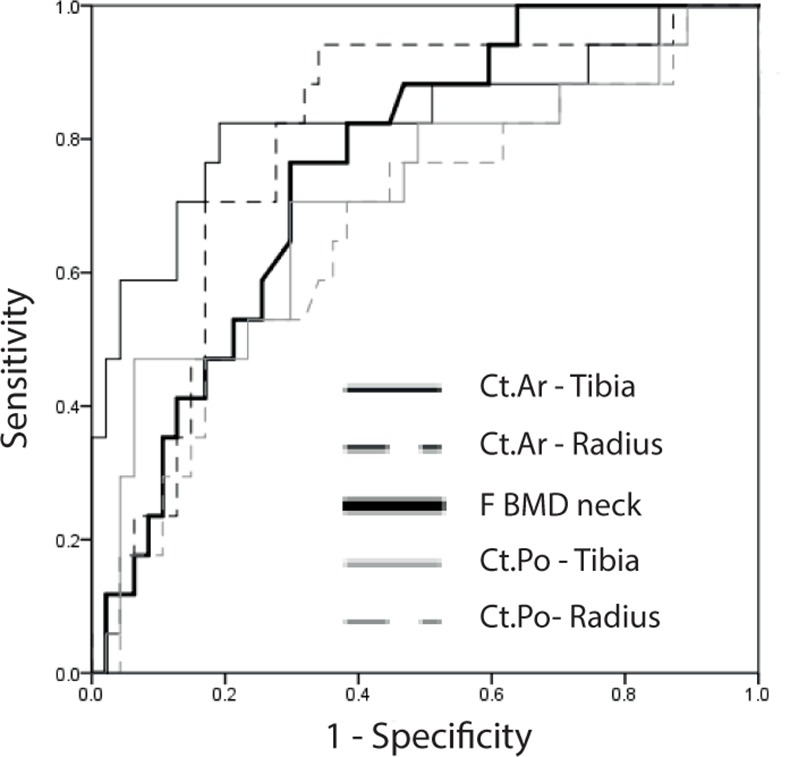
Hemodialysis (HD) patients face increased fracture risk, which is further associated with elevated risk of hospitalization and mortality. High-resolution peripheral computed tomography (HR-pQCT) has advanced our understanding of bone disease in chronic kidney disease by characterizing distinct changes in both the cortical and trabecular compartments. Increased cortical porosity (Ct.Po) has been shown to be associated with fracture in patients with osteopenia or in postmenopausal diabetic women. We tested whether the degree of Ct.Po identifies hemodialysis patients with prevalent fragility fractures in comparison to bone mineral density (BMD) assessed by dual X-ray absorptiometry (DXA). We performed a post-hoc analysis of a cross-sectional study in 76 prevalent hemodialysis patients. Markers of mineral metabolism, coronary calcification score, DXA-, and HR-pQCT-data were analyzed, and Ct.Po determined at radius and tibia. Ct.Po was significantly higher in patients with fracture but association was lost after adjusting for age and gender (tibia p = 0.228, radius p = 0.5). Instead, femoral (F) BMD neck area (p = 0.03), F T-score neck area (p = 0.03), radius (R) BMD (p = 0.03), R T-score (p = 0.03), and cortical HR-pQCT indices such as cortical area (Ct.Ar) (tibia: p = 0.01; radius: p = 0.02) and cortical thickness (Ct.Th) (tibia: p = 0.03; radius: p = 0.02) correctly classified patients with fragility fractures. Area under receiver operating characteristic curves (AUC) for Ct.Po (tibia AUC: 0.711; p = 0.01; radius AUC: 0.666; p = 0.04), Ct.Ar (tibia AUC: 0.832; p<0.001; radius AUC: 0.796; p<0.001), and F neck BMD (AUC: 0.758; p = 0.002) did not differ significantly among each other. In conclusion, measuring Ct.Po is not superior to BMD determined by DXA for identification of HD patients with fragility fracture.


Conflict of interest statement

Competing Interests: Janina Patsch is member of the Advisory Board, Roche Diagnostics and received travel support from Bayer. Other authors: None. This does not alter our adherence to PLOS ONE policies on sharing data and materials.

Figures

Fig 1
Fig 1. HR-pQCT sections of tibia and radius.
Representative images of tibia (A) and radius (B) from hemodialysis patients with high cortical porosity. (A): tBV/TV (%): 14.6, Ct.Po (%): 11.54; (B): tBV/TV (%): 7.7, Ct.Po (%): 11.49.
Fig 2
Fig 2
Association of Ct.Po and age in hemodialysis patients in the tibia (A) and radius (B).
Fig 3
Fig 3. ROC curves: F neck BMD, Ct.Ar, and Ct.Po of tibia and radius discriminating fracture.
Higher area under the curve (AUC) indicates a more favorable sensitivity-specificity profile. The ROC curves of Ct.Po (radius and tibia) are compared to the ROC curves with the highest AUC among HR-pQCT parameters (Ct.Ar of radius and tibia) and densitometric parameters (F neck BMD). For exact AUC values see Table 4; De-Long comparisons of ROC curves: Tibia: Ct.Po vs. Ct.Ar: p = 0.19; Ct.Po vs. F BMD neck: p = 0.6; Ct.Ar vs. F BMD neck: p = 0.27; Radius: Ct.Po vs. Ct.Ar: p = 0.2; Ct.Po vs. F BMD neck: p = 0.34; Ct.Ar vs. F BMD neck: p = 0.59; ROC: receiver-operating-characteristic; Ct.Po: cortical porosity; Ct.Ar: cortical area; BMD: bone mineral density; F: femur.

Similar articles

Cited by

References

    1. Naylor KL, McArthur E, Leslie WD, Fraser LA, Jamal SA, Cadarette SM, et al. The three-year incidence of fracture in chronic kidney disease. Kidney Int. 2014;86(4):810–8. 10.1038/ki.2013.547 - DOI - PubMed
    1. Tentori F, McCullough K, Kilpatrick RD, Bradbury BD, Robinson BM, Kerr PG, et al. High rates of death and hospitalization follow bone fracture among hemodialysis patients. Kidney Int. 2014;85(1):166–73. PubMed Central PMCID: PMCPMC3910091. 10.1038/ki.2013.279 - DOI - PMC - PubMed
    1. Kidney Disease: Improving Global Outcomes CKDMBDWG. KDIGO clinical practice guideline for the diagnosis, evaluation, prevention, and treatment of Chronic Kidney Disease-Mineral and Bone Disorder (CKD-MBD). Kidney Int Suppl. 2009;(113):S1–130. 10.1038/ki.2009.188 - DOI - PubMed
    1. Cejka D, Patsch JM, Weber M, Diarra D, Riegersperger M, Kikic Z, et al. Bone microarchitecture in hemodialysis patients assessed by HR-pQCT. Clin J Am Soc Nephrol. 2011;6(9):2264–71. PubMed Central PMCID: PMCPMC3358993. 10.2215/CJN.09711010 - DOI - PMC - PubMed
    1. Jamal S, Cheung AM, West S, Lok C. Bone mineral density by DXA and HR pQCT can discriminate fracture status in men and women with stages 3 to 5 chronic kidney disease. Osteoporos Int. 2012;23(12):2805–13. 10.1007/s00198-012-1908-y - DOI - PubMed

MeSH terms