. 2017 Feb 14;18(7):1660-1673.
doi: 10.1016/j.celrep.2017.01.059.

The Survival of Motor Neuron Protein Acts as a Molecular Chaperone for mRNP Assembly

Affiliations

The Survival of Motor Neuron Protein Acts as a Molecular Chaperone for mRNP Assembly

Paul G Donlin-Asp et al. Cell Rep. .

Abstract

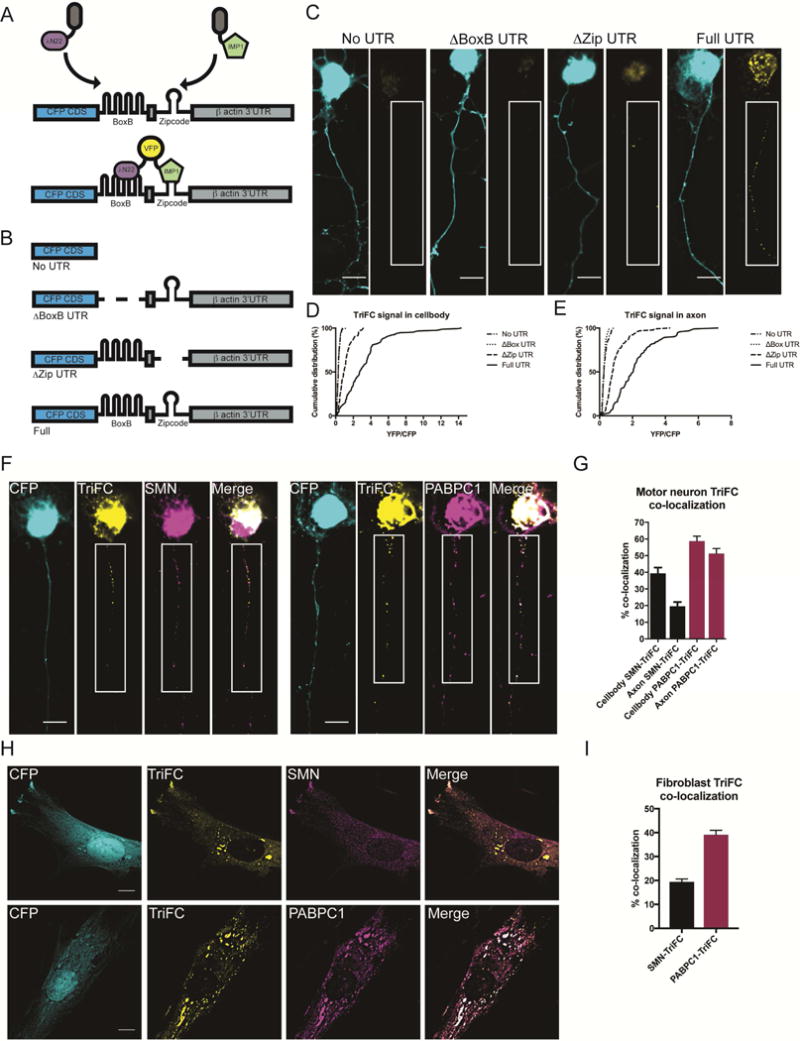
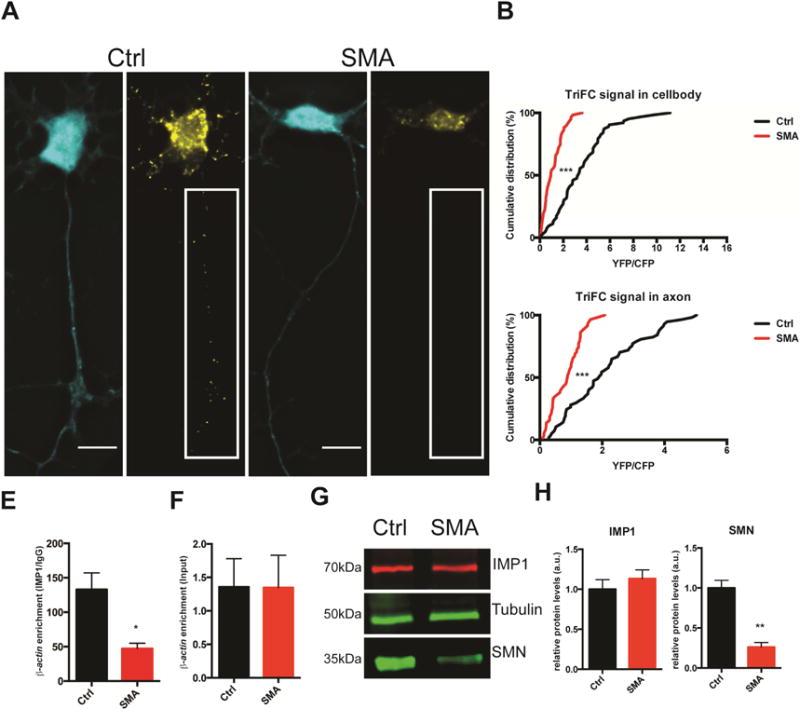
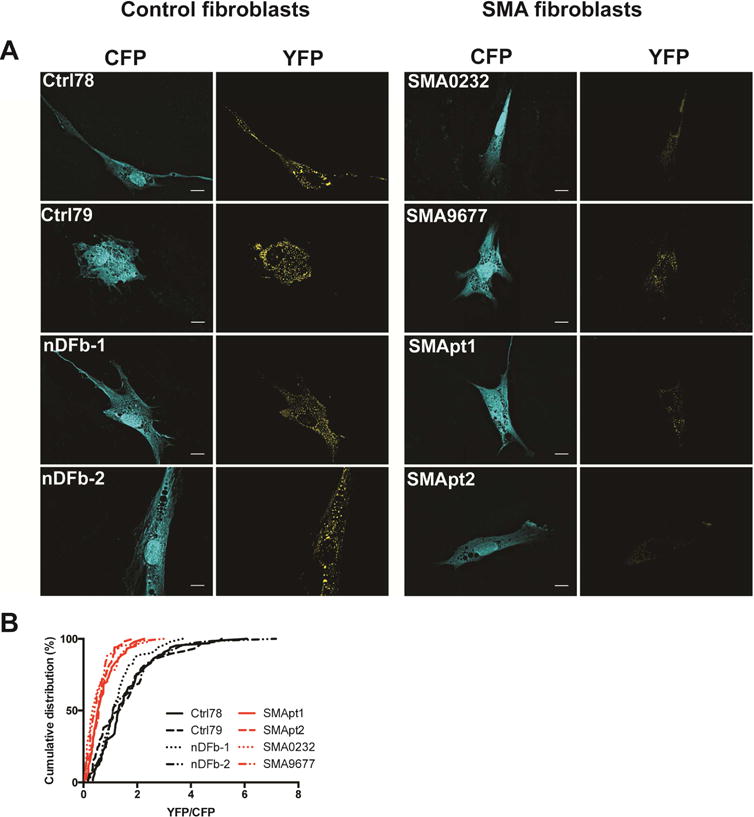
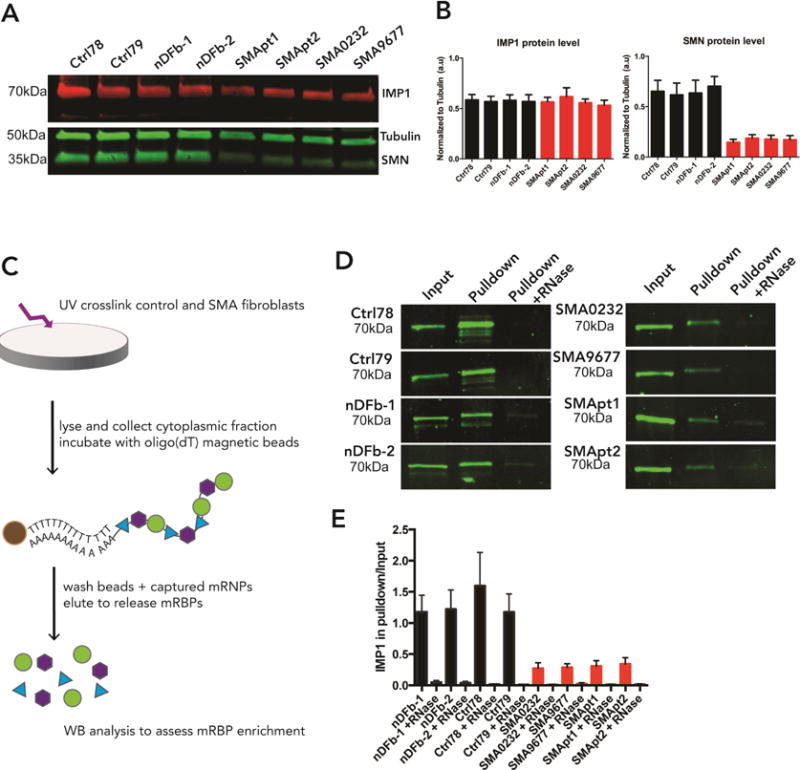
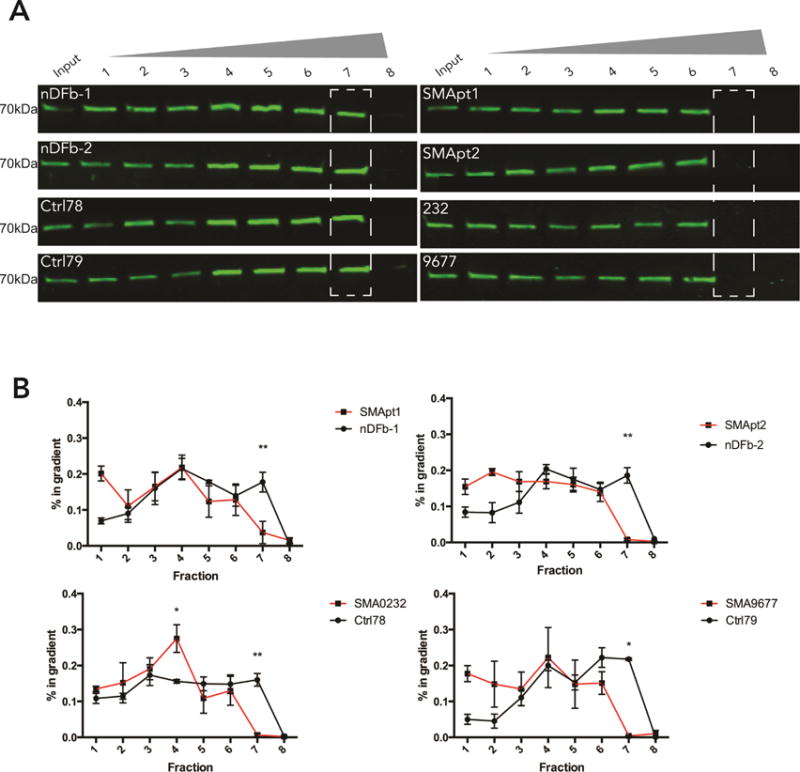
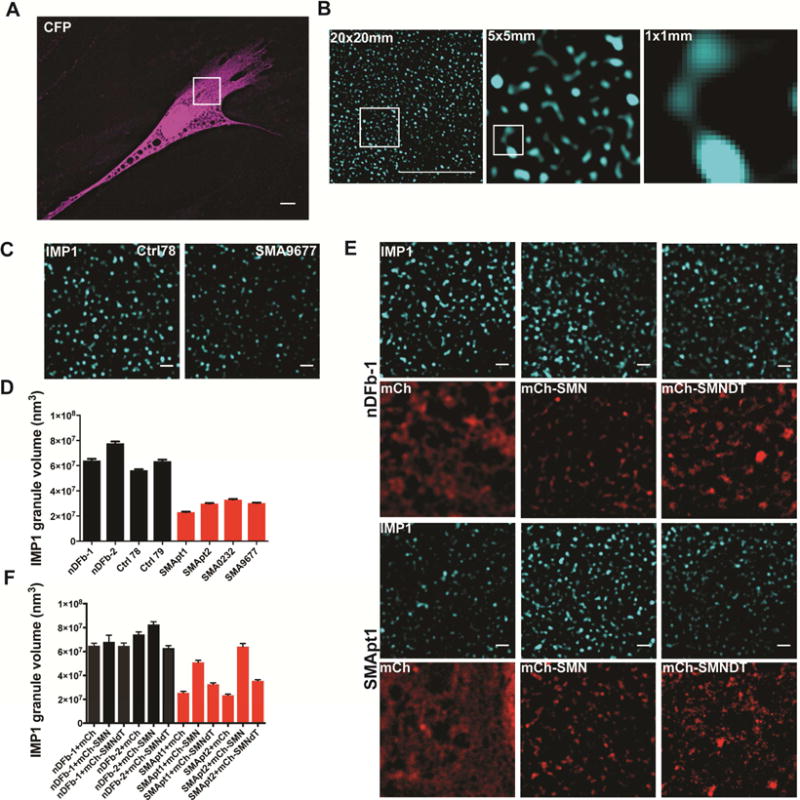
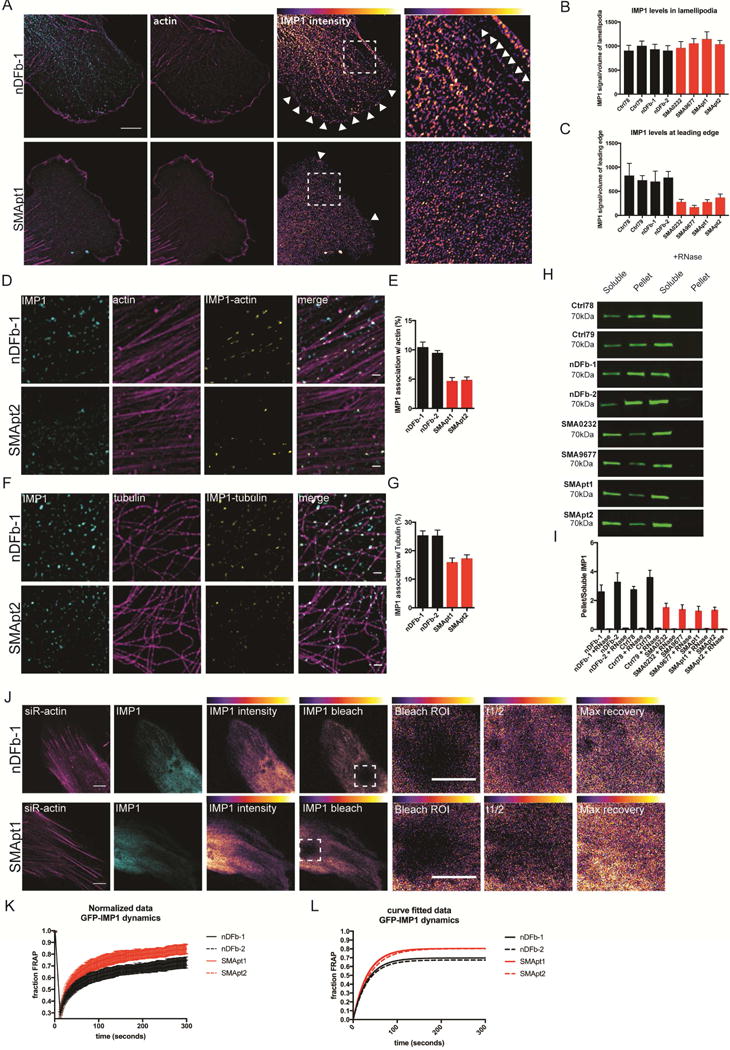
Spinal muscular atrophy (SMA) is a motor neuron disease caused by reduced levels of the survival of motor neuron (SMN) protein. SMN is part of a multiprotein complex that facilitates the assembly of spliceosomal small nuclear ribonucleoproteins (snRNPs). SMN has also been found to associate with mRNA-binding proteins, but the nature of this association was unknown. Here, we have employed a combination of biochemical and advanced imaging methods to demonstrate that SMN promotes the molecular interaction between IMP1 protein and the 3' UTR zipcode region of β-actin mRNA, leading to assembly of messenger ribonucleoprotein (mRNP) complexes that associate with the cytoskeleton to facilitate trafficking. We have identified defects in mRNP assembly in cells and tissues from SMA disease models and patients that depend on the SMN Tudor domain and explain the observed deficiency in mRNA localization and local translation, providing insight into SMA pathogenesis as a ribonucleoprotein (RNP)-assembly disorder.

Keywords: IMP1; SMA; SMN; beta actin mRNA; mRNA localization; mRNP; spinal muscular atrophy.


Figures

Figure 1
Figure 1
Trimolecular Fluorescence Complementation (TriFC) allows visualization of RNA and protein association in situ. A. Schematic of TriFC methodology. Upon expression of IMP1 and λN22 fused to complimentary fragments of venus yellow fluorescent protein, only binding of both fusion proteins to the same mRNA reporter will lead to reconstitution of the fluorescent protein. B. Reporter constructs include the entire β-actin 3′ untranslated region (Full UTR), a negative control lacking the 3′UTR (no UTR), a control lacking the binding site for the bacteriophage RNA-binding protein λN22 binding site (ΔBoxB UTR), and one lacking the main IMP1-binding “zipcode” region (ΔZip UTR.). C. Example images of TriFC controls in primary murine motor neurons. YFP intensities were normalized in all examples. For axonal segments in white boxes brightness and contrast were enhanced to highlight axonal granule signal (insets). Scale bar = 10 μm. D. Quantification of YFP/CFP signals for the cell body. Analyzed by Tukey’s multiple comparisons, for breakdown of statistical comparisons see Table S1. N=5, >50 cells/condition. Mean ± SEM; No UTR: .319 ± .0190, ΔBox UTR: .314 ±. 015, ΔZip UTR: 1.10 ± .076, Full UTR: 3.22 ± .209. E. Quantification of YFP/CFP signals for the axon. Analyzed by Tukey’s multiple comparisons, for breakdown of statistical comparisons see Table S2. N=5, >50 cells/condition. Mean ± SEM; No UTR: .311 ± .018, ΔBox UTR: .277 ± .011, ΔZip UTR: .990 ± .073, Full UTR: 2.24 ± .141. F. Example images of TriFC signal localization relative to SMN (left) or PABPC1 (right) in primary murine motor neurons. For enlarged axonal segments in white boxes, brightness and contrast were enhanced to highlight axonal granule signal (insets). Scale bar = 10 μm. G. Quantification of co-localization of TriFC signal with SMN and PABPC1 for the axon and cell body. N=4, >40 cells/condition. Mean ± SEM; Cell body SMN-TriFC: 39.39% ± 3.454%, Axon SMN-TriFC: 19.6% ± 2.531%, Cell body PABPC1-TriFC: 58.77% ± 2.944%, Axon PABPC1- TriFC: 51.26% ± 3.012%. H. Example images of TriFC signal localization relative to SMN (top) or PABPC1 (bottom) in primary human fibroblasts. Scale bar = 10 μm. I. Quantification of co-localization of TriFC signal with SMN and PABPC1. N=3, 50 cells/condition. Mean ± SEM; SMN-TriFC: 19.44% ± 1.221%, PABPC1-TriFC: 39.09% ± 1.892%.
Figure 2
Figure 2
IMP1 and β-actin association is reduced in an SMA mouse model. A. TriFC in SMA motor neurons show reduced IMP1–β-actin granule assembly relative to wild type littermate controls. Scale bar =10 μm. B. Quantification of cell body and axonal TriFC signal. n=3, >50 cells/condition. Analyzed by Kolmogrov-Smirnov test, p<.0001. Cell body values mean ± SEM; Ctrl: 3.555 ± .288, SMA: 1.130 ± .108; axon values for mean ± SEM; Ctrl: 2.098 ± .169, SMA: .851 ± .065. C. RNA-immunoprecipitation with anti-IMP1 antibodies from embryonic brain lysate shows reduced association with β-actin mRNA in SMA brain lysate versus littermate controls. n=3, analyzed by Student T-test, p<0.05. Error bars +/− SEM. Mean ± SEM; Ctrl: 132.9 ± 24.12, SMA: 47.22 ± 7.74. D. Input levels of β-actin mRNA are unchanged. Error bars +/− SEM. Mean ± SEM; Ctrl: 1.357 ± .423, SMA: 1.343 ± .483; p= .989. E. IMP1 protein levels also remain unchanged, whereas SMN levels are significantly reduced. F. Quantification of E, n=3, analyzed by Student T-test, p<.01. Error bars +/− SEM. IMP1 protein levels mean ± SEM; Ctrl: 1.00 ± .120, SMA: 1.134 ± .108; p= .454; SMN protein levels mean ± SEM; Ctrl: 1.00 ± .096, SMA: .262 ± .0561; p= .003.
Figure 3
Figure 3
IMP1 and β-actin association is reduced in SMA patient fibroblasts. A. TriFC in SMA primary fibroblasts show reduced IMP1–β-actin granule assembly relative to control fibroblast lines (Ctrl78,79 and nDFb1,2). Scale bar = 10 μm. B. Quantification A. n=3, >50 cells/condition. Mean ± SEM; Ctrl78: 1.620 ± .147, Ctrl79: 1.743 ± .179 nDFb-1: 1.456 ± .124, nDFb-2: 1.737 ± .185, SMApt1: .774 ± .0791, SMApt2: .634 ± .0626, SMA0232: .610 ± .089, SMA9677: .559 ± .075. Analyzed by Tukey’s multiple comparisons. For a detailed breakdown of statistical comparisons see Table S3.
Figure 4
Figure 4
IMP1 association with mRNA is impaired in SMA patient fibroblasts. A. IMP1 protein levels in SMA patient fibroblasts remain unchanged relative to controls, whereas SMN levels are significantly reduced. B. Quantification of A. n=3, for statistical comparisons see Table S4 for IMP1 values and Table S5 for SMN values. Error bars +/− SEM. SMN protein levels mean ± SEM; Ctrl 78: .652 ± .109, Ctrl 79: .617 ± .117, nDFb-1: .636 ± .128, nDFb-2: .703 ± .097, SMApt1: .147 ± .0279, SMApt2: .188 ± .034, SMA0232: .178 ± .038, SMA9677: .172 ± .040. C. Schematic representation of the mRNA interactome assay. Control or SMA patient fibroblasts are subjected to UV-crosslinking and cytoplasmic lysates are incubated with oligo(dT) beads. Isolates are then used for western blot analysis for assessment of IMP1 association with mRNA. D. Quantification of mRNA-binding proteins demonstrates a significant decrease in the amount of IMP1 protein pulled down from SMA patient fibroblasts. E. Quantification of D. n=6, for statistical comparisons see Table S6. Error bars +/− SEM. Mean ± SEM; nDFb-1: 1.179 ± 0.265, nDFb-1 +RNase: 0.049 ± 0.029, nDFb-2: 1.222 ± 0.309, nDFb-2 + RNase: 0.036 ± 0.026, Ctrl78: 1.596 ± 0.536, Ctrl78 + RNase: 0.016 ± 0.008, Ctrl79: 1.176 ± 0.289, Ctrl79 + RNase: 0.009 ± 0.003, SMA0232: 0.272 ± 0.09, SMA0232 + RNase: 0.012 ± 0.004, SMA9677: 0.287 ± 0.058, SMA9677 + RNase: 0.024 ± 0.016, SMApt1: 0.308 ± 0.087, SMApt1 + RNase: 0.013 ± 0.005, SMApt2: 0.341 ± 0.102, SMApt2 + RNase: 0.017 ± 0.007.
Figure 5
Figure 5
IMP1 granules show reduced size in SMA patient samples. A. Cytoplasmic RNP isolates from fibroblasts were subjected to Optiprep gradient centrifugation and fractions were analyzed for the presence of IMP1. SMA lysates show altered distribution of IMP1 complexes relative to control fractions. B. Distributions plotted as enrichment in % of the total signal in all fractions found in one particular fraction. n=3, analyzed by Sidak’s multiple comparisons test, *p<.05, **p<.01. Error bars +/− SEM.
Figure 6
Figure 6
IMP1 granules are reduced in size in SMA patient samples and can be rescued by restoring expression of SMN. A. A CFP expressing control fibroblast pseudo-colored in magenta to highlight cell morphology and size. The inset highlights a 20μm × 20μm window to illustrate the regions of cells imaged in B. Scale bar =10μm. B. 20μm × 20μm view of IMP1 granules in a Ctrl and SMA fibroblast line, with inset region being a 5μm × 5μm region. An enlargement of inset from 5μm × 5μm region is shown, with an additional inset highlighting a 1μm × 1μm region. Enlargement of the 1μm × 1μm region highlighting the size of IMP1 granules. Scale bar =10μm. C. Superresolution Structured Illumination Microscopy (SIM) fluorescence imaging reveals that IMP1-containing granules have decreased volume in SMA fibroblasts. Scale bar = 1μm. D. Quantification of C. n=3, 15 cells/condition. Analyzed by Tukey’s multiple comparisons test. For breakdown of statistical comparisons see Table S7. Error bars +/− SEM. Mean ± SEM; Ctrl78: 5.64E+07 ± 812009, Ctrl79: 6.35E+07 ± 1.27E+06, nDFb-1: 6.42E+07 ± 1.33E+06, nDFb-2: 7.78E+07 ± 1.40E+06, SMApt1: 2.31E+07 ± 390215, SMApt2: 2.99E+07 ± 494158, SMA0232: 3.31E+07 ± 492832, SMA9677: 3.03E+07 ± 431995. E. Expression of mCherry-tagged full-length SMN but not the SMNΔTudor deletion mutant rescues IMP1 granule volume in 2 SMA lines. Scale bar = 1μm. F. Quantification of E. n=3, 15 cells/condition, for statistical comparisons see Table S7. Scale bar = 1μm. Error bars +/−SEM. Mean ± SEM; nDFb-1 mCherry: 6.49E+07 ± 1.97E+06, nDFb-1 mCherry-SMN: 6.81E+07 ± 5.55E+06, nDFb-1 mCherry-SMNΔTudor: 6.47E+07 ± 2.40E+06, nDFb-2 mCherry: 7.42E+07 ± 2.18E+06, nDFb-2 mCherry-SMN: 8.26E+07 ± 2.36E+06, nDFb-2 mCherry-SMNΔTudor: 6.30E+07 ± 1.90E+06, SMApt1 mCherry: 2.56E+07 ± 1.15E+06, SMApt1 mCherry-SMN: 5.10E+07 ± 1.68E+06, SMApt1 mCherry-SMNΔTudor: 3.26E+07 ± 1.23E+06, SMApt2 mCherry: 2.34E+07 ± 9.68E+05, SMApt2 mCherry-SMN: 6.41E+07 ± 2.57E+06, SMApt2 mCherry-SMNΔTudor: 3.55E+07 ± 918038.
Figure 7
Figure 7
IMP1 complexes show reduced association with the cytoskeleton in SMA fibroblasts. A. IMP1 protein within the lamellipodia of SMA fibroblasts fails to properly localize to the leading edge. Arrowheads indicate the leading edge and highlight assembly of IMP1 along linear structures in control fibroblasts (insets). B. Quantification of IMP1 levels in the lamellipodia. n=3, >40 cells per condition, analyzed by Tukey’s multiple comparisons. For breakdown of statistical comparisons see Table S8. Error bars +/−SEM. Mean ± SEM; Ctrl78: 906.3 ± 109.6, Ctrl79: 1007 ± 97.18, nDFb-1: 932.5 ± 104.2, nDFb-2: 908.3 ± 101.2, SMA0232: 963.2 ± 130.8, SMA9677: 1057 ± 98.44, SMApt1: 1148 ± 147.4, SMApt2: 1038 ± 78.02. C. Quantification of IMP1 levels in the leading edge. n=3, >40 cells per condition, analyzed by Tukey’s multiple comparisons. For breakdown of statistical comparisons see Table S9. Error bars +/− SEM. Mean ± SEM; Ctrl78: 827.7 ± 253.8, Ctrl79: 731 ± 96.75, nDFb-1: 704.2 ± 216, nDFb-2: 787 ± 126, SMA0232: 278.8 ± 55.85, SMA9677: 172.4 ± 35.46, SMApt1: 277.2 ± 49.13, SMApt2: 369.9 ± 72.14. D. SIM imaging reveals decreased association of IMP1 granules with actin filaments. Scale bar = 1μm. E. Quantification of D. n=3, 15/cells per condition, analyzed by Tukey’s multiple comparisons. For breakdown of statistical comparisons see Table S10. Error bars +/− SEM. Mean ± SEM; nDFb-1: 25.2 ± 1.767, nDFb-2: 25.06 ± 2.181, SMApt1: 15.9 ± 1.809, SMApt2: 17.09 ± 1.507. F. SIM imaging demonstrates reduced association of IMP1 granules with microtubules. Scale bar = 1μm. G. Quantification of F. n=3, 15/cells per condition, analyzed by Tukey’s multiple comparisons. For breakdown of statistical comparisons see Table S11. Error bars +/−SEM. Mean ± SEM; nDFb-1: 25.2 ± 1.767, nDFb-2: 25.06 ± 2.181, SMApt1: 15.9 ± 1.809, SMApt2: 17.09 ± 1.507. H. Cytoskeleton pelleting shows a reduction in the amount of IMP1 pelleted in SMA fibroblasts relative to the controls, demonstrating an impairment in association with the cytoskeleton. RNaseA/T1 treatment fully releases IMP1 from the cytoskeletal pellet. I. Quantification of H. n=5, analyzed by Tukey’s multiple comparisons. For breakdown of statistical comparisons see Table S12. Error bars +/− SEM. Mean ± SEM; nDFb-1: 2.586 ± 0.491, nDFb-1 +RNase: 0.039 ± 0.015, nDFb-2: 3.251 ± 0.660, nDFb-2 + RNase: 0.075 ± 0.023, Ctrl78: 2.732 ± 0.243, Ctrl78 + RNase: 0.058 ± 0.028, Ctrl79: 3.577 ± 0.509, Ctrl79 + RNase: 0.069 ± 0.017, SMA0232: 1.497 ± 0.312, SMA0232 + RNase: 0.037 ± 0.014, SMA9677: 1.362 ± 0.342, SMA9677 + RNase: 0.026 ± 0.009, SMApt1: 1.251 ± 0.350, SMApt1 + RNase: 0.052 ± 0.018, SMApt2: 1.311 ± 0.226, SMApt2 + RNase: 0.033 ± 0.010. J. FRAP analysis of GFP-IMP1 dynamics reveals a decrease in the immobile fraction in SMA patient fibroblasts. Representative images of GFP-IMP1 in control and SMA fibroblasts pre and post bleaching. t1/2 values: nDFb-1: 40.56s, nDFb-2: 44.64s, SMApt1: 32.05s, SMApt2: 35.61s. Immobile fraction values: nFb-1: .314, nDFb-2: .336, SMApt1: .206, SMApt2: .208. K. Normalized GFP-IMP1 FRAP recovery curves for control and SMA fibroblasts. L. Curve fitted GFP-IMP1 FRAP recovery curves for control and SMA fibroblasts.

Similar articles

Cited by

References

    1. Akten B, Kye MJ, Hao le T, Wertz MH, Singh S, Nie D, Huang J, Merianda TT, Twiss JL, Beattie CE, et al. Interaction of survival of motor neuron (SMN) and HuD proteins with mRNA cpg15 rescues motor neuron axonal deficits. Proc Natl Acad Sci U S A. 2011;108:10337–10342. - PMC - PubMed
    1. Bassell GJ, Zhang H, Byrd AL, Femino AM, Singer RH, Taneja KL, Lifshitz LM, Herman IM, Kosik KS. Sorting of beta-actin mRNA and protein to neurites and growth cones in culture. J Neurosci. 1998;18:251–265. - PMC - PubMed
    1. Baumer D, Lee S, Nicholson G, Davies JL, Parkinson NJ, Murray LM, Gillingwater TH, Ansorge O, Davies KE, Talbot K. Alternative splicing events are a late feature of pathology in a mouse model of spinal muscular atrophy. PLoS genetics. 2009;5:e1000773. - PMC - PubMed
    1. Buhler D, Raker V, Luhrmann R, Fischer U. Essential role for the tudor domain of SMN in spliceosomal U snRNP assembly: implications for spinal muscular atrophy. Hum Mol Genet. 1999;8:2351–2357. - PubMed
    1. Burghes AH, Beattie CE. Spinal muscular atrophy: why do low levels of survival motor neuron protein make motor neurons sick? Nat Rev Neurosci. 2009;10:597–609. - PMC - PubMed

MeSH terms