. 2017 Feb 14;18(7):1739-1750.
doi: 10.1016/j.celrep.2017.01.062.

Host Genotype and Gut Microbiome Modulate Insulin Secretion and Diet-Induced Metabolic Phenotypes

Affiliations

Host Genotype and Gut Microbiome Modulate Insulin Secretion and Diet-Induced Metabolic Phenotypes

Julia H Kreznar et al. Cell Rep. .

Abstract

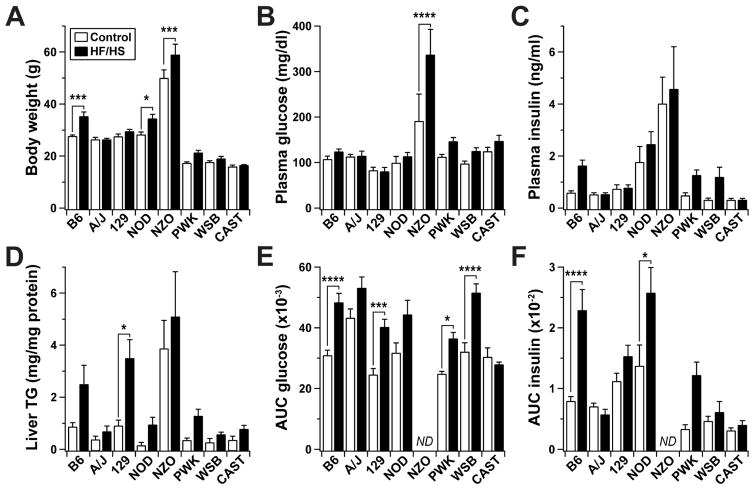
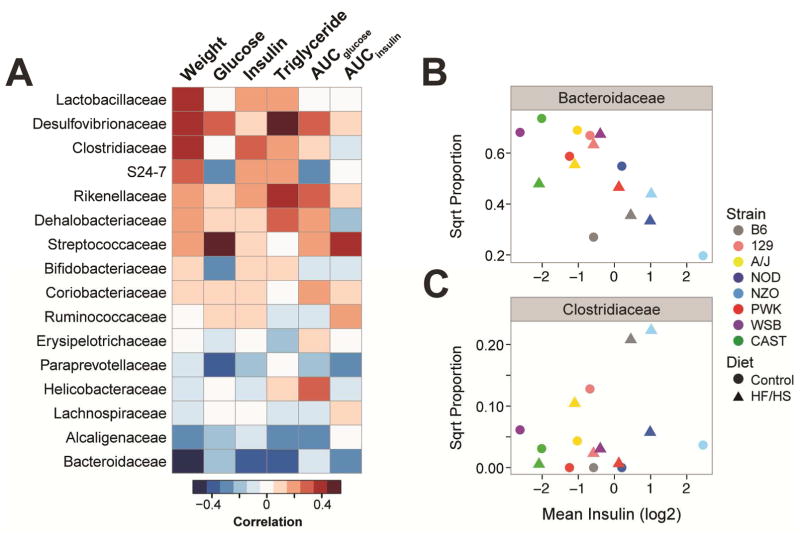
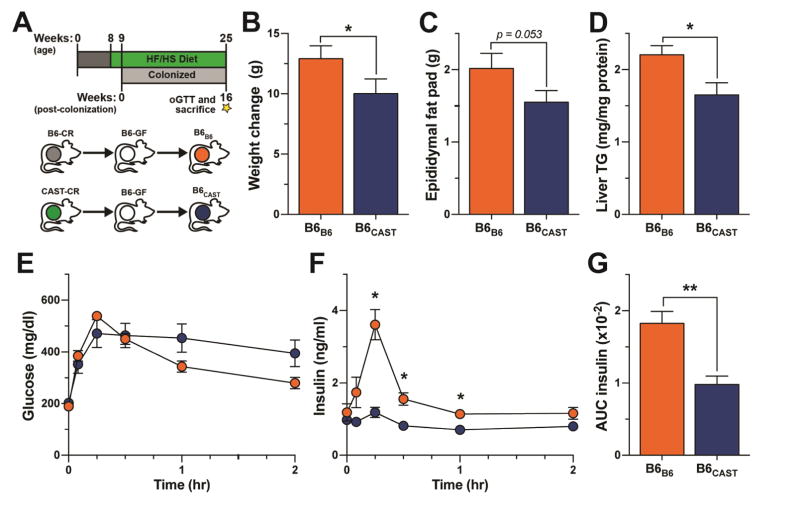
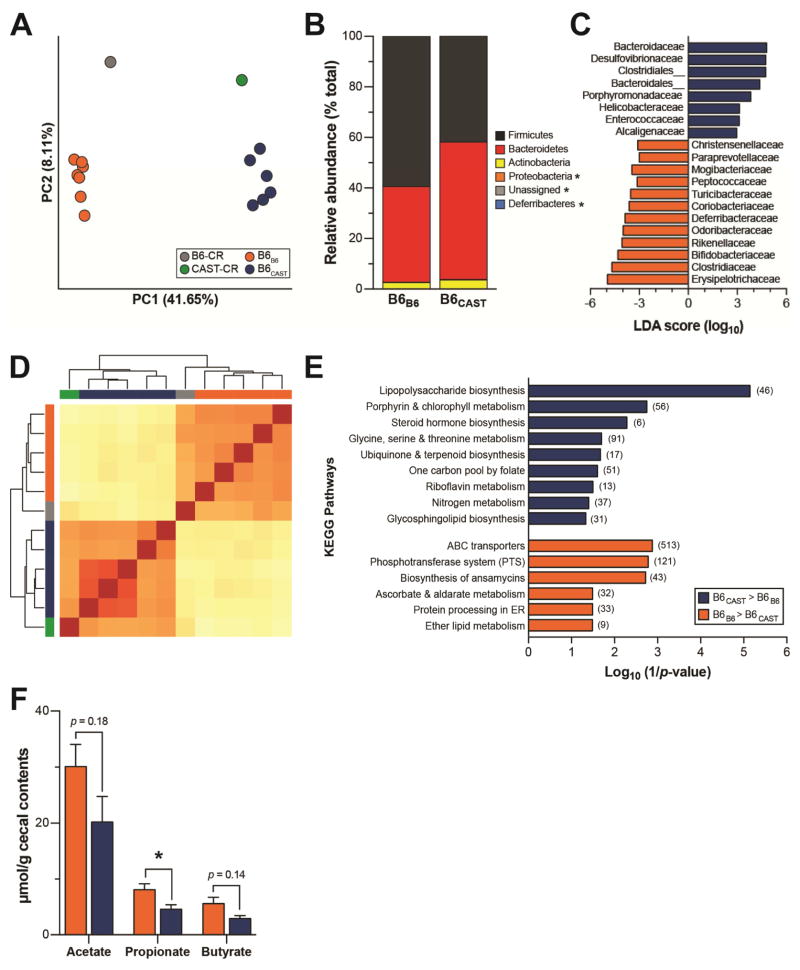
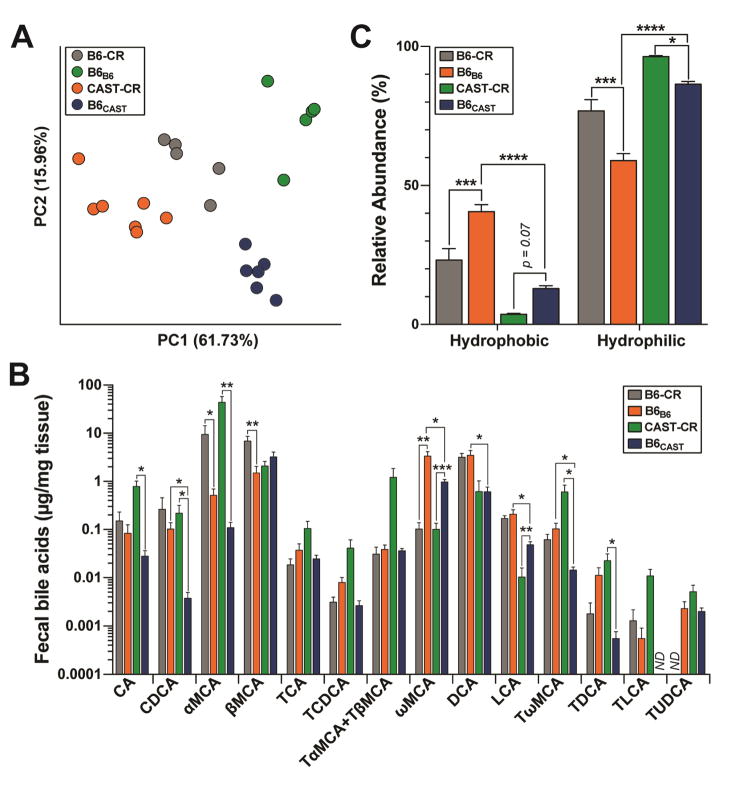
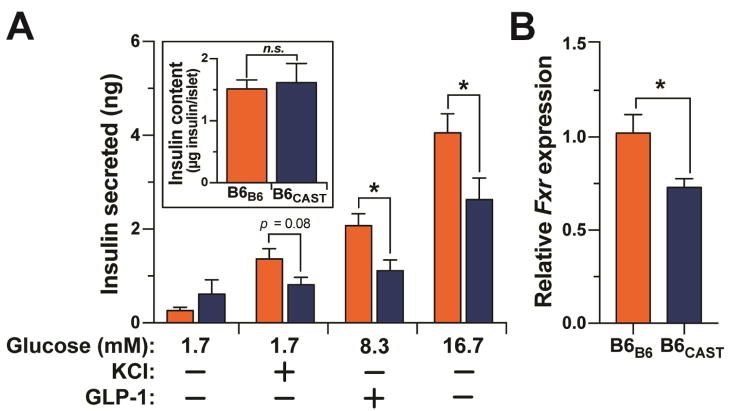
Genetic variation drives phenotypic diversity and influences the predisposition to metabolic disease. Here, we characterize the metabolic phenotypes of eight genetically distinct inbred mouse strains in response to a high-fat/high-sucrose diet. We found significant variation in diabetes-related phenotypes and gut microbiota composition among the different mouse strains in response to the dietary challenge and identified taxa associated with these traits. Follow-up microbiota transplant experiments showed that altering the composition of the gut microbiota modifies strain-specific susceptibility to diet-induced metabolic disease. Animals harboring microbial communities with enhanced capacity for processing dietary sugars and for generating hydrophobic bile acids showed increased susceptibility to metabolic disease. Notably, differences in glucose-stimulated insulin secretion between different mouse strains were partially recapitulated via gut microbiota transfer. Our results suggest that the gut microbiome contributes to the genetic and phenotypic diversity observed among mouse strains and provide a link between the gut microbiome and insulin secretion.

Keywords: gut microbiome; insulin secretion; metabolic disease; pancreatic islets.


Figures

Figure 1
Figure 1. Segregation of metabolic syndrome among CC founder mice
Male mice were maintained on the high-fat/high-sucrose (HF/HS) or a control diet for 22 weeks beginning at 4 weeks of age. (A) Body weight, (B) fasting plasma glucose and (C) insulin, and (D) hepatic triglyceride content determined for all mice at 26 weeks of age. Areas under the curve (AUC) for (E) glucose and (F) insulin during oral glucose tolerance test (oGTT) conducted at 22 weeks of age. Insulin and glucose values were determined from plasma following a 4 hour fast. No data (ND) were collected for NZO mice during oGTT. In all panels, *p < 0.05, **p < 0.01, ***p < 0.001, ****p < 0.0001 by two-way ANOVA (diet and strain) with Bonferroni’s multiple comparisons test to assess within-strain differences. Data are mean ± SEM, n ≥ 9 mice/genotype/diet.
Figure 2
Figure 2. Gut microbial taxa correlate with metabolic phenotypes
(A) Heat map illustrates Pearson’s pair-wise correlation between microbial families and diabetes-related clinical traits measured in the 8 CC founder mice (n ≥ 9 mice/genotype/diet). Microbial families are ordered by their correlation to body weight. Red, positive correlation; blue, negative. Area under the curve (AUC) values for insulin and glucose were computed from oGTT conducted at 22 weeks; other metrics were collected at 26 weeks. Correlation coefficients and p-values found in Table S2. Contributions of strain and diet on the correlations observed between fasting insulin and (B) the Bacteroidaceae family, and (C) the Clostridiaceae family.
Figure 3
Figure 3. Divergent effects of B6 and CAST microbiomes on diet-induced metabolic phenotypes
(A) Transplant experimental design. (B) Total weight change, (C) epididymal fat pad mass and (D) quantification of hepatic triglyceride (TG) contents. (E and F) Glucose and insulin values during oGTT and (G) AUC insulin in B6B6 and B6CAST mice. All measurements shown collected 16-weeks post-colonization. *p < 0.05, **p < 0.01 by Student’s t-test. Data are mean ± SEM, n = 7 for B6B6 and n = 6 for B6CAST mice.
Figure 4
Figure 4. Gut microbiota composition and function of transplant recipients
(A) Principal coordinate analysis (PCoA) of unweighted UniFrac distances for the fecal microbiota of transplant donors and recipients at sacrifice. Each circle represents an individual mouse. Percent variation explained by each PC is shown in parentheses. (B) Relative abundance of major microbial phyla ordered by increasing mean abundance; * denotes mean phyla abundance <1%. (C) Microbial families differentially enriched in either B6CAST (blue) or B6B6 (orange) as determined by linear discriminant analysis (LDA) with effect size (LEfSe). (D) Clustering of mice based on relative abundance of KEGG metabolic pathways using euclidian distance measurement with complete linkage hierarchical clustering; B6-CR (grey), CAST-CR (green), B6B6 (orange), B6CAST (blue). (E) KEGG categories enriched in either CAST (blue) or B6 (orange) transplanted microbiomes. (F) Targeted GC-MS analysis of cecal short-chain fatty acids; *p < 0.05 by Student’s t-test. Data are mean ± SEM, n = 6–7 mice/recipient group and n = 2–3 mice/donor group. For metagenomics analysis n=5 mice/recipient group.
Figure 5
Figure 5. B6 and CAST microbiota produce different bile acid profiles
(A) Principal component analysis of the square root proportion of 14 major bile acid species (ng/mg). Each dot represents the bile acid profile of an individual mouse. Percent variation explained by each PC is shown in parentheses. (B) Abundance of fecal bile acids, and (C) relative abundance of hydrophobic and hydrophilic BA species determined by UPLC-MS/MS from fecal samples collected at 12-weeks post-colonization. No data (ND). *p < 0.05, **p < 0.01, ***p < 0.001 by one-way ANOVA with Bonferroni’s multiple comparisons test. Data are mean ± SEM, n= 6–7 for transplant recipients, and n= 5 for CR mice.
Figure 6
Figure 6. CAST and B6 microbiomes differentially regulate insulin secretion and Fxr expression in pancreatic islets
(A) Total islet insulin content and glucose-stimulated insulin secretion in response to low glucose (3.3 mM), low glucose plus KCl (40 mM), high glucose (16.7), and high glucose plus GLP-1 (100 mM) from islets isolated from B6B6 and B6CAST mice. The number of islets and the insulin content per islet were not different between the groups. (B) Relative expression of Fxr mRNA from isolated islets. Figure S6 shows microbiota composition for donor and transplanted communities. *p < 0.05 by Student’s t-test. Data are mean ± SEM, n = 5.

Similar articles

Cited by

References

    1. Amyot J, et al. Lipopolysaccharides impair insulin gene expression in isolated islets of Langerhans via Toll-Like Receptor-4 and NF-κB signalling. O. S. Shirihai, ed. PloS one. 2012;7(4):e36200. - PMC - PubMed
    1. Aylor DL, et al. Genetic analysis of complex traits in the emerging Collaborative Cross. Genome research. 2011;21(8):1213–1222. - PMC - PubMed
    1. Batta AK, et al. Side chain conjugation prevents bacterial 7-dehydroxylation of bile acids. The Journal of biological chemistry. 1990;265(19):10925–10928. - PubMed
    1. Benson AK. The gut microbiome-an emerging complex trait. Nature genetics. 2016;48(11):1301–1302. - PubMed
    1. Bergström A, et al. Establishment of intestinal microbiota during early life: a longitudinal, explorative study of a large cohort of Danish infants. Applied and environmental microbiology. 2014;80(9):2889–2900. - PMC - PubMed

Publication types