

Examining the impacts of increased corn production on groundwater quality using a coupled modeling system
- PMID: 28199875
- PMCID: PMC6088799
- DOI: 10.1016/j.scitotenv.2017.02.009
Examining the impacts of increased corn production on groundwater quality using a coupled modeling system
Abstract
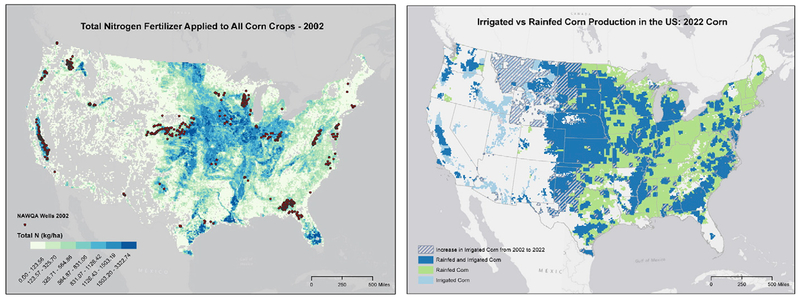
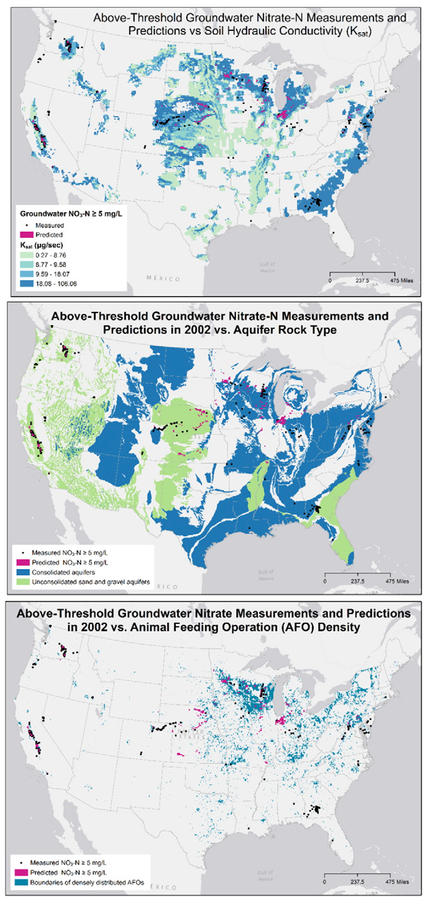
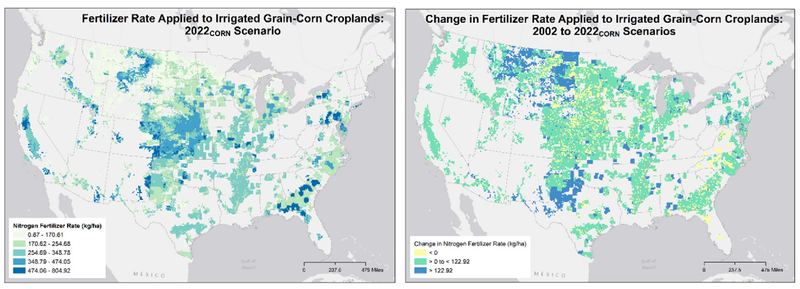
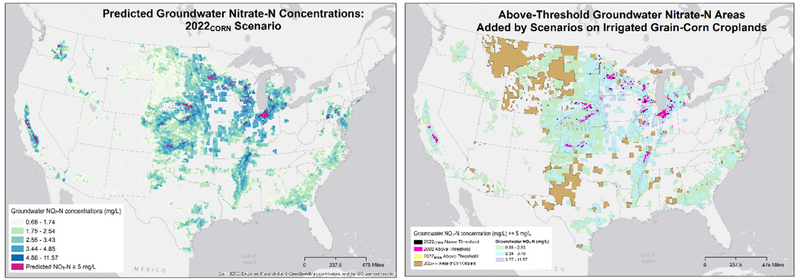
This study demonstrates the value of a coupled chemical transport modeling system for investigating groundwater nitrate contamination responses associated with nitrogen (N) fertilizer application and increased corn production. The coupled Community Multiscale Air Quality Bidirectional and Environmental Policy Integrated Climate modeling system incorporates agricultural management practices and N exchange processes between the soil and atmosphere to estimate levels of N that may volatilize into the atmosphere, re-deposit, and seep or flow into surface and groundwater. Simulated values from this modeling system were used in a land-use regression model to examine associations between groundwater nitrate-N measurements and a suite of factors related to N fertilizer and groundwater nitrate contamination. Multi-variable modeling analysis revealed that the N-fertilizer rate (versus total) applied to irrigated (versus rainfed) grain corn (versus other crops) was the strongest N-related predictor variable of groundwater nitrate-N concentrations. Application of this multi-variable model considered groundwater nitrate-N concentration responses under two corn production scenarios. Findings suggest that increased corn production between 2002 and 2022 could result in 56% to 79% increase in areas vulnerable to groundwater nitrate-N concentrations ≥5mg/L. These above-threshold areas occur on soils with a hydraulic conductivity 13% higher than the rest of the domain. Additionally, the average number of animal feeding operations (AFOs) for these areas was nearly 5 times higher, and the mean N-fertilizer rate was 4 times higher. Finally, we found that areas prone to high groundwater nitrate-N concentrations attributable to the expansion scenario did not occur in new grid cells of irrigated grain-corn croplands, but were clustered around areas of existing corn crops. This application demonstrates the value of the coupled modeling system in developing spatially refined multi-variable models to provide information for geographic locations lacking complete observational data; and in projecting possible groundwater nitrate-N concentration outcomes under alternative future crop production scenarios.
Keywords: Agricultural impacts; Biosphere modeling; Groundwater quality; Regression modeling.
Published by Elsevier B.V.
Figures


Similar articles
-
Applicability of the dual isotopes δ15N and δ18O to identify nitrate in groundwater beneath irrigated cropland.J Contam Hydrol. 2019 Jan;220:128-135. doi: 10.1016/j.jconhyd.2018.12.004. Epub 2018 Dec 21. J Contam Hydrol. 2019. PMID: 30591238
-
Three-dimensional modeling of nitrate-N transport in vadose zone: Roles of soil heterogeneity and groundwater flux.J Contam Hydrol. 2018 Apr;211:15-25. doi: 10.1016/j.jconhyd.2018.02.005. Epub 2018 Feb 27. J Contam Hydrol. 2018. PMID: 29605158
-
Prediction of nitrate accumulation and leaching beneath groundwater irrigated corn fields in the Upper Platte basin under a future climate scenario.Sci Total Environ. 2019 Oct 1;685:514-526. doi: 10.1016/j.scitotenv.2019.05.417. Epub 2019 Jun 1. Sci Total Environ. 2019. PMID: 31176972
-
Long-term numerical modeling of nitrate leaching into groundwater under surface drip irrigation of corn.Environ Geochem Health. 2023 Aug;45(8):6245-6266. doi: 10.1007/s10653-023-01629-1. Epub 2023 Jun 7. Environ Geochem Health. 2023. PMID: 37285003
-
A review of the impact of climate change on future nitrate concentrations in groundwater of the UK.Sci Total Environ. 2011 Jul 1;409(15):2859-73. doi: 10.1016/j.scitotenv.2011.04.016. Sci Total Environ. 2011. PMID: 21669323 Review.
Cited by
-
An Integrated Agriculture, Atmosphere, and Hydrology Modeling System for Ecosystem Assessments.J Adv Model Earth Syst. 2020 Jan 24;11(12):4645-4668. doi: 10.1029/2019MS001708. J Adv Model Earth Syst. 2020. PMID: 34122728 Free PMC article.
-
Decadal Shift in Nitrogen Inputs and Fluxes Across the Contiguous United States: 2002-2012.J Geophys Res Biogeosci. 2019 Oct 6;124(10):3104-3124. doi: 10.1029/2019JG005110. J Geophys Res Biogeosci. 2019. PMID: 40547514 Free PMC article.
-
Exploring a United States Maize Cellulose Biofuel Scenario Using an Integrated Energy and Agricultural Markets Solution Approach.Ann Agric Crop Sci. 2017;2(2):1031. Ann Agric Crop Sci. 2017. PMID: 33426478 Free PMC article.
References
-
- Alfons A, 2012. Package ‘cvTools’: Cross-validation Tools for Regression Models. :p. 43 (Available on: https://cran.r-project.org/web/packages/cvTools/. (accessed 11 July 2016)).
-
- Appel KW, Foley KM, Bash JO, Pinder RW, Dennis RL, Allen DJ, et al., 2011. A multi-resolution assessment of the Community Multiscale Air Quality (CMAQ) model v4.7 wet deposition estimates for 2002–2006. Geosci. Model Dev. 4, 357–371.
-
- Bash JO, Cooter EJ, Dennis RL, Walker JT, Pleim JE, 2013. Evaluation of a regional air-quality model with bidirectional NH3 exchange coupled to an agroecosystem model. Biogeosciences 10, 1635–1645.
-
- Cooter EJ, Bash JO, Benson V, Ran L, 2012. Linking agricultural crop management and air quality models for regional to national-scale nitrogen assessments. Biogeosci. Discuss 9, 6095–6127.
Grants and funding
LinkOut - more resources
Full Text Sources
Other Literature Sources
