. 2017 Mar 14;8(11):17897-17907.
doi: 10.18632/oncotarget.15225.

A tree shrew glioblastoma model recapitulates features of human glioblastoma

Affiliations

A tree shrew glioblastoma model recapitulates features of human glioblastoma

Yaohui Tong et al. Oncotarget. .

Abstract

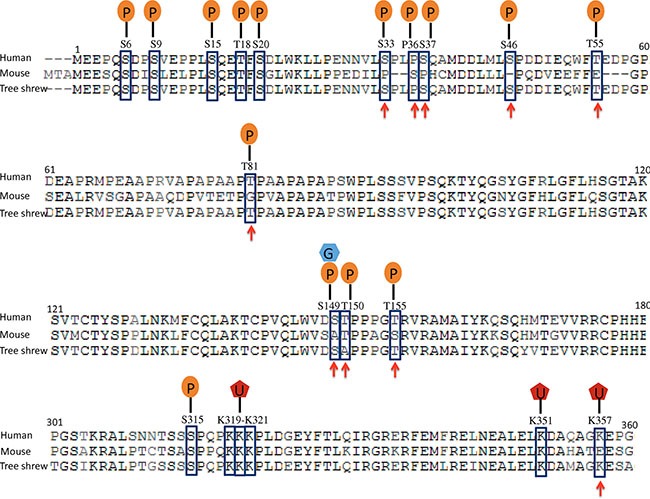
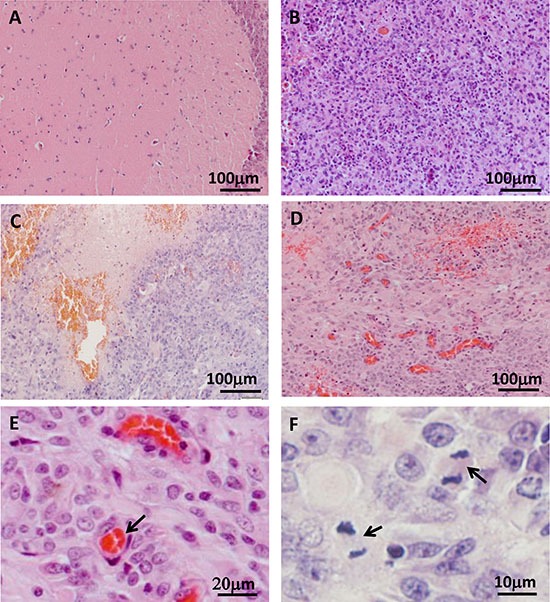
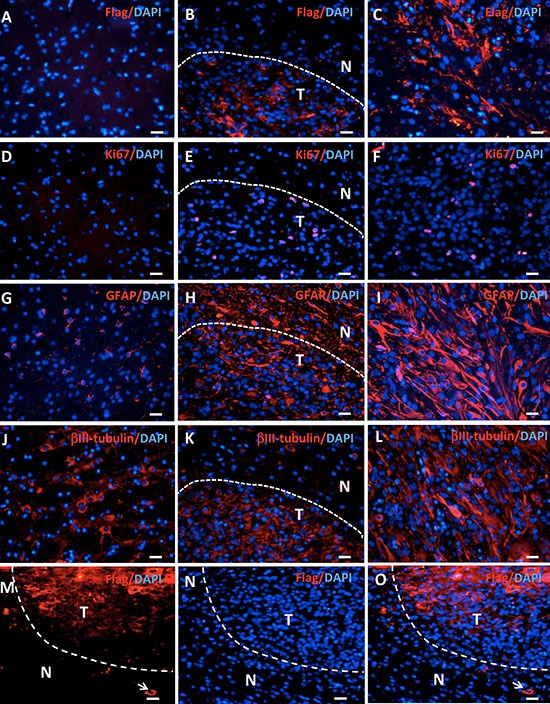
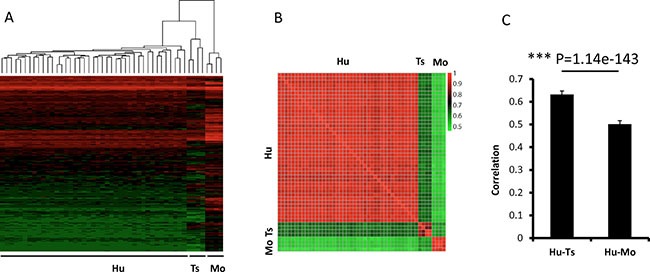
Tupaia belangeri (tree shrew), an animal species whose genome has significantly higher similarity to primates than rodents, has been used in biomedical research. To generate animal models that reproduce the human tumors more faithfully than rodents, we present the first report of a cancer model mimicking human tumor genetics in tree shrew. By engineering a lentiviral system for the transduction of mutant H-Ras and a shRNA against tree shrew p53, we successfully generated malignant glioma in tree shrew. The tree shrew glioma exhibited aggressive behavior and a relatively short latency, and markedly reduced animal survival. Remarkably, the biological features of human high-grade glioma (necrosis, microvascular proliferation, pseudopalisading) were all present in tree shrew glioma. Furthermore, genetic analysis of tree shrew glioma revealed that the tumors were clustered within the mesenchymal subgroup of human glioblastoma multiforme. Compared with the corresponding mouse glioma, tree shrew gliomas were markedly more similar to human glioblastoma at gene expression profile. The tree shrew glioma model provides colleagues working in the field of gliomas and cancer in general with a more accurate animal model.

Keywords: P53; animal model; glioblastoma; tree shrew.


Conflict of interest statement

CONFLICTS OF INTEREST

The authors declare no conflicts of interest.

Figures

Figure 1
Figure 1. Comparison of human, tree shrew and mouse Tp53 proteins
Post-translational modification sites are indicated with squares, and the sites that are conserved in tree shrew but not in mouse are indicated by arrowheads. P: phosphorylation site; G, O-GlcNAcylation; U, mono-ubiquitination.
Figure 2
Figure 2. Brain tumors in tree shrew induced by overexpression of constitutive H-Ras and tp53 silencing (shp53)
(A) Diagram of the lentiviral vector pTomo-HRasV12-shp53. (B) Test of shp53 silencing efficiency in a tree shrew liver cell line. A shRNA targeting luciferase was used as a negative control. (C). Kaplan-Meier curve of tree shrews infected with lentivirus. (D) low magnification of H&E staining of normal brain (left) and tumor (right). Tumor locates in hippocampus.
Figure 3
Figure 3. Histological examination of tree shrew brain tumors
(A) Normal brain tissue. (B) High-cell-density tumor tissue. (C) Necrotic region. (D) Blood vessel hyperplasia. (E) Microvessel, as indicated by the arrow. (F) Active proliferation in the tumor. Arrows indicate cells in metaphase.
Figure 4
Figure 4. Gene expression in tree shrew brain tumors detected by immunofluorescence
Staining for Flag-tagged H-Ras, Ki67, GFAP, and βIII-tubulin expression was performed in normal brains (A, D, G, J), the edge area between the tumor (T) and the normal tissue (N) (B, E, H, K), and the tumor (C, F, I, L). (MO) Flag staining shows positive cells outside the tumor (arrows).
Figure 5
Figure 5. Pairwise comparisons of the gene expression profiles among tree shrew, human, and mouse glioblastomas
The dendrogram (A) show 3 clear clusters of tree shrew, human, and mouse samples. The heatmap (B) illustrates the correlation of the expression profiles from the 3 species. The bar (C) illustrates the average correlation between the 3 species. The error bars show the standard deviations. The Red/green values represent Pearson Correlation Coefficient between the heatmap. Hu:human; Ts: tree shrew; Mo: mouse.
Figure 6
Figure 6
Pairwise comparisons of Ras (AC) and Tp53 (DF) target gene expression among tree shrew, human, and mouse. A–C, Ras target genes; D–F, Tp53 target genes. The dendrograms (A) and (D) show 3 clear clusters of tree shrew, human, and mouse. The expression heatmaps (B and E) illustrate the correlation between the 3 species. C and F illustrate the average correlation between the heatmaps in (B) and (E), respectively. The error bars show the standard deviations. The 23 genes of Ras targets are RAC1, RHOA, RALA, RAF1, ABL1, RALGDS, RAB5A, RALBP1, TBK1, NFKB1, TIAM1, BAD, CDC42, MAPK3, ARF6, RAPGEF5, PLD2, REL, RIN1, PAK1, KSR1, PLD1, and PLA1A from top to bottom of heatmap. The sixty-four genes of p53 targets are S100A9, S100A8, ATF3, CCNB1, IER3, CDKN1A, RHOA, NFIC, E2F3, PSEN1, AKT1, MCM7, BTG2, TRIM26, PRKAB1, CHUK, RB1, ETS2, XPC, MSH2, HIPK2, CEBPA, PPP2R4, BAX, PIAS3, TBP, ING1, EZH2, BIRC5, CHGA, GDF15, THBS1, EGFR, IL6, STMN1, CX3CL1, PLK3, IGF2, TERT, CDC25C, E2F2, ESR1, BDKRB1, MDM2, UNC5B, FBLN1, PTHLH, ETS1, AMH, MMP13, WRN, CCNE1, CHEK2, BRCA1, CHEK1, CCNA1, EPHA2, POLD1, JAK2, FDXR, PML, PLK1, RAD51, and TK1 from top to bottom of heatmap. The Red/green values represent Pearson Correlation Coefficient between the heatmap. Hu:human; Ts: tree shrew; Mo: mouse.

References

    1. Ostrom QT, Gittleman H, Liao P, Rouse C, Chen Y, Dowling J, Wolinsky Y, Kruchko C, Barnholtz-Sloan J. CBTRUS statistical report: primary brain and central nervous system tumors diagnosed in the United States in 2007–2011. Neuro Oncol. 2014;16:iv1–63. - PMC - PubMed
    1. Stupp R, Hegi ME, Mason WP, van den Bent MJ, Taphoorn MJ, Janzer RC, Ludwin SK, Allgeier A, Fisher B, Belanger K, Hau P, Brandes AA, Gijtenbeek J, et al. Effects of radiotherapy with concomitant and adjuvant temozolomide versus radiotherapy alone on survival in glioblastoma in a randomised phase III study: 5-year analysis of the EORTC-NCIC trial. Lancet Oncol. 2009;10:459–66. - PubMed
    1. Ohka F, Natsume A, Wakabayashi T. Current trends in targeted therapies for glioblastoma multiforme. Neurol Res Int. 2012;2012:878425. - PMC - PubMed
    1. Politi K, Pao W. How genetically engineered mouse tumor models provide insights into human cancers. J Clin Oncol. 2011;29:2273–81. - PMC - PubMed
    1. Marumoto T, Tashiro A, Friedmann-Morvinski D, Scadeng M, Soda Y, Gage FH, Verma IM. Development of a novel mouse glioma model using lentiviral vectors. Nat Med. 2009;15:110–6. - PMC - PubMed

Substances