

Real-Time Assessment of Health-Care Requirements During the Zika Virus Epidemic in Martinique
- PMID: 28200111
- PMCID: PMC5860153
- DOI: 10.1093/aje/kwx008
Real-Time Assessment of Health-Care Requirements During the Zika Virus Epidemic in Martinique
Abstract
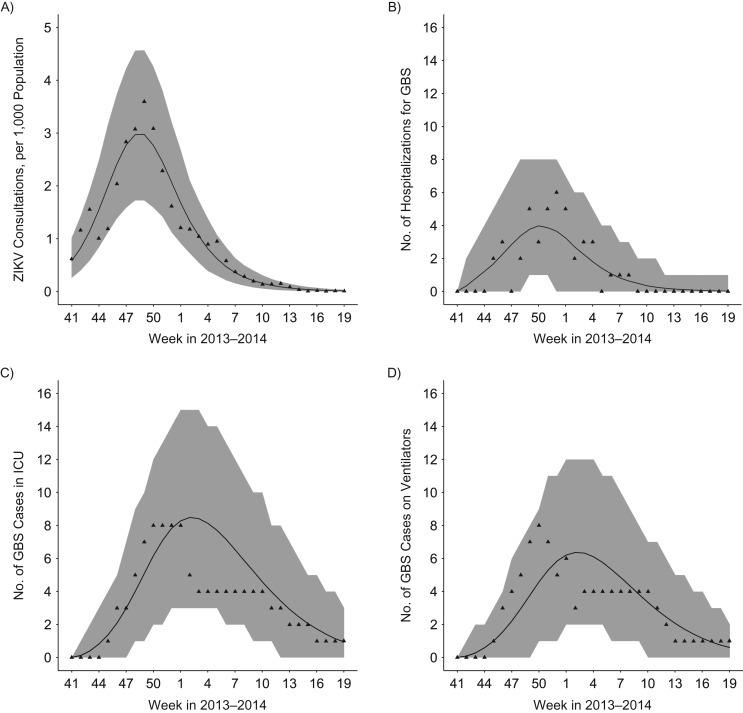
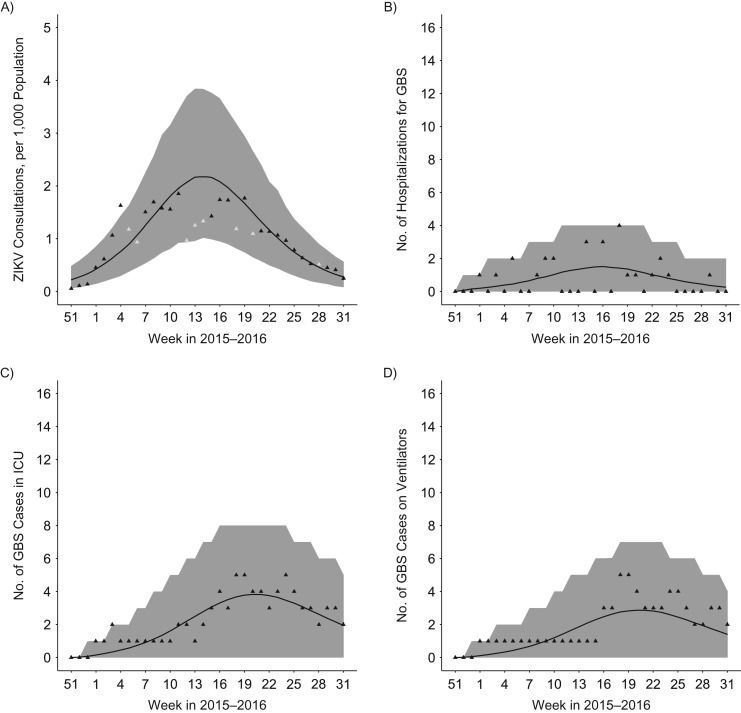
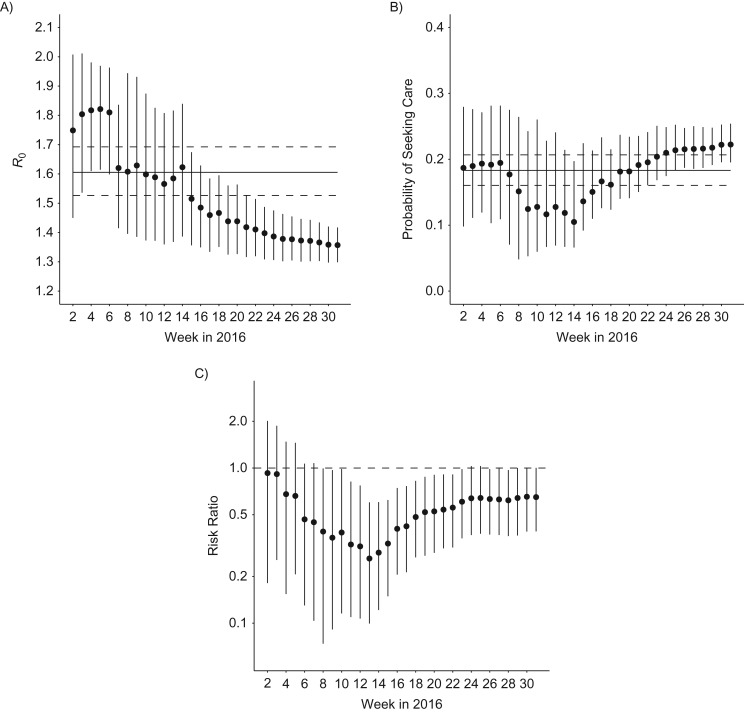
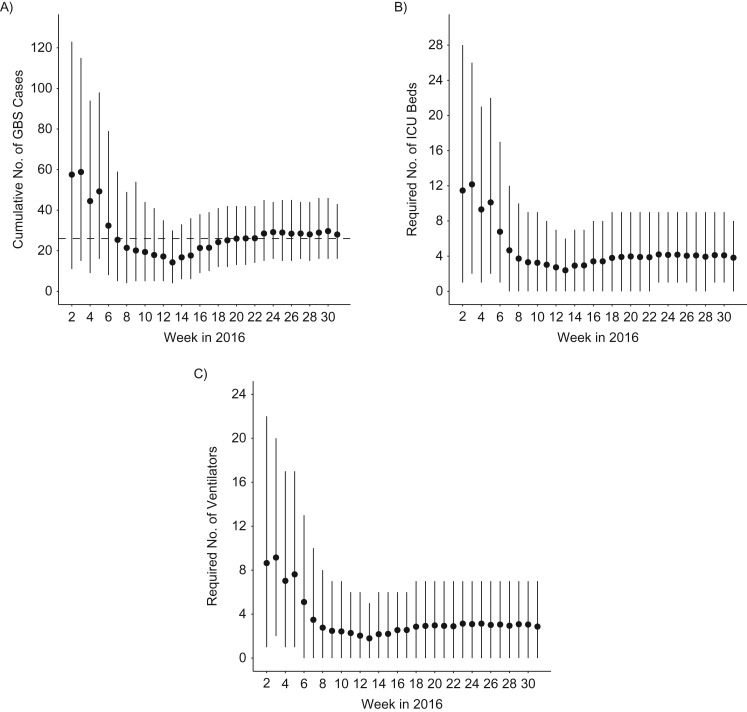
The spread of Zika virus in the Americas has been associated with a surge in Guillain-Barré syndrome (GBS) cases. Given the severity of GBS, territories affected by Zika virus need to plan health-care resources to manage GBS patients. To inform such planning in Martinique, we analyzed Zika virus surveillance and GBS data from Martinique in real time with a modeling framework that captured dynamics of the Zika virus epidemic, the risk of GBS in Zika virus-infected persons, and the clinical management of GBS cases. We compared our estimates with those from the 2013-2014 Zika virus epidemic in French Polynesia. We were able to predict just a few weeks into the epidemic that, due to lower transmission potential and lower probability of developing GBS following infection in Martinique, the total number of GBS cases in Martinique would be substantially lower than suggested by simple extrapolations from French Polynesia. We correctly predicted that 8 intensive-care beds and 7 ventilators would be sufficient to treat GBS cases. This study showcased the contribution of modeling to inform local health-care planning during an outbreak. Timely studies that estimate the proportion of infected persons that seek care are needed to improve the predictive power of such approaches.
Keywords: Guillain-Barré syndrome; Zika virus; epidemic forecasts; health-care planning.
© The Author(s) 2017. Published by Oxford University Press on behalf of the Johns Hopkins Bloomberg School of Public Health.
Figures
References
-
- World Health Organization Zika situation report http://www.who.int/emergencies/zika-virus/situation-report/8-september-2... Published September8, 2016. Accessed September8, 2016.
-
- Centers for Disease Control and Prevention All countries and territories with active Zika virus transmission http://www.cdc.gov/zika/geo/active-countries.html Updated December16, 2016. Accessed December14, 2016.
-
- Musso D, Nilles EJ, Cao-Lormeau VM. Rapid spread of emerging Zika virus in the Pacific area. Clin Microbiol Infect. 2014;20(10):O595–O596. - PubMed
MeSH terms
Grants and funding
LinkOut - more resources
Full Text Sources
Other Literature Sources
Medical
