. 2017 Apr 19;28(4):1031-1040.
doi: 10.1021/acs.bioconjchem.6b00719. Epub 2017 Mar 9.

Targeted Contrast Agent Specific to an Oncoprotein in Tumor Microenvironment with the Potential for Detection and Risk Stratification of Prostate Cancer with MRI

Affiliations

Targeted Contrast Agent Specific to an Oncoprotein in Tumor Microenvironment with the Potential for Detection and Risk Stratification of Prostate Cancer with MRI

Zheng Han et al. Bioconjug Chem. .

Abstract

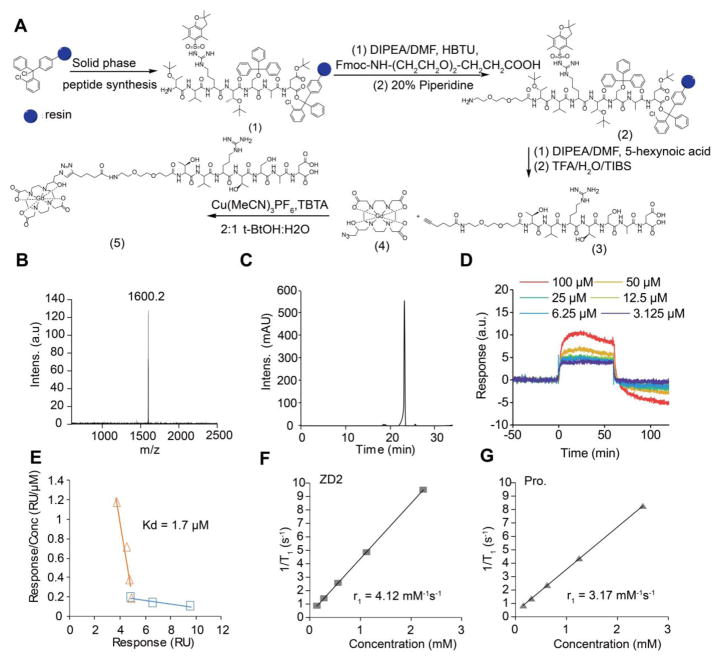
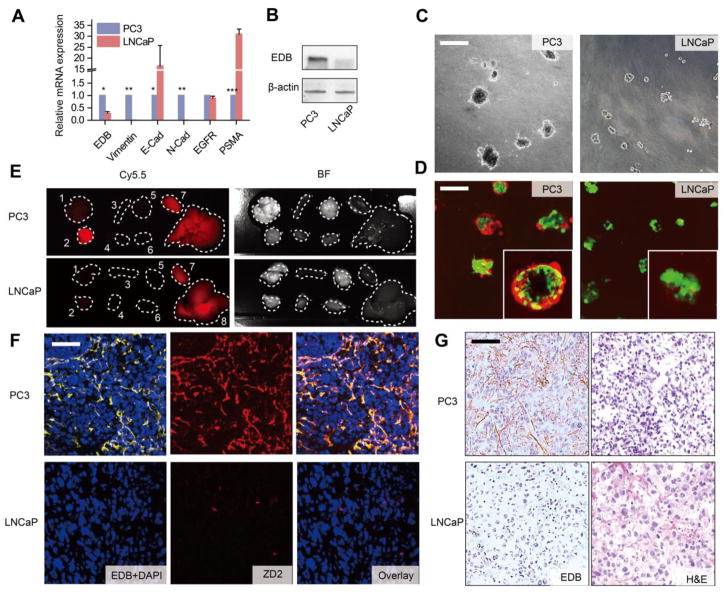
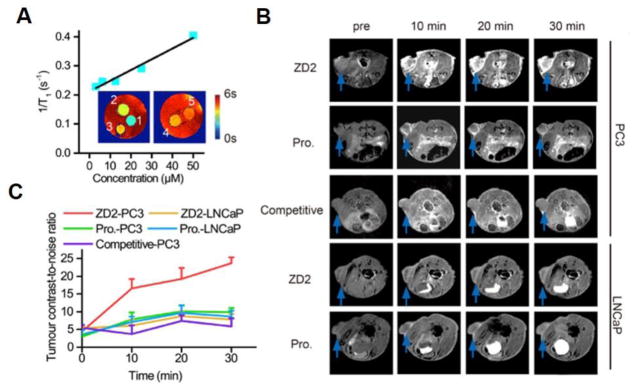
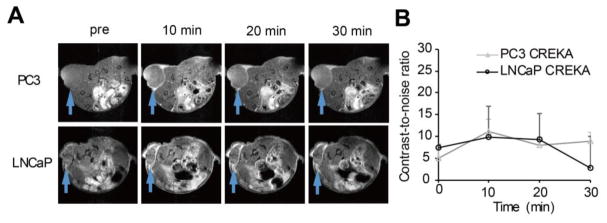
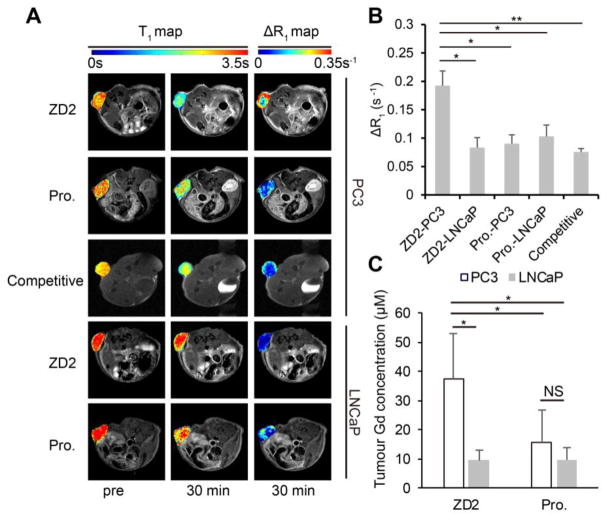
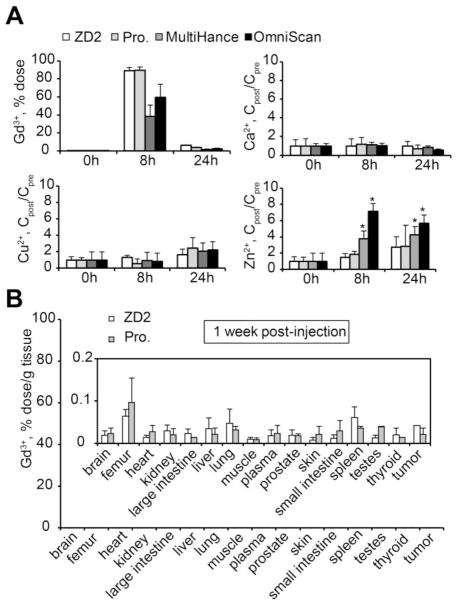
Accurate detection and risk stratification are paramount to the clinical management of prostate cancer. Current diagnostic methods, including prostate specific antigen (PSA) screening, are unable to differentiate high-risk tumors from low-risk tumors, resulting in overdiagnosis and overtreatment. A peptide targeted contrast agent, ZD2-Gd(HP-DO3A), specific to an oncoprotein in tumor microenvironment, EDB-FN, was synthesized for noninvasive detection and characterization of aggressive prostate cancer. EDB-FN, one of the subtypes of oncofetal fibronectin, is involved in tumor epithelial-to-mesenchymal transition (EMT), which is implicated in drug resistance and metastasis. The EDB-FN mRNA level in the metastatic PC3 cells was at least three times higher than that in non-metastatic LNCaP cells. In tumors, EDB-FN protein was highly expressed in PC3 tumor xenografts, but not in LNCaP tumors, as revealed by Western blot analysis. ZD2-Gd(HP-DO3A) produced over two times higher contrast-to-noise ratio in the PC3 tumors than in the LNCaP tumors in contrast-enhanced MRI during 30 min after injection. ZD2-Gd(HP-DO3A) possessed high chelate stability against transmetalation and minimal tissue accumulation. Our results demonstrate that molecular MRI of EDB-FN with ZD2-Gd(HP-DO3A) can potentially be used for noninvasive detection and risk stratification of human prostate cancer. Incorporation of this targeted contrast agent in the existing clinical contrast enhanced MRI procedures has the potential to improve diagnostic accuracy of prostate cancer.


Figures

Figure 1
Figure 1. Synthesis and characterization of ZD2-Gd(HP-DO3A)
A, synthesis route of ZD2-Gd(HP-DO3A). Briefly, ZD2 peptide was synthesized (yielding compound 1) and conjugated with Fmoc-NH-(CH2CH2O)2-CH2CH2COOH (yielding compound 2) and 5-hexynoic acid (yielding compound 3) in solid phase. Compounds 3 and 4 were reacted using click chemistry to produce ZD2-Gd(HP-DO3A). B, MALDI-TOF mass spectrum (detected molecular weight: 1600.2 Da; calculated molecular weight: 1601.79 Da) of ZD2-Gd(HP-DO3A). C, reversed-phase high performance liquid chromatography (RP-HPLC) analysis of ZD2-Gd(HP-DO3A). D, sensorgram measured by surface plasma resonance (SPR) analysis of varying concentrations of ZD2-Gd(DO3A). E, Plot of response/concentration versus response for the sensorgram shown in (c) yields the binding affinity of 1.7 μM for ZD2-Gd(HP-DO3A) to EDB protein (organ trend line). Data that represents a weak binding site was also shown (blue trend line). F, Plot of 1/T1 measured by T1 mapping in phantom containing increasing concentration of ZD2-Gd(HP-DO3A) (abbreviated as ZD2) in PC3 tumor lysates. G, Plot of 1/T1 measured by T1 mapping in phantom containing increasing concentration of ProHance (abbreviated as Pro.) in PC3 tumor lysates. Fitting of the data yielded r1 relaxivities of 4.12 mM−1s−1 for ZD2-Gd(HP-DO3A) and 3.17 mM−1s−1 for ProHance.
Figure 2
Figure 2. In vitro complexation stability and transmetallation analysis of ZD2-Gd(HP-DO3A)
A, relative Gd3+ content of ZD2-Gd(HP-DO3A) assayed during 200-min incubation of the agent in phosphate buffer saline (PBS) with and without Cu2+, Ca2+, or Zn2+ ions. No decrease in Gd3+ content was observed, demonstrating high chelate stability. B, In vitro transmetallation analysis of MultiHance, OmniScan, ProHance (abbreviated as Pro.), and ZD2-Gd(HP-DO3A) (abbreviated as ZD2) in mouse serum.
Figure 3
Figure 3. Upregulated EDB-FN is a promising biomarker for high-risk prostate cancer
A, comparison of the relative mRNA expression of prostate cancer biomarkers, including EDB-FN (EDB), Vimentin, E-Cadherin (E-Cad), N-Cadherin (N-Cad), epidermal growth factor receptor (EGFR), and prostate-specific membrane antigen (PSMA) between PC3 and LNCaP cells (n = 3, unpaired two-tailed t-test, *: P<0.05, **: P<0.01, ***: P<0.001). All gene expression was normalized to β-actin mRNA levels. B, western blot analysis of EDB-FN expression in PC3 and LNCaP tumors. Actin expression was used as a loading control. C, representative phase contrast images of LNCaP and PC3 cells grown in 3D matrigel. Scale bar: 40 μm. D, representative fluorescence images of 3D cultures of LNCaP and PC3 cells incubated with 250 nM ZD2-Cy5.5, using confocal microscopy. Colors: green, GFP; red: ZD2-Cy5.5. Inset: enlarged image of the 3D spheres. E, ex vivo fluorescent Cy5.5 and bright field (BF) images of tumors and organs from PC3 and LNCaP mouse models, at 3 h post-injection of 10 nmol ZD2-Cy5.5. Numbers denote: 1, lung; 2, tumor; 3, spleen; 4, muscle; 5, brain; 6, heart; 7, kidney; 8, liver. F, confocal fluorescence microscopy images of PC3 and LNCaP tumor sections stained with ZD2-Cy5.5 and anti-EDB-FN antibody. Colors: blue, DAPI; red, ZD2-Cy5.5; yellow, EDB-FN. Overlay: addition of DAPI, ZD2-Cy5.5, and EDB-FN channels. Scale bar: 20 μm. G, immunohistochemical (IHC) staining for EDB-FN and H&E staining on PC3 and LNCaP tumor sections. The brown color in IHC staining indicates EDB-FN distribution only in PC3 but not in the LNCaP sections. Scale bar: 20 μm.
Figure 4
Figure 4. The EDB-FN targeting contrast agent, ZD2-Gd(HP-DO3A), is capable of differentiating between PC3 and LNCaP tumors in T1-weighted MRI
A, plot of 1/T1 value versus concentration of ZD2-Gd(HP-DO3A) for calculating r1 relaxivity in PBS at 7T. Inset: T1 color-coded maps of phantoms containing ZD2-Gd(HP-DO3A) solution at different concentrations. Numbers close to each phantom denote: 1, 50 μM; 2, 25 μM; 3, 12.5 μM; 4, 6.25 μM; 5, 3.12 μM. B, Axial MRI images of PC3 and LNCaP tumor models at the indicated tumor positions acquired with a T1-weighted sequence. Images of mice at pre-contrast (abbreviated as pre) and at 10 min, 20 min, and 30 min post-injection are shown. The names of the contrast agents are abbreviated as: ZD2, ZD2-Gd(HP-DO3A); Pro., ProHance. Competitive: injection of 0.1 mmol/kg ZD2-Gd(HP-DO3A) mixed with 0.5 mmol/kg ZD2 peptide in mice with PC3 tumors. C, change in contrast-to-noise ratio of tumors in the experiments shown in B. Data represent the mean±s.e.m. of 5 mice in all experimental groups except for the competitive group (n = 3) (unpaired two-tailed t-test: P<0.05 for comparison of ZD2-PC3 vs. all other groups at 10 min, 20 min and 30 min). Legends: ZD2-PC3, PC3 tumor model injected with ZD2-Gd(HP-DO3A); ZD2-LNCaP, LNCaP tumor model injected with ZD2-Gd(HP-DO3A); Pro.-PC3, PC3 tumor model injected with ProHance; Pro.-LNCaP, LNCaP tumor model injected with ProHance.
Figure 5
Figure 5. Contrast enhanced MRI with CREKA-Gd(HP-DO3A) in the PC3 and LNCaP tumors
A, axial images of PC3 and LNCaP tumor locations. B, quantification of the change in CNR in the PC3 and LNCaP tumors up to 30 min after CREKA-Gd(HP-DO3A) injection. No significant difference was seen between the two groups.
Figure 6
Figure 6. T1 maps and accumulation of ZD2-Gd(HP-DO3A) validate its specific binding in PC3 tumors
A, T1 and ΔR1 maps showing the tumor T1 and ΔR1 values in PC3 or LNCaP tumor models injected with ZD2-Gd(HP-DO3A) (abbreviated as ZD2) or ProHance (abbreviated as Pro.) at pre-contrast (pre) or 30 min post-injection. Images are displayed as overlays of tumor color-coded maps and axial T1-weighted images. B, quantification of average ΔR1 after contrast injection in the groups shown in A (n = 4; *, P < 0.05, **, P < 0.01). C, comparison of contrast agent accumulation in the tumors, as measured by ICP-OES at 30 min after contrast agent injection (unpaired two-tailed t-test: n = 4; *, P < 0.05; NS: not significant).
Figure 7
Figure 7. In vivo transmetallation and biodistribution of MRI contrast agents after intravenous administration
A, Gd3+ content in urine before and at 8 h and 24 h after ZD2-Gd(HP-DO3A), ProHance, MultiHance, or OmniScan injections. B, Gd biodistribution in mouse tissues at 1 week after injection of ZD2-Gd(HP-DO3A) (n = 4) or ProHance (n = 3). Gd3+ content is represented as the ratio of dose injected to the weight of the tissue. Inset: biodistribution data shown with a shorter-scale on the Y-axis. No significant difference was seen between the two groups.

Similar articles

Cited by

References

    1. Roobol M. Perspective: Enforce the clinical guidelines. Nature. 2015;528:S123. - PubMed
    1. Qaseem A, Barry MJ, Denberg TD, Owens DK, Shekelle P Clinical Guidelines Committee of the American College of P. Screening for prostate cancer: a guidance statement from the Clinical Guidelines Committee of the American College of Physicians. Ann Intern Med. 2013;158:761–9. - PubMed
    1. Siegel R, Naishadham D, Jemal A. Cancer statistics, 2012. CA Cancer J Clin. 2012;62:10–29. - PubMed
    1. Glass AS, Cary KC, Cooperberg MR. Risk-based prostate cancer screening: who and how? Curr Urol Rep. 2013;14:192–8. - PubMed
    1. Wilt TJ, Ahmed HU. Prostate cancer screening and the management of clinically localized disease. BMJ. 2013;346:f325. - PMC - PubMed

Publication types