

Effect of myeloid differentiation primary response gene 88 on expression profiles of genes during the development and progression of Helicobacter-induced gastric cancer
- PMID: 28201999
- PMCID: PMC5310019
- DOI: 10.1186/s12885-017-3114-y
Effect of myeloid differentiation primary response gene 88 on expression profiles of genes during the development and progression of Helicobacter-induced gastric cancer
Abstract
Background: Gastric cancer is one of the most common and lethal type of cancer worldwide. Infection with Helicobacter pylori (H. pylori) is recognized as the major cause of gastric cancer. However, it remains unclear the mechanism by which Helicobacter infection leads to gastric cancer. Furthermore, the underlying molecular events involved during the progression of Helicobacter infection to gastric malignancy are not well understood. In previous studies, we demonstrated that that H. felis-infected Myd88 -/- mice exhibited dramatic pathology and an accelerated progression to gastric dysplasia; however, the MyD88 downstream gene targets responsible for this pathology have not been described. This study was designed to identify MyD88-dependent genes involved in the progression towards gastric cancer during the course of Helicobacter infection.
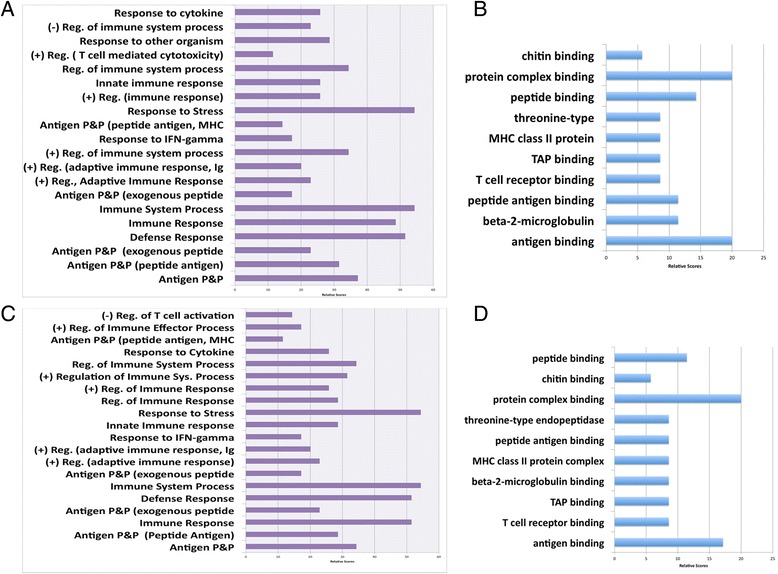
Methods: Wild type (WT) and Myd88 deficient mice (Myd88 -/-) were infected with H. felis for 25 and 47 weeks and global transcriptome analysis performed on gastric tissue using MouseWG-6 v2 expression BeadChips microarrays. Function and pathway enrichment analyses of statistically significant, differential expressed genes (p < 0.05) were performed using the Database for Annotation, Visualization and Integrated Discovery (DAVID) online tools.
Results: Helicobacter infection affected the transcriptional profile of more genes in Myd88 -/- mice compared to WT mice. Infection of Myd88 -/- mice resulted in the differential expression of 1,989 genes at 25 weeks (1031 up and 958 downregulated). At 47 weeks post-H.felis infection, 2,162 (1140 up and 1022 downregulated) were differentially expressed. The most significant differentially upregulated gene during Helicobacter infection in Myd88 -/- mice was chitinase-like 4 (chil4), which is involved in tissue remodeling and wound healing. Other highly upregulated genes in H. felis-infected Myd88 -/- mice included, Indoleamine 2,3-Dioxygenase 1 (Ido1), Guanylate binding protein 2 (Gbp2), ubiquitin D (Ubd), β 2 -Microglobulin (B2m), CD74 antigen (Cd74), which have been reported to promote cancer progression by enhancing angiogenesis, proliferation, migration, metastasis, invasion, and tumorigenecity. For downregulated genes, the highly expressed genes included, ATPase H+/K+ transporting, alpha subunit (Atp4a), Atp4b, Mucin 5 AC (Muc5ac), Apolipoprotein A-1 (Apoa1), and gastric intrinsic factor (Gif), whose optimal function is important in maintaining gastric hemostasis and lower expression has been associated with increased risk of gastric carcinogenesis.
Conclusions: These results provide a global transcriptional gene profile during the development and progression of Helicobacter-induced gastric cancer. The data show that our mouse model system is useful for identifying genes involved in gastric cancer progression.
Keywords: Gastric cancer; Gene regulation; Helicobacter; Microarray; MyD88.
Figures


Similar articles
-
Deficiency of the myeloid differentiation primary response molecule MyD88 leads to an early and rapid development of Helicobacter-induced gastric malignancy.Infect Immun. 2014 Jan;82(1):356-63. doi: 10.1128/IAI.01344-13. Epub 2013 Oct 28. Infect Immun. 2014. PMID: 24166959 Free PMC article.
-
Multi-omics analysis of Helicobacter pylori-associated gastric cancer identifies hub genes as a novel therapeutic biomarker.Brief Bioinform. 2025 May 1;26(3):bbaf241. doi: 10.1093/bib/bbaf241. Brief Bioinform. 2025. PMID: 40445003 Free PMC article.
-
Gene expression profiling in a mouse model of Helicobacter-induced gastric cancer.Cancer Sci. 2007 Mar;98(3):284-93. doi: 10.1111/j.1349-7006.2007.00392.x. Cancer Sci. 2007. PMID: 17270017 Free PMC article.
-
Molecular Pathogenesis of Helicobacter pylori-Related Gastric Cancer.Gastroenterol Clin North Am. 2015 Sep;44(3):625-38. doi: 10.1016/j.gtc.2015.05.011. Epub 2015 Jul 7. Gastroenterol Clin North Am. 2015. PMID: 26314672 Review.
-
Apoptosis in gastric epithelium induced by Helicobacter pylori infection: implications in gastric carcinogenesis.Am J Gastroenterol. 2001 Jan;96(1):16-26. doi: 10.1111/j.1572-0241.2001.03447.x. Am J Gastroenterol. 2001. PMID: 11197247 Review.
Cited by
-
Quantitative analysis of proteins related to chemoresistance to paclitaxel and carboplatin in human SiHa cervical cancer cells via iTRAQ.J Gynecol Oncol. 2020 May;31(3):e28. doi: 10.3802/jgo.2020.31.e28. Epub 2019 Nov 7. J Gynecol Oncol. 2020. PMID: 31912682 Free PMC article.
-
Early detection of tumor cells in bone marrow and peripheral blood in a fast‑progressing gastric cancer model.Int J Oncol. 2021 Mar;58(3):388-396. doi: 10.3892/ijo.2021.5171. Epub 2021 Jan 12. Int J Oncol. 2021. PMID: 33469673 Free PMC article.
-
Identification of potential key genes in gastric cancer using bioinformatics analysis.Biomed Rep. 2020 Apr;12(4):178-192. doi: 10.3892/br.2020.1281. Epub 2020 Feb 20. Biomed Rep. 2020. PMID: 32190306 Free PMC article.
-
Molecular biology of BPIFB1 and its advances in disease.Ann Transl Med. 2020 May;8(10):651. doi: 10.21037/atm-20-3462. Ann Transl Med. 2020. PMID: 32566588 Free PMC article. Review.
-
Apolipoprotein A-I (ApoA-I), Immunity, Inflammation and Cancer.Cancers (Basel). 2019 Aug 1;11(8):1097. doi: 10.3390/cancers11081097. Cancers (Basel). 2019. PMID: 31374929 Free PMC article. Review.
References
MeSH terms
Substances
Grants and funding
LinkOut - more resources
Full Text Sources
Other Literature Sources
Medical
Molecular Biology Databases
Research Materials
Miscellaneous
