. 2017 Feb 15;14(1):13.
doi: 10.1186/s12984-017-0221-6.

Kinesthetic deficits after perinatal stroke: robotic measurement in hemiparetic children

Affiliations

Kinesthetic deficits after perinatal stroke: robotic measurement in hemiparetic children

Andrea M Kuczynski et al. J Neuroeng Rehabil. .

Abstract

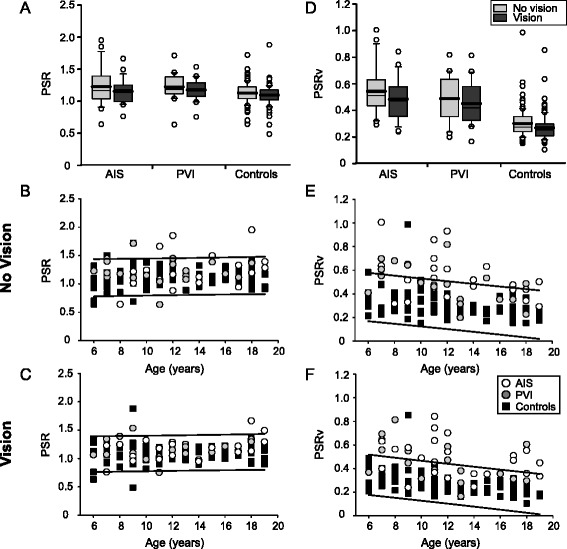
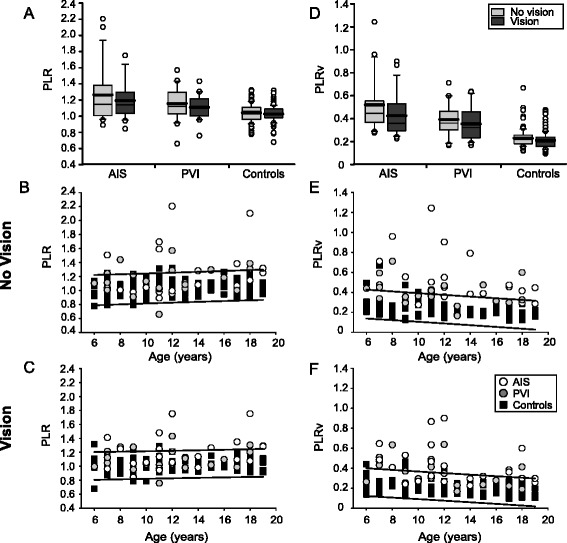
Background: While sensory dysfunction is common in children with hemiparetic cerebral palsy (CP) secondary to perinatal stroke, it is an understudied contributor to disability with limited objective measurement tools. Robotic technology offers the potential to objectively measure complex sensorimotor function but has been understudied in perinatal stroke. The present study aimed to quantify kinesthetic deficits in hemiparetic children with perinatal stroke and determine their association with clinical function.

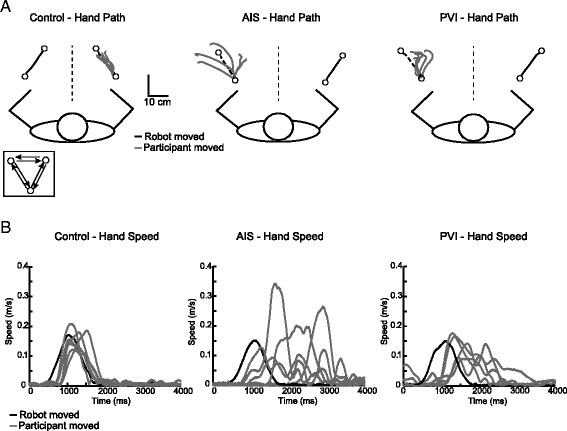
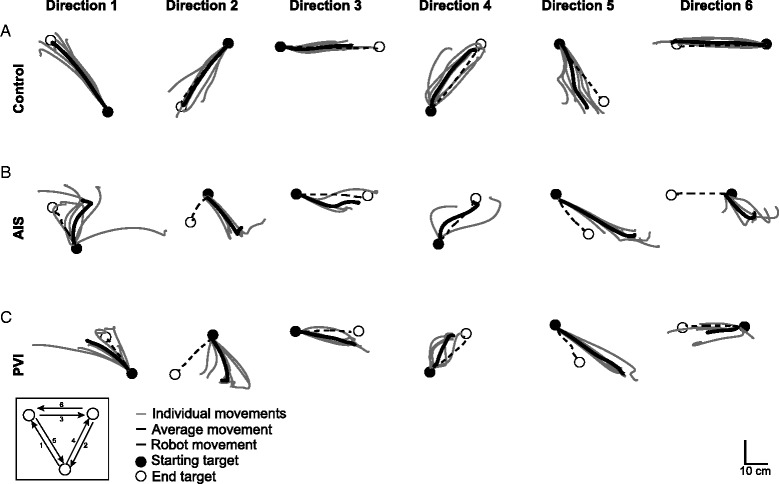
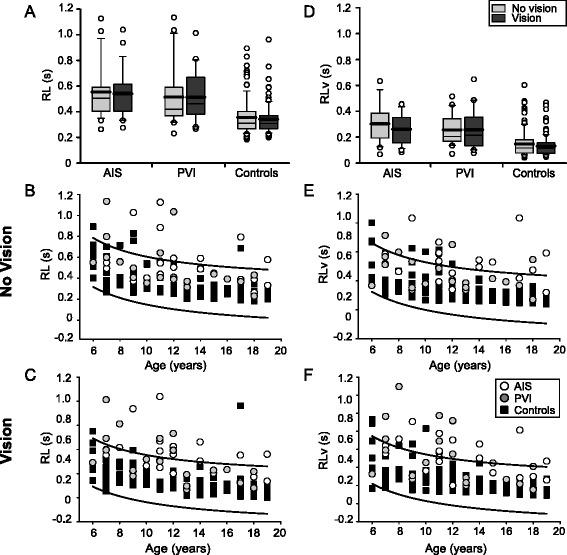
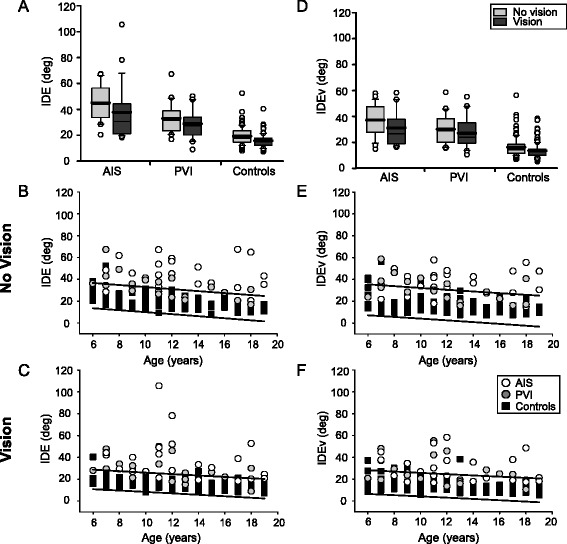
Methods: Case-control study. Participants were 6-19 years of age. Stroke participants had MRI confirmed unilateral perinatal arterial ischemic stroke or periventricular venous infarction, and symptomatic hemiparetic cerebral palsy. Participants completed a robotic assessment of upper extremity kinesthesia using a robotic exoskeleton (KINARM). Four kinesthetic parameters (response latency, initial direction error, peak speed ratio, and path length ratio) and their variabilities were measured with and without vision. Robotic outcomes were compared across stroke groups and controls and to clinical measures of sensorimotor function.

Results: Forty-three stroke participants (23 arterial, 20 venous, median age 12 years, 42% female) were compared to 106 healthy controls. Stroke cases displayed significantly impaired kinesthesia that remained when vision was restored. Kinesthesia was more impaired in arterial versus venous lesions and correlated with clinical measures.

Conclusions: Robotic assessment of kinesthesia is feasible in children with perinatal stroke. Kinesthetic impairment is common and associated with stroke type. Failure to correct with vision suggests sensory network dysfunction.

Keywords: Cerebral palsy; Kinesthesia; Perinatal; Proprioception; Robotics; Stroke.


Figures

Fig. 1
Fig. 1
Pediatric robotic kinesthesia task. White circles represent the location of robotic movement endpoints. Each of the three targets were separated by 12 cm. Black lines show the movement of the robotically moved passive arm. Grey lines show the movements performed by the active arm to mirror-match the movement of the robot. a Hand paths of an exemplar 10 year old female control, AIS, and PVI participants for six movements in a single direction. A 17 year old male participant with AIS makes larger initial direction errors (IDE) in comparison to the ideal (robotic) trajectory (dashed line). A 7 year old female participant with PVI also demonstrates greater angular deviations than the exemplar control. b Hand speed profiles associated with movement in one direction depict the speed of the robotically moved passive arm (black line) relative to movements of the participant (grey lines). The speed profile of the exemplar control indicates excellent matching of robot speed. The speed profile of the AIS participant indicates variable speed after the movement of the passive arm. A participant with PVI matches the speed of the robot, but moves much later when matching
Fig. 2
Fig. 2
Hand movements in the kinesthesia task. Individual and average hand movements in each direction for an exemplar participant from each group. White circles represent the location of robotic movement endpoints. Black dashed lines show the mirrored movement of the robotically moved passive arm from the first target (black circle) to the end target (white circle). The direction of movement between the three targets is shown in the bottom left corner. Light grey lines show the movements performed by the active arm to mirror-match the movement of the robot. Dark grey lines indicate the average hand movement in each direction. a A 15 year old female typically developing child/adolescent demonstrates excellent matching of the robot movement with low IDE and excellent PLR. b An 11 year old female participant with AIS shows difficulty in matching the length (PLR) and direction (IDE) of movement, and does not complete all 6 trials within the movements (direction 3 and 4). c A 15 year old male with PVI moves with large IDE in most directions
Fig. 3
Fig. 3
Group data of response latency. Boxplots of response latency (RL) and RLv (top row) are shown for each of the three groups with vision removed and vision restored. Scatter plots without (middle row) and with (bottom row) vision show the performance in the parameters for stroke cases and controls with 95% prediction intervals of control performance defining normal boundaries (black lines). Both AIS and PVI groups demonstrate increased RL (a) and RLv (d) relative to controls. Stroke cases often demonstrated consistently greater RL (b, c) and RLv (e, f) across all ages (x-axis)
Fig. 4
Fig. 4
Group data of initial direction error. Boxplots of initial direction error (IDE) and IDEv (top row) are shown for each of the three groups with vision removed and vision restored. Scatter plots without (middle row) and with (bottom row) vision show the performance in the parameters for stroke cases and controls with 95% prediction intervals of control performance defining normal boundaries (black lines). Both AIS and PVI demonstrate increased IDE (a) and IDEv (d) relative to controls in both vision conditions. Stroke cases often demonstrated greater IDE (b, c) and IDEv (e, f) across all ages (x-axis)
Fig. 5
Fig. 5
Group data of peak speed ratio. Boxplots of peak speed ratio (PSR) and PSRv (top row) are shown for each of the three groups with vision removed and vision restored. Scatter plots without (middle row) and with (bottom row) vision show the performance in the parameters for stroke cases and controls with 95% prediction intervals of control performance defining normal boundaries (black lines). Both AIS and PVI groups demonstrate increased PSR (a) and PSRv (d) relative to controls. Stroke cases often demonstrated greater PSR (b, c) and PSRv (e, f) across all ages (x-axis)
Fig. 6
Fig. 6
Group data of path length ratio. Boxplots of path length ratio (PLR) and PLRv (top row) are shown for each of the three groups with vision removed and vision restored. Scatter plots without (middle row) and with (bottom row) vision show the performance in the parameters for stroke cases and controls with 95% prediction intervals of control performance defining normal boundaries (black lines). Both AIS and PVI groups demonstrate increased PLR (a) and PLRv (d) relative to controls. Stroke cases often demonstrated greater PLR (b, c) and PLRv (e, f) across all ages (x-axis)

References

    1. Sherrington C. On the proprioceptive system, especially in its reflex aspect. Brain. 1907;29:467–82. doi: 10.1093/brain/29.4.467. - DOI
    1. McCloskey DI. Kinesthetic sensibility. Physiol Rev. 1978;58:763–820. - PubMed
    1. Gandevia SC, Refshauge KM, Collins DF. Proprioception: peripheral inputs and perceptual interactions. Adv Exp Med Biol. 2002;508:61–8. doi: 10.1007/978-1-4615-0713-0_8. - DOI - PubMed
    1. Sainburg RL, Ghilardi MF, Poizner H, Ghez C. Control of limb dynamics in normal subjects and patients without proprioception. J Neurophysiol. 1995;73:820–35. - PMC - PubMed
    1. Gordon J, Ghilardi MF, Ghez C. Impairments of reaching movements in patients without proprioception. I Spatial errors. J Neurophysiol. 1995;73:347–60. - PubMed

Grants and funding