. 2017 Feb 16;16(1):38.
doi: 10.1186/s12943-017-0605-z.

HOXC8 regulates self-renewal, differentiation and transformation of breast cancer stem cells

Affiliations

HOXC8 regulates self-renewal, differentiation and transformation of breast cancer stem cells

Mansi Shah et al. Mol Cancer. .

Abstract

Background: Homeobox genes are master regulators of cell fate during embryonic development and their expression is altered in cancer. By regulating the balance between cell proliferation and differentiation, they maintain homeostasis of normal tissues. Here, we screened the expression of homeobox genes in mammary stem cells to establish their role in stem cells transformation in breast cancer.

Methods: Using a Homeobox Genes PCR array, we screened 83 homeobox genes in normal cancer breast stem/progenitor cells isolated by flow cytometry. The candidate gene HOXC8 epigenetic regulation was studied by DNA methylation and miRNA expression analyses. Self-renewal and differentiation of HOXC8-overexpressing or knockdown cells were assessed by flow cytometry and mammosphere, 3D matrigel and soft agar assays. Clinical relevance of in vitro findings were validated by bioinformatics analysis of patient datasets from TCGA and METABRIC studies.

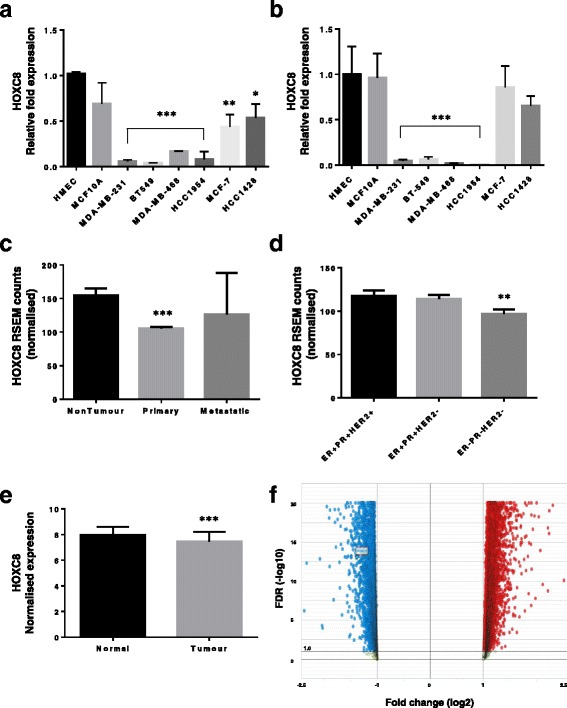
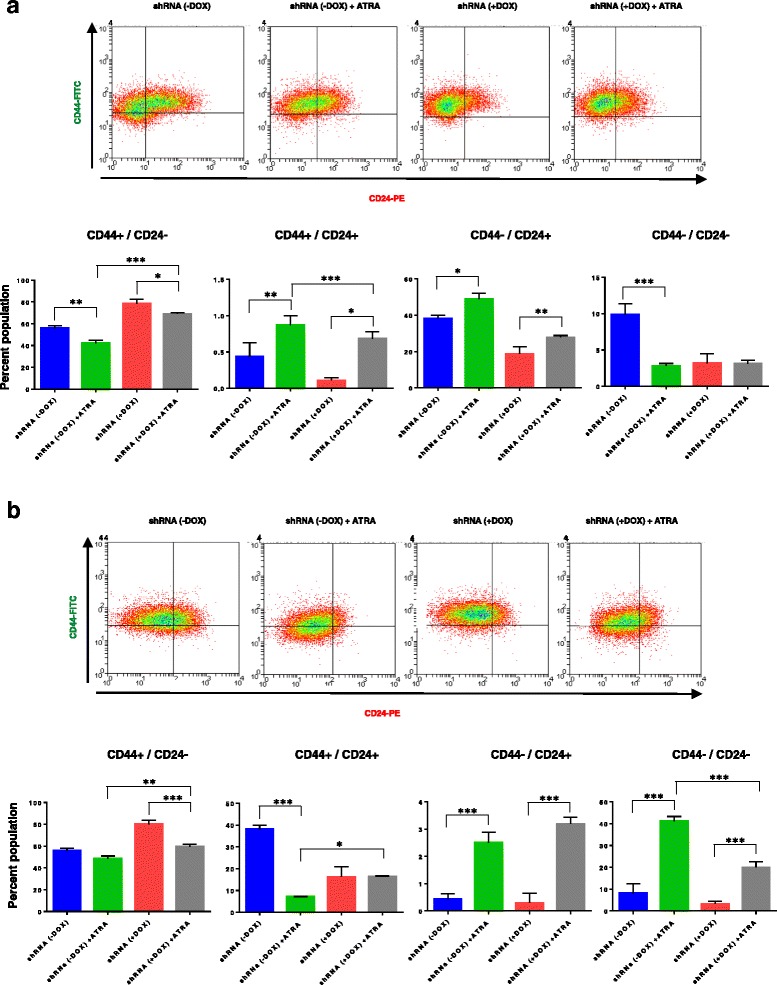
Results: In this study we demonstrate altered expression of homeobox genes in breast cancer stem/progenitor cells. HOXC8 was consistently downregulated in stem/progenitor cells of all breast molecular subtypes, thus representing an interesting tumour suppressor candidate. We show that downregulated expression of HOXC8 is associated with DNA methylation at the gene promoter and expression of miR196 family members. Functional studies demonstrated that HOXC8 gain of function induces a decrease in the CD44+/CD24-/low cancer stem cell population and proportion of chemoresistant cells, with a concomitant increase in CD24+ differentiated cells. Increased HOXC8 levels also decrease the ability of cancer cells to form mammospheres and to grow in anchorage-independent conditions. Furthermore, loss of HOXC8 in non-tumorigenic mammary epithelial cells expands the cancer stem/progenitor cells pool, increases stem cell self-renewal, prevents differentiation induced by retinoic acid and induces a transformed phenotype.

Conclusions: Taken together, our study points to an important role of homeobox genes in breast cancer stem/progenitor cell function and establishes HOXC8 as a suppressor of stemness and transformation in the mammary gland lineage.

Keywords: Breast cancer; Cancer stem cells; Differentiation; HOXC8; Homeobox genes; Self-renewal.


Figures

Fig. 1
Fig. 1
Differential expression of homeobox genes in CSC compared to normal MaSC. a Unsupervised hierarchical clustering of 83 homeobox genes based on expression in CSC isolated by CD44+/CD24low/- cell sorting of different cell lines representing breast cancer molecular subtypes (LUM, HER2-E, TN), immortalised mammary epithelial cells (IMM) and normal mammary cells. Homeobox gene expression was determined by qRT-PCR using using the Homeobox Genes RT2 Profiler PCR Array (Qiagen) with two independent biological replicates. b Venn diagram representing differentially expressed genes unique or in common among CSC of different breast cancer molecular subtypes compared to normal MaSC (CD44+/CD24-/low cells from HMEC). Subtype-specific and common differentially expressed genes are indicated in the highlighted boxes
Fig. 2
Fig. 2
Data heatmaps and histograms showing expression of homeobox genes in the TCGA (RNASeq and PAM50) and METABRIC datasets. Genomic heatmaps compare expression of genes between normal and tumour samples, with yellow and blue colour intensity indicating high and low expression, respectively. The red and green colours under the genomic heatmaps indicate the statistics track showing the logarithmic plot of P-values for each gene using Student’ t-test followed by Bonferroni’s correction. Bars above the line indicates that the red subgroup (Tumour sample) is greater than the green subgroup; a bar below the line indicates that the green subgroup (Normal sample) is greater than the red subgroup. Bars are coloured in red or green when P < 0.05. The same colour code summarises the same information obtained from analysis of the METABRIC and PAM50 datasets (Additional file 3: Figure S2) and the homeobox PCR array (Fig. 1) in the tables below the heatmaps. a. Homeobox genes differentially expressed in CSC of all cancer subtypes. b. Homeobox genes differentially expressed in LUM CSC. c. Homeobox genes differentially expressed in HER2-E CSC. d. Homeobox genes differentially expressed in TN CSC
Fig. 3
Fig. 3
HOXC8 expression is reduced in breast CSC and breast cancer clinical samples. a Expression of HOXC8 in CSC sorted as CD44+/CD24low/- cell population as determined by TaqMan® qRT-PCR. Results are presented as relative fold expression relative to RPLP0 and HMEC used as calibrator (n = 3–4). Relative fold expression levels were analysed by One-way ANOVA followed by Bonferroni’s multiple comparisons test. *P < 0.05, **P < 0.01, ***P < 0.001. b Expression of HOXC8 in unsorted cell lines as determined by TaqMan® qRT-PCR. Results are presented as relative fold expression relative to RPLP0 and HMEC used as calibrator (n = 3–4). Relative fold expression levels were analysed by One-way ANOVA followed by Bonferroni’s multiple comparisons test. ***P < 0.001. c Expression of HOXC8 in patient tumour tissue determined by RNA-Seq in the breast TCGA dataset [29, 30]. Statistical analysis was performed by Bioconductor-edgeR. ***P < 0.001. d Expression of HOXC8 in patient tumour tissue classified according to hormone receptor status as determined by RNA-Seq in the breast TCGA dataset. Statistical analysis was performed by Bioconductor-edgeR. **P < 0.01, ER+PR+HER2+ (n = 115), ER+PR+HER2 (n = 408), ERPRHER2 (n = 128). e Expression of HOXC8 in patient tumour tissue determined by microarray analysis of the breast cancer METABRIC dataset access through the OASIS software [33, 34]. Statistical analysis was performed by Unpaired Student’s t-test. ***P < 0.001. f Volcano plot of the METABRIC dataset showing differentially expressed genes in breast cancer patients compared to normal tissue as visualised in the OASIS software. The significant downregulated HOXC8 expression is highlighted
Fig. 4
Fig. 4
HOXC8 expression is downregulated in TN and HER2-E CSC by epigenetic silencing. a HOXC8 genomic copy number in CSC sorted as CD44+/CD24low/- cell population as determined by SYBR® qRT-PCR. Results are presented as fold difference relative to HMEC used as calibrator (n = 4). Dotted lines represent the range of normal copy number 1 ± 95% confidence interval. b Expression of miR196-a and miR196-b in CSC sorted as CD44+/CD24low/- cell population as determined by SYBR® qRT-PCR. Results are presented as relative fold expression relative to RNU6B and HMEC used as calibrator (n = 3). Relative fold expression levels were analysed by One-way ANOVA followed by Bonferroni’s multiple comparisons test. ***P < 0.001. c DNA methylation profile of HOXC8 promoter CpG Island. DNA methylation was analysed by direct PCR bisulfite sequencing. Black circles indicated methylated CG dinucleotides, white circles indicate unmethylated CG dinucleotides, white/black semicircles indicate partially methyalted CG dinucleotides. d DNA methylation profile of HOXC8 promoter of TCGA clinical samples profiled by Illumina Infinium HumanMethylation 450 BeadChip array (n = 872). Left panel shows DNA methylation normalised proportions in normal and tumour samples as visualised in UCSC Cancer Browser (blue colour represents lower methylation, red colour represents higher methylation). Right panel shows DNA methylation levels in tumour samples (red) compared to normal (green) as visualised by MethHC browser. Statistical analysis was performed by Student’s t-test. **P < 0.01
Fig. 5
Fig. 5
HOXC8 expression negatively regulates CSC and chemoresistance. a Representative FACS profiles of cells transduced with pSIN-HOXC8 or pSIN empty control vector and quantification of CSC and non-CSC populations stained with CD44-APC and CD244-FITC. Results were analysed by comparing levels of CD44+/CD24, CD44+/CD24+, CD44/CD24+ cells in pSIN-HOXC8 transduced cells compared to control vector for each cell line (n = 3). Statistical analysis was performed by Two-way ANOVA followed by Bonferroni’s multiple comparisons test. **P < 0.01, ***P < 0.001. b Expression of CD24 and ALDH1A1 in Control and HOXC8-overexpressing cells. Gene expression was measured by TaqMan® qRT-PCR. Results are presented as relative fold expression relative to RPLP0 and control (pSIN vector) used as calibrator (n = 3). Relative fold expression levels were analysed by Unpaired Student’s t-test. **P < 0.01, ***P < 0.001. c Percentage of CD44+/CD24low/- cells in cell lines treated with 10nM Paclitaxel, 500 μM 5-FU and 500nM Doxorubicin for 5 days as measured by FACS analysis. Results were analysed by comparing levels of CD44+/CD24low/- cells in untreated versus treated cells by One-way ANOVA followed by Bonferroni’s multiple comparisons test for each cell line (n = 3). *P < 0.05. d Percentage of CD44+/CD24low/- cells in cell lines treated with 10nM Paclitaxel, 500 μM 5-FU and 500nM Doxorubicin for 5 days as measured by FACS analysis. Results were analysed by comparing levels of CD44+/CD24low/- cells in pSIN-HOXC8 or pSIN empty control vector transduced cells by Unpaired Student’s t-test for each cell line (n = 3). **P < 0.01
Fig. 6
Fig. 6
HOXC8 expression reduced CSC self-renewal and anchorage independent cell growth. a Mammospheres morphology and number obtained by self-renewal of cell overexpressing HOXC8 or control vector after 4 generations. Mammospheres numbers were compared by Unpaired Student’s t-test for each cell line (n = 4). *P < 0.05, ***P < 0.001. Only spheres ≥ 100 μM were counted, images were taken at 10X magnification. b Second generation mammospheres obtained after labelling with the PKH26 dye and sorting of the PKH26 positive/high population from first generation mammospheres. Results show the morphology of mammospheres overexpressing HOXC8 or control vector and total mammospheres cell number. Mammospheres numbers were compared by Unaired Student’s t-test (n = 3). **P < 0.01. Only spheres ≥ 100 μM were counted, images were taken at 10X magnification. c Colonies of cells overexpressing HOXC8 or control vector grown in soft agar for 2 weeks. The number of colonies were calculated by counting 10 fields of view. Results were analysed by Unpaired Student’s t-test for each cell line (n = 3). **P < 0.01, ***P < 0.001. Images were taken at 10X magnification
Fig. 7
Fig. 7
HOXC8 knockdown increase CSC proliferation and transformed phenotype. a Knockdown of HOXC8 was induced by lentiviral transduction of MCF10A cells with pLKO-Tet-HOXC8 vector and gene expression measured by TaqMan® qRT-PCR. Results are presented as relative fold expression relative to RPLP0 and pLKO-Tet-Scrambled vector used as calibrator (n = 3). Results were analysed by Unpaired Student’s t-test (n = 3). ***P < 0.001. Bottom panel shows western blotting of nuclear lysates from cells transduced with pLKO-Tet-HOXC8 vector or pLKO-Tet-Scrambled vector was conducted to detect the expression of HOXC8 (34 kDa) and LAMIN A/C (41–50 kDa) as loading control. b Percentage of CD44+/CD24low/-, CD44+/CD24+, CD44/CD24+ cells after HOXC8 knockdown as measured by FACS analysis. Results were analysed by comparing cell populations levels in HOXC8 shRNA transduced cells compared to Scrambled shRNA (n = 3). Statistical analysis was performed by Unpaired Student’s t-test. *P < 0.05, **P < 0.01. Representative FACS profiles of cells double stained with CD44-FITC and CD244-PE to analyse the CSC and non-CSC populations are also shown. c Mammospheres morphology and number obtained by self-renewal of cell after HOXC8 knockdown compared to scrambled control vector after 3 generations. Mammospheres numbers were compared by Unpaired Student’s t-test (n = 3). **P < 0.01. Only spheres ≥ 100 μM were counted, images were taken at 10X magnification. d Colonies of HOXC8 shRNA and Scrambled shRNA cells grown in 3D matrigel. Top panels represents 10X magnification, bottom panel represents images at 40X magnification. e Colonies of cells with HOXC8 knockdown compared to scrambled control grown in soft agar for 2 weeks. Top images show the whole well stained with crystal violet, bottom images show a representative field of view at 10X magnification. f The number of soft agar colonies were calculated by counting 10 fields of view. Results were analysed by Unpaired Student’s t-test for each cell line (n = 3). ***P < 0.001
Fig. 8
Fig. 8
HOXC8 downregulation prevents differentiation of MCF10A cells induced by retinoic acid. a Representative FACS profiles and percentage of CD44+/CD24low/-, CD44+/CD24+, CD44/CD24+ cells after retinoic acid (ATRA) treatment for 4 days and HOXC8 knockdown induced by doxycyclin (n = 3). Statistical analysis was performed by One-way ANOVA followed by Bonferroni’s multiple comparisons test. *P < 0.05, **P < 0.01, ***P < 0.001. b Representative FACS profiles and percentage of CD44+/CD24low/-, CD44+/CD24+, CD44/CD24+ cells after retinoic acid (ATRA) treatment for 7 days and HOXC8 knockdown induced by doxycyclin (n = 3). Statistical analysis was performed by One-way ANOVA followed by Bonferroni’s multiple comparisons test. *P < 0.05, **P < 0.01, ***P < 0.001

Similar articles

Cited by

References

    1. Shah M, Allegrucci C. Keeping an open mind: highlights and controversies of the breast cancer stem cell theory. Breast Cancer. 2012;4:155–166. - PMC - PubMed
    1. Valent P, Bonnet D, De Maria R, Lapidot T, Copland M, Melo JV, Chomienne C, Ishikawa F, Schuringa JJ, Stassi G, et al. Cancer stem cell definitions and terminology: the devil is in the details. Nat Rev Cancer. 2012;12:767–775. doi: 10.1038/nrc3368. - DOI - PubMed
    1. Mark M, Rijli FM, Chambon P. Homeobox genes in embryogenesis and pathogenesis. Pediatr Res. 1997;42:421–429. doi: 10.1203/00006450-199710000-00001. - DOI - PubMed
    1. Shah N, Sukumar S. The Hox genes and their roles in oncogenesis. Nat Rev Cancer. 2010;10:361–371. doi: 10.1038/nrc2826. - DOI - PubMed
    1. Atkinson SP, Koch CM, Clelland GK, Willcox S, Fowler JC, Stewart R, Lako M, Dunham I, Armstrong L. Epigenetic marking prepares the human HOXA cluster for activation during differentiation of pluripotent cells. Stem Cells. 2008;26:1174–1185. doi: 10.1634/stemcells.2007-0497. - DOI - PubMed

Publication types