. 2017 Mar 1;25(3):694-704.
doi: 10.1016/j.ymthe.2017.01.012. Epub 2017 Feb 12.

The Efficacy of Cardiac Anti-miR-208a Therapy Is Stress Dependent

Affiliations

The Efficacy of Cardiac Anti-miR-208a Therapy Is Stress Dependent

Joep E C Eding et al. Mol Ther. .

Abstract

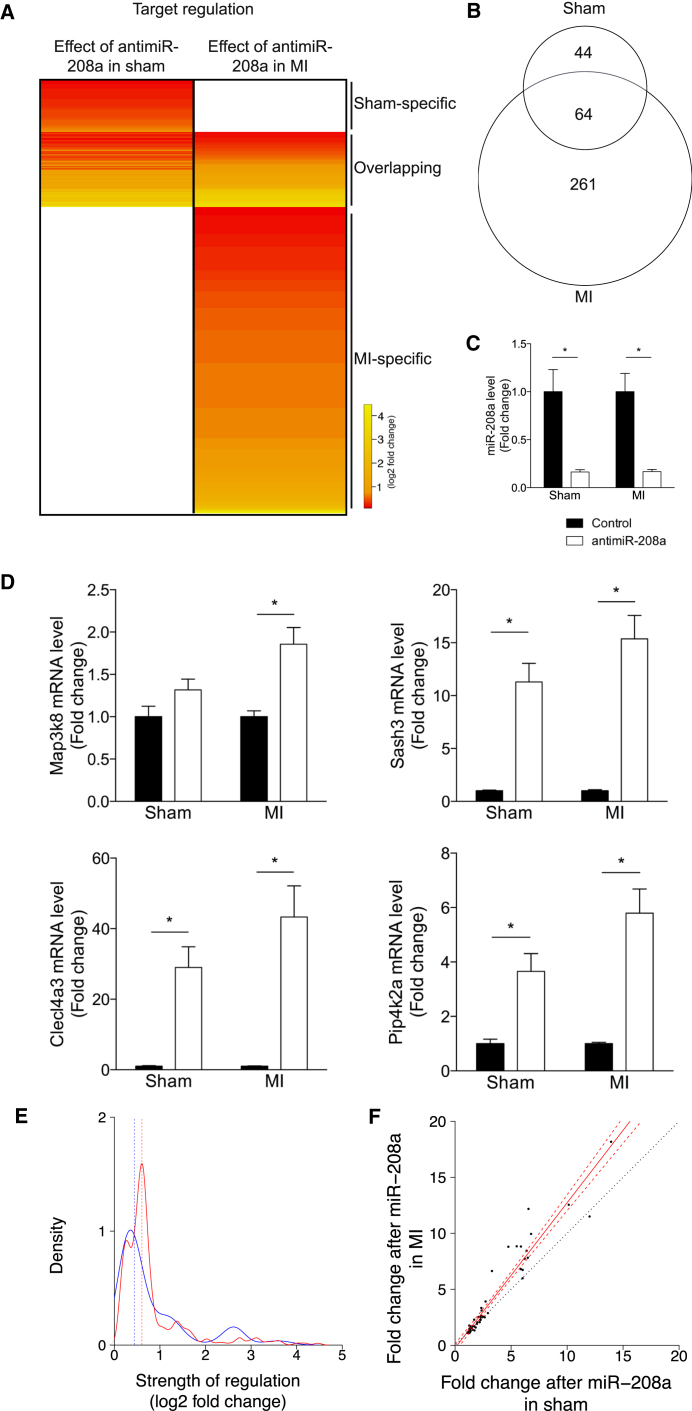
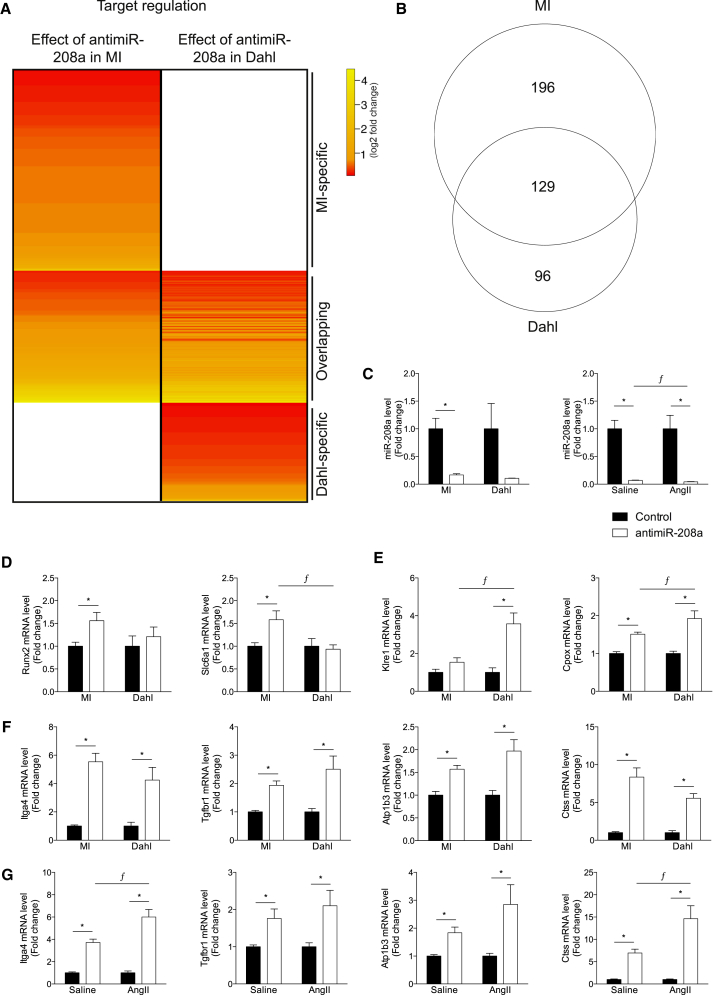
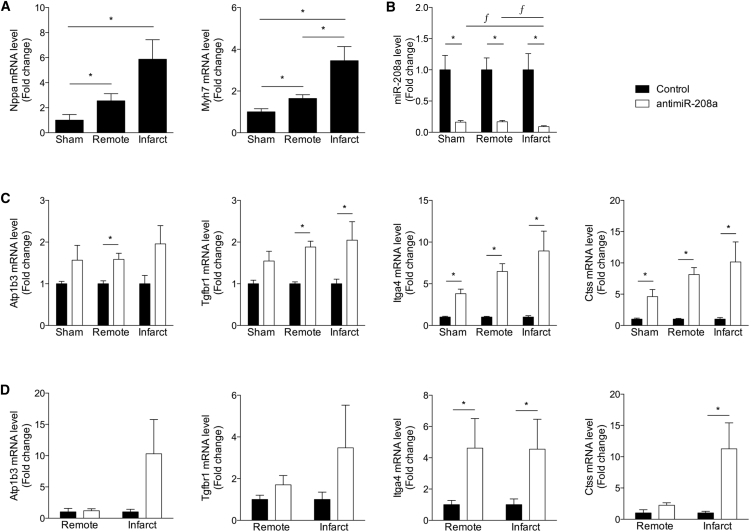
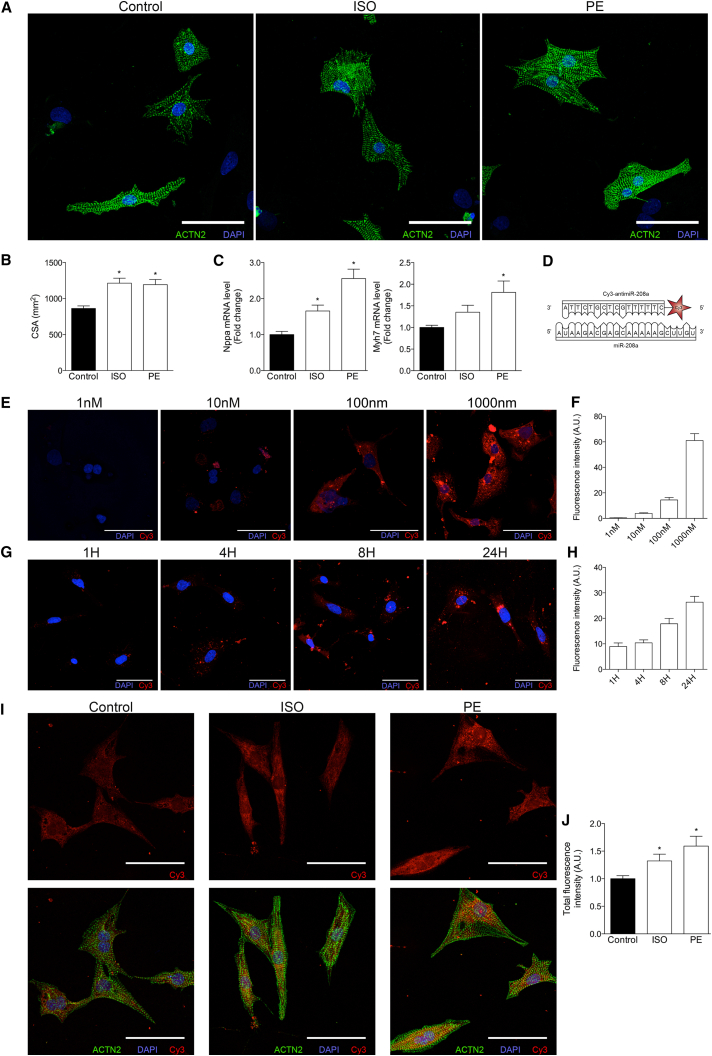
MicroRNAs (miRNAs) are important regulators of biology and disease. Recent animal efficacy studies validate the therapeutic benefit of miRNA modulation and underscore the therapeutic value of miRNA-targeting oligonucleotides. However, whether disease conditions (stress) influence the pharmacological effects of an anti-miR is currently unknown. To study the effect of disease on target regulation after anti-miR treatment, we injected animals with anti-miR-208a, a synthetic oligonucleotide that inhibits the cardiomyocyte-specific miR-208a. Our data indicate that the presence of stress increases the number of regulated miR-208a targets, and that higher stress levels correlate with stronger target derepression. Additionally, the type of stress also influences which targets are regulated upon miR-208a inhibition. Studies in a large animal model indicate a similar stress-dependent anti-miR effect. Subsequent in vitro studies suggest that the influence of stress on anti-miR efficacy depends at least in part on increased cellular anti-miR uptake. These data indicate that the pharmacological effect of anti-miRs is stronger under disease conditions, and that both the type and severity of disease determine the therapeutic outcome. These facts will be important for assessing the therapeutic dose and predicting the therapeutic outcome when applying anti-miRs in a clinical setting.

Keywords: anti-miR; microRNA; target.


Figures

Figure 1
Figure 1
Target Derepression Is More Pronounced under Stress Conditions (A) Gene array analysis of LV tissue of rats that were subjected to sham operation (sham) or myocardial infarction (MI), after which both groups were treated with either control or anti-miR-208a. The heatmap expresses the average log2 fold change in expression for the significantly regulated miR-208a targets in anti-miR-208a-treated rats compared with control rats in either sham or MI rats (n = 4 per group). (B) Venn diagram showing the number of miR-208a targets that are significantly upregulated by anti-miR-208a in either the sham or MI rats. (C) Real-time PCR analysis of miR-208a showing inhibition after anti-miR-208a treatment. (D) Real-time PCR analysis of miR-208a targets shown to be upregulated by gene array after anti-miR-208a treatment in both sham and MI-operated rats. Data are expressed as mean fold change ± SEM and shown as fold change for sham anti-miR-208a (n = 6) over sham control (n = 6), and MI anti-miR-208a (n = 16–17) over MI control (n = 18–19). (E) Kernel density plot of the level of derepression (log2 fold change) of all upregulated targets after anti-miR-208a therapy in sham (blue line) or MI (red line) rats. (F) Fold change in miR-208a targets regulated after anti-miR-208a treatment in both sham rats (x axis) and MI rats (y axis). Solid red line is the linear regression, dashed red lines delineate the 99% confidence interval around the linear regression, and the dotted black line represents the identity line. *p < 0.05 for anti-miR-208a treatment versus control treatment.
Figure 2
Figure 2
Target Derepression Is Dependent on the Type of Stress (A) Gene array analysis of LV tissue of rats that were subjected to myocardial infarction (MI) or Dahl rats on a high-salt diet, after which both groups were treated with either control or anti-miR-208a. The heatmap expresses the log2 fold change in expression for the significantly upregulated miR-208a targets in anti-miR-208a-treated rats compared with control rats in either MI or Dahl. (B) Venn diagram showing the number of miR-208a targets that are significantly upregulated by anti-miR-208a in either the MI or Dahl rats. (C) Real-time PCR analysis of miR-208a showing inhibition after anti-miR-208a treatment. (D) Real-time PCR analysis of miR-208a targets shown to be upregulated by gene array after anti-miR-208a treatment in MI rats, but not in Dahl rats. (E) Real-time PCR analysis of miR-208a targets shown to be upregulated by gene array after anti-miR-208a treatment in Dahl rats, but not in MI rats. (F) Real-time PCR analysis of miR-208a targets shown to be upregulated by gene array after anti-miR-208a treatment in both MI and Dahl rats. (G) Real-time PCR analysis of miR-208a targets in rats infused with angiotensin II (AngII) or vehicle (saline) and treated with anti-miR-208a or control. (D–G) The data are shown as mean fold change ± SEM and expressed as fold change for MI anti-miR-208a (n = 16–17) over MI control (n = 18–19), Dahl anti-miR-208a (n = 6–7) over Dahl control (n = 5–6), saline-infused anti-miR-208a (n = 5–6) over saline-infused control (n = 5–6), or AngII-infused anti-miR-208a (n = 5–6) over AngII-infused control (n = 6). *p < 0.05 for anti-miR-208a treatment versus control treatment, ƒp < 0.05 for anti-miR-208a treatment between models.
Figure 3
Figure 3
Anti-miR Efficacy Depends on the Level of Stress (A–C) Real-time PCR analysis of cardiac stress markers (A), miR-208a levels (B), or miR-208a target genes (C) on LV tissue from sham-operated rats (sham) or different regions of MI-operated rats (remote, infarct) after control or anti-miR-208a treatment. (D) Real-time PCR analysis of miR-208a target genes on LV tissue from different regions of infarcted pig hearts (remote, infarct) after control or anti-miR-208a treatment. Data are shown as mean fold change ± SEM and expressed as fold change for sham anti-miR-208a (n = 6–7) over sham control (n = 5–6), MI remote anti-miR-208a (n = 15–17) over MI remote control (n = 17–19), MI infarct anti-miR-208a (n = 15–17) over MI infarct control (n = 17–19) or pig IR remote anti-miR-208a (n = 3–4) over pig IR remote control (n = 6–7), and pig IR infarct anti-miR-208a (n = 3–4) over pig IR infarct control (n = 5–6). *p < 0.05 for anti-miR-208a treatment versus control treatment; ƒ p < 0.05 for infarct or remote compared to sham.
Figure 4
Figure 4
Stress Influences Cellular Uptake of Anti-miRs in Neonatal Rat Ventricular Myocytes (A) NRVMs stained for ACTN2 after treatment with or without isoproterenol or phenylephrine for 24 hr. (B) Quantification of cross-sectional area (CSA) of NRVMs in the presence or absence of ISO or PE (per condition, five to six biological samples were generated, and per samples, ±22–41 cells were quantified). (C) Real-time PCR analysis of stress marker expression in NRVMs in the presence or absence of ISO or PE (n = 6 per condition). (D) Schematic representation of miR-208a and the Cy3-labeled anti-miR-208a. (E) Fluorescent images of NRVMs treated with increasing doses of Cy3-anti-miR-208a for 24 hr. (F) Quantification of Cy3 signal at different concentrations of anti-miR-208a. (G) Fluorescent images of NRVMs treated with 1 μM Cy3-anti-miR-208a for different time periods. (H) Quantification of Cy3 signal at different time points after 1 μM Cy3-anti-miR-208a. (I) Fluorescent images of NRVMs that were either left untreated or stimulated with ISO or PE for 8 hr, after which they received 1 μM Cy3-anti-miR-208a. (J) Quantification of total fluorescence (fluorescence intensity corrected for cell size, n = 8–12). Data are represented as mean fold change ± SEM. *p < 0.05 for anti-miR-208a treatment versus control treatment. Scale bars represent 50 μM.

References

    1. Bartel D.P. MicroRNAs: target recognition and regulatory functions. Cell. 2009;136:215–233. - PMC - PubMed
    1. van Rooij E., Olson E.N. MicroRNA therapeutics for cardiovascular disease: opportunities and obstacles. Nat. Rev. Drug Discov. 2012;11:860–872. - PMC - PubMed
    1. Krützfeldt J., Rajewsky N., Braich R., Rajeev K.G., Tuschl T., Manoharan M., Stoffel M. Silencing of microRNAs in vivo with ‘antagomirs’. Nature. 2005;438:685–689. - PubMed
    1. van Rooij E., Purcell A.L., Levin A.A. Developing microRNA therapeutics. Circ. Res. 2012;110:496–507. - PubMed
    1. Janssen H.L., Reesink H.W., Lawitz E.J., Zeuzem S., Rodriguez-Torres M., Patel K., van der Meer A.J., Patick A.K., Chen A., Zhou Y. Treatment of HCV infection by targeting microRNA. N. Engl. J. Med. 2013;368:1685–1694. - PubMed

Publication types