. 2017 Mar 6;214(3):719-735.
doi: 10.1084/jem.20161087. Epub 2017 Feb 15.

Fumarate hydratase is a critical metabolic regulator of hematopoietic stem cell functions

Affiliations

Fumarate hydratase is a critical metabolic regulator of hematopoietic stem cell functions

Amelie V Guitart et al. J Exp Med. .

Abstract

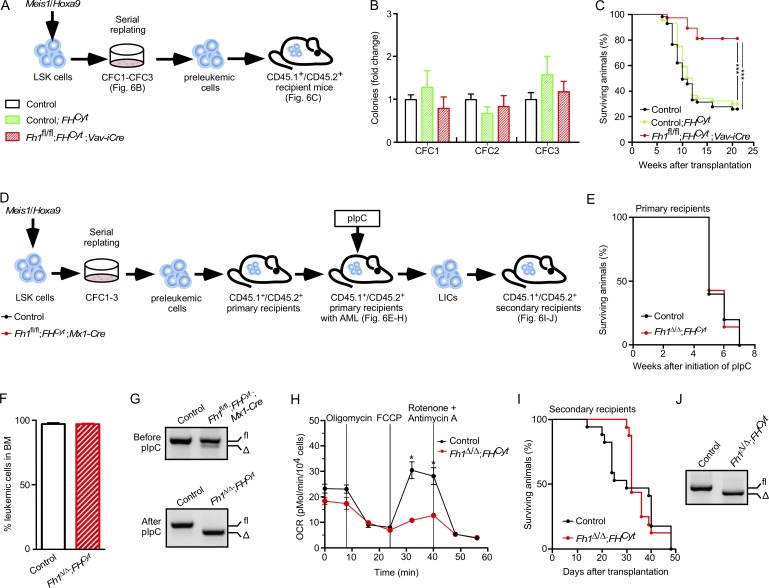
Strict regulation of stem cell metabolism is essential for tissue functions and tumor suppression. In this study, we investigated the role of fumarate hydratase (Fh1), a key component of the mitochondrial tricarboxylic acid (TCA) cycle and cytosolic fumarate metabolism, in normal and leukemic hematopoiesis. Hematopoiesis-specific Fh1 deletion (resulting in endogenous fumarate accumulation and a genetic TCA cycle block reflected by decreased maximal mitochondrial respiration) caused lethal fetal liver hematopoietic defects and hematopoietic stem cell (HSC) failure. Reexpression of extramitochondrial Fh1 (which normalized fumarate levels but not maximal mitochondrial respiration) rescued these phenotypes, indicating the causal role of cellular fumarate accumulation. However, HSCs lacking mitochondrial Fh1 (which had normal fumarate levels but defective maximal mitochondrial respiration) failed to self-renew and displayed lymphoid differentiation defects. In contrast, leukemia-initiating cells lacking mitochondrial Fh1 efficiently propagated Meis1/Hoxa9-driven leukemia. Thus, we identify novel roles for fumarate metabolism in HSC maintenance and hematopoietic differentiation and reveal a differential requirement for mitochondrial Fh1 in normal hematopoiesis and leukemia propagation.


Figures

Figure 1.
Figure 1.
Hematopoiesis-specific Fh1 deletion results in severe hematopoietic defects and loss of HSC activity. (A) Relative levels of Fh1 mRNA (normalized to Actb) in HSCs, multipotent progenitors (MPP), HPC-1 and HPC-2 populations, and LSK and LK cells sorted from 14.5-dpc FLs and BM of C57BL/6 adult (8–10 wk old) mice. n = 3. (B) FLs from 14.5-dpc Fh1fl/fl;Vav-iCre embryos are smaller and paler compared with Fh1+/fl;Vav-iCre and control embryos. (C) The absence of Fh1 transcripts in Fh1fl/fl;Vav-iCre FL CD45+ and c-Kit+ cells. Control, n = 3; Fh1fl/fl;Vav-iCre, n = 6. (D) Western blots for Fh1 and β-actin in FL c-Kit+ cells. (E) Total cellularity (the sum of Lin+ and Lin cell numbers) in 14.5-dpc FLs of the indicated genotypes. Control, n = 17; Fh1+/fl;Vav-iCre, n = 11; Fh1fl/fl;Vav-iCre, n = 9. (F) CFC assay with FL cells. Control, n = 11; Fh1+/fl;Vav-iCre, n = 8; Fh1fl/fl;Vav-iCre, n = 4. (G) Erythropoiesis in 14.5-dpc FLs. Data are arranged from least to most differentiated: Ter119CD71, Ter119CD71+, Ter119+CD71+, and Ter119+CD71. Control, n = 11; Fh1+/fl;Vav-iCre, n = 8; Fh1fl/fl;Vav-iCre, n = 4. (H–J) Total number of LK cells (H), LSK cells (I), and HSCs (J) in 14.5-dpc FLs. Control, n = 17; Fh1+/fl;Vav-iCre, n = 11; Fh1fl/fl;Vav-iCre, n = 9. (K and L) Percentage of donor-derived CD45.2+ cells in PB (K) and total BM and the BM LSK cell compartment (L) of the recipient mice transplanted with 100 FL HSCs. n = 5–8 recipients per genotype. At least three donors were used per genotype. (M) Percentage of CD45.2+ cells in PB after transplantation of 200,000 total FL cells. n = 3–4 recipients per genotype. At least three donors were used per genotype. (N and O) Acute deletion of Fh1 from the adult hematopoietic system. 5 × 10⁵ unfractionated CD45.2+ BM cells from untreated Fh1fl/fl (control), Fh1+/fl;Mx1-Cre, and Fh1fl/fl;Mx1-Cre C57BL/6 (8–10 wk old) mice were mixed with 5 × 10⁵ CD45.1+ WT BM cells and transplanted into lethally irradiated CD45.1+/CD45.2+ recipients. 8 wk after transplantation, the recipients received six doses of pIpC. (N) Percentage of donor-derived CD45.2+ cells in PB. n = 5–10 recipients per genotype. n = 2 donors per genotype. (O) Percentage of CD45.2+ cells in the Lin+, Lin, LK, and LSK cell compartments of the recipient mice 11 wk after pIpC treatment. n = 7–8 recipients per genotype. Data are mean ± SEM. *, P < 0.05; **, P < 0.01; ***, P < 0.001; ****, P < 0.0001 (Mann-Whitney U test).
Figure 2.
Figure 2.
Cytosolic isoform of Fh1 restores normal steady-state hematopoiesis in Fh1fl/fl;Vav-iCre mice. (A) OCR in FL c-Kit+ cells under basal conditions and after the sequential addition of oligomycin, FCCP, and rotenone and antimycin A. Control, n = 5; Fh1fl/fl;Vav-iCre, n = 3; control;FHCyt, n = 10; Fh1fl/fl;FHCyt;Vav-iCre, n = 5. (B) Oxidative phosphorylation–dependent ATP production in galactose (Gal)-treated FL c-Kit+ Fh1fl/fl;Vav-iCre and Fh1fl/fl;FHCyt;Vav-iCre cells. FL c-Kit+ cells were cultured in DMEM supplemented with either 25 mM glucose (Glu) or 25 mM Gal. The graph shows the ratio of ATP produced in the presence of Gal (permissive for oxidative phosphorylation only) to ATP generated in the presence of Glu (permissive for both oxidative phosphorylation and glycolysis). Control, n = 9; Fh1fl/fl;Vav-iCre, n = 9; control;FHCyt, n = 6; Fh1fl/fl;FHCyt;Vav-iCre, n = 10. (C) Relative expression (normalized to Actb) of genes involved in glycolysis in FL c-Kit+ cells. n = 4–5 per genotype. (D) ECAR under basal conditions in 14.5-dpc FL c-Kit+ cells. Control, n = 6; Fh1fl/fl;Vav-iCre, n = 5; control;FHCyt, n = 10; Fh1fl/fl;FHCyt;Vav-iCre, n = 4. (E and F) Fumarate (E) and argininosuccinate (F) levels in FL c-Kit+ cells measured using LC-MS. Control, n = 6; Fh1fl/fl;Vav-iCre, n = 4; control;FHCyt, n = 6; Fh1fl/fl;FHCyt;Vav-iCre, n = 13. (G) 14.5-dpc FL cell extracts were immunoblotted with a polyclonal anti-2SC antibody. α-Tubulin was used as a loading control. Data are representative of two independent experiments. (H) CFU assays performed with BM cells from 8–10-wk-old mice of the indicated genotypes. CFU-red, CFU-erythroid and/or megakaryocyte; CFU-G, CFU-granulocyte; CFU-M, CFU-monocyte/macrophage; CFU-GM, CFU–granulocyte and monocyte/macrophage; CFU-Mix, at least three of the following: granulocyte, erythroid, monocyte/macrophage, and megakaryocyte. n = 3–5 per genotype and are representative of three independent experiments. (I) Total number of BM nucleated cells obtained from two tibias and two femurs of 8–10-wk-old mice. n = 3–4 per genotype. (J–N) Total numbers of CD11b+Gr-1+ myeloid cells (J), CD19+B220+ B cells (K), LK cells (L), LSK cells (M), and HSCs (N) in two tibias and two femurs. n = 3–4 per genotype. Data are mean ± SEM. *, P < 0.05; **, P < 0.01; ***, P < 0.001; ****, P < 0.0001 (Mann-Whitney U test).
Figure 3.
Figure 3.
Mitochondrial Fh1 is essential for HSC self-renewal. (A–C) 100 FL HSCs were transplanted into lethally irradiated 8–10-wk-old C57BL/6 CD45.1+/CD45.2+ recipient mice together with 2 × 10⁵ CD45.1+ syngeneic competitor BM cells. The primary recipients were analyzed 20 wk after transplantation. 2,000 CD45.2+LSK cells were sorted from their BM and transplanted into secondary recipients together with competitor BM cells. Secondary recipients were analyzed 20 wk after transplantation. (A) Percentage of CD45.2+ cells in the Lin+, Lin, LK, LSK, and HSC compartments in the BM of primary recipients. n = 4–5 recipients per donor. (B) Percentage of CD45.2+ cells in the monocyte, neutrophil, B cell, and T cell compartments in the PB of primary recipients. n = 4–5 recipients per donor. Number of donors used in A and B: control, n = 6; Fh1+/fl;Vav-iCre, n = 2; Fh1fl/fl;Vav-iCre, n = 2; control;FHCyt, n = 6; Fh1+/fl;FHCyt;Vav-iCre, n = 3; Fh1fl/fl;FHCyt;Vav-iCre, n = 3. (C) Percentage of CD45.2+ cells in the Lin+, Lin, LK, LSK, and HSC compartments in the BM of the secondary recipients. n = 4–5 recipients per donor. Number of donors: control, n = 3; control;FHCyt, n = 4; Fh1+/fl;FHCyt;Vav-iCre, n = 2; Fh1fl/fl;FHCyt;Vav-iCre, n = 3. Data are mean ± SEM. *, P < 0.05; **, P < 0.01 (Mann-Whitney U test).
Figure 4.
Figure 4.
Molecular consequences of Fh1 deletion in primitive hematopoietic cells. (A) Intracellular ROS in FL c-Kit+ cells. The mean of mean fluorescence intensities ± SEM is shown. Control, n = 6; Fh1fl/fl;Vav-iCre, n = 3. (B and C) GSH species in 14.5-dpc FL c-Kit+ cells measured using LC-MS. Succinic GSH levels (arbitrary units; B) and percentage of Succinic GSH within the total GSH species (C) are shown. Control, n = 6; Fh1fl/fl;Vav-iCre, n = 3. (D and E) Pregnant females were treated with NAC administered 7 d before the embryo harvest. (D) Lin+ cell numbers in 14.5-dpc FLs. Control, n = 15; Fh1fl/fl;Vav-iCre, n = 6; control + NAC, n = 4; Fh1fl/fl;Vav-iCre + NAC, n = 4. (E) 600,000 total FL cells of 14.5-dpc embryos from NAC-treated pregnant females were transplanted into lethally irradiated CD45.1+/CD45.2+ recipient mice together with 200,000 CD45.1+ competitor BM cells. Recipients were continuously treated with NAC. Data represent percentage of donor-derived CD45.2+ cells in PB 3 wk after transplantation. n = 10–11 recipients per genotype. n = 4 donors per genotype. (F) GSEA showing that the Nrf2 signature is not significantly affected in Fh1-deficient (Fh1 KO) FL Linc-Kit+ cells. FDR, false discovery rate; NES, normalized enrichment score. (G) Western blots for Hif-1α and β-actin in c-Kit+ cells from 14.5-dpc FLs. n = 3 per genotype. CoCl2-treated FL c-Kit+ cells were used as a positive control for Hif-1α. Asterisks indicate nonspecific bands. (H) Total FL cellularity and total number of Lin+ cells and HSCs in 14.5-dpc FLs. Fh1fl/fl;Hif-1α+/+, n = 12; Fh1fl/fl;Hif-1α+/+;Vav-iCre, n = 9; Fh1fl/fl;Hif-1αfl/fl, n = 6; Fh1+/fl;Hif-1αfl/fl;Vav-iCre, n = 5; Fh1fl/fl;Hif-1αfl/fl;Vav-iCre, n = 4. (I) Western blot for H3K4me3, H3K9me3, H3K27me3, H3K36me3, and total H3 in 14.5-dpc FL c-Kit+ cells. n = 3 per genotype. (J) Quantification of the data (normalized to total H3) shown in panel I. n = 3 per genotype. (K) Biological processes (presented as –log10 [p-value]) that are enriched in up-regulated and down-regulated genes in Fh1-deficient FL Linc-Kit+ cells versus control cells. Analysis was performed using the Gene Ontology Consortium database. The dashed gray line indicates P = 0.05. (L) Signature enrichment plots from GSEA analyses using unfolded protein response, apoptosis in response to ER stress, and protein translation signature gene sets. (F, K, and L) Gene expression analysis was performed using Linc-Kit+ cells from three Fh1fl/fl (WT) and four Fh1fl/fl;Vav-iCre (Fh1 KO) embryos. Data are mean ± SEM. *, P < 0.05; **, P < 0.01; ***, P < 0.001; ****, P < 0.0001 (Mann-Whitney U test).
Figure 5.
Figure 5.
Fh1 is required for leukemic transformation. (A) 14.5-dpc FL c-Kit+ cells were transduced with Meis1/Hoxa9, MLL-AF9, MLL-ENL, and AML1-ETO9a retroviruses and plated into methylcellulose. (B) Colony counts 6 d after plating are shown. n = 4–5 per genotype. (C) Fh1+/+ and Fh1fl/fl (without Vav-iCre) FL LSK cells were co-transduced with Meis1 and Hoxa9 retroviruses and serially replated. The cells were subsequently infected with a bicistronic lentivirus expressing iCre and a Venus reporter. Venus+ cells were plated into methylcellulose. In parallel, Fh1+/+ and Fh1fl/fl preleukemic cells were transplanted into recipient mice. LICs (CD45.2+c-Kit+ cells) were sorted from the BM of leukemic recipients, transduced with Cre lentivirus, and plated into methylcellulose. (D) Number of colonies generated by Cre-expressing preleukemic cells. n = 3 per genotype. (E) Number of colonies generated by Cre-expressing LICs. n = 3 per genotype. (F) Relative levels of FH mRNA (normalized to ACTB) in untransduced THP-1 cells and THP-1 cells transduced with lentiviruses expressing scrambled shRNA (Scr shRNA) and three different shRNAs targeting FH (FH shRNA1, FH shRNA2, and FH shRNA3). n = 3. (G) Western blot for FH and β-actin in THP-1 cells described in Fig. 5 F. (H) Apoptosis assays performed with THP-1 cells transduced with lentiviruses expressing scrambled shRNA, FH shRNA1, and FH shRNA3. The graph depicts the percentage of annexin V+DAPI cells in early apoptosis and annexin V+DAPI+ in late apoptosis. n = 4. (I) CFC assays with THP-1 cells expressing scrambled shRNA, FH shRNA1, and FH shRNA3. n = 5. Data are mean ± SEM. *, P < 0.05 (Mann-Whitney U test).
Figure 6.
Figure 6.
Mitochondrial Fh1 is necessary for efficient leukemia establishment but is not required for AML propagation. (A) Control, Fh1fl/fl;FHCyt (i.e., Control;FHCyt), and Fh1fl/fl;FHCyt;Vav-iCre FL LSK cells were co-transduced with Meis1 and Hoxa9 retroviruses and serially replated. 100,000 c-Kit+ preleukemic cells were transplanted into sublethally irradiated recipient mice. (B) CFC counts at each replating. Data are mean ± SEM. n = 6–8 per genotype. (C) Kaplan-Meier survival curve of primary recipient mice. n = 8–10 recipients per genotype and 4 donors per genotype. ***, P < 0.001 (log-rank [Mantel-Cox] test). (D) Control and Fh1fl/fl;FHCyt;Mx1-Cre FL LSK cells were co-transduced with Meis1 and Hoxa9 retroviruses and serially replated. The resultant preleukemic cells were transplanted into sublethally irradiated recipients. Once leukemic CD45.2+ cells reached 20% in the PB of recipient mice, the recipients received eight doses of pIpC. 10,000 LICs (CD45.2+c-Kit+) from primary recipients were transplanted into secondary recipients. (E) Kaplan-Meier survival curve of primary recipient mice. pIpC treatment was initiated 5 wk after transplantation. n = 5–7 recipients per genotype. (F) Percentage of CD45.2+ cells in BM of primary recipient mice with terminal leukemia. Data are mean ± SEM. n = 5–7 recipients per genotype. (G) Genomic PCR assessing Fh1 deletion before pIpC (top) and after pIpC (bottom) treatment. Δ, excised allele; fl, undeleted conditional allele. (H) OCR in LICs isolated from the BM of primary recipients treated with pIpC. OCR was assayed as described in Fig 2 A. Data are mean ± SEM. n = 3–5. *, P < 0.05 (Mann-Whitney U test). (I) Kaplan-Meier survival curve of secondary recipients transplanted with LICs sorted from leukemic primary recipients. n = 10 per genotype. (J) Representative gel showing PCR amplification of genomic DNA from the total BM of secondary recipients with terminal leukemia.

References

    1. Adam J., Hatipoglu E., O’Flaherty L., Ternette N., Sahgal N., Lockstone H., Baban D., Nye E., Stamp G.W., Wolhuter K., et al. . 2011. Renal cyst formation in Fh1-deficient mice is independent of the Hif/Phd pathway: roles for fumarate in KEAP1 succination and Nrf2 signaling. Cancer Cell. 20:524–537. 10.1016/j.ccr.2011.09.006 - DOI - PMC - PubMed
    1. Adam J., Yang M., Bauerschmidt C., Kitagawa M., O’Flaherty L., Maheswaran P., Özkan G., Sahgal N., Baban D., Kato K., et al. . 2013. A role for cytosolic fumarate hydratase in urea cycle metabolism and renal neoplasia. Cell Reports. 3:1440–1448. 10.1016/j.celrep.2013.04.006 - DOI - PMC - PubMed
    1. Alderson N.L., Wang Y., Blatnik M., Frizzell N., Walla M.D., Lyons T.J., Alt N., Carson J.A., Nagai R., Thorpe S.R., and Baynes J.W.. 2006. S-(2-Succinyl)cysteine: a novel chemical modification of tissue proteins by a Krebs cycle intermediate. Arch. Biochem. Biophys. 450:1–8. 10.1016/j.abb.2006.03.005 - DOI - PubMed
    1. Andricovich J., Kai Y., Peng W., Foudi A., and Tzatsos A.. 2016. Histone demethylase KDM2B regulates lineage commitment in normal and malignant hematopoiesis. J. Clin. Invest. 126:905–920. 10.1172/JCI84014 - DOI - PMC - PubMed
    1. Ashrafian H., Czibik G., Bellahcene M., Aksentijević D., Smith A.C., Mitchell S.J., Dodd M.S., Kirwan J., Byrne J.J., Ludwig C., et al. . 2012. Fumarate is cardioprotective via activation of the Nrf2 antioxidant pathway. Cell Metab. 15:361–371. 10.1016/j.cmet.2012.01.017 - DOI - PMC - PubMed

Publication types