. 2017 May 1;117(5):1987-2003.
doi: 10.1152/jn.00786.2016. Epub 2017 Feb 15.

Temporal dynamics of retinal and extraretinal signals in the FEFsem during smooth pursuit eye movements

Affiliations

Temporal dynamics of retinal and extraretinal signals in the FEFsem during smooth pursuit eye movements

Leah Bakst et al. J Neurophysiol. .

Abstract

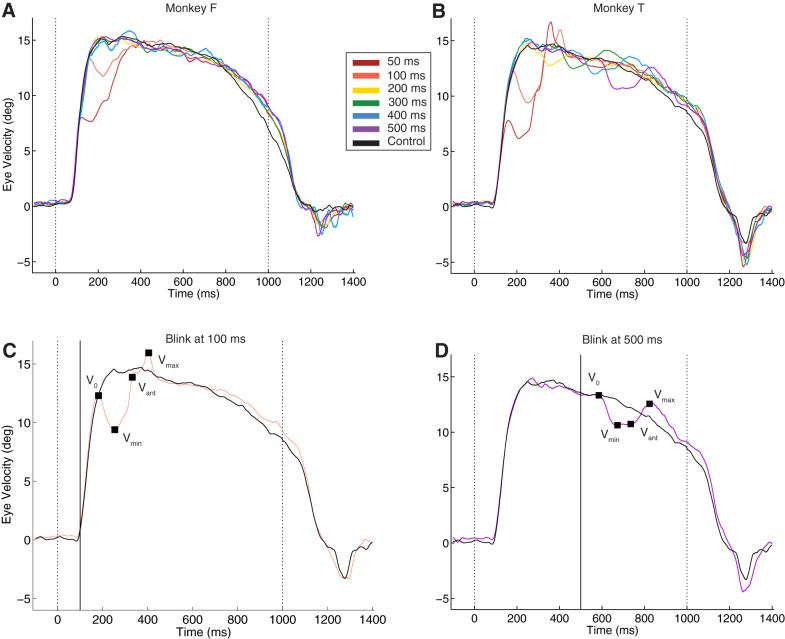
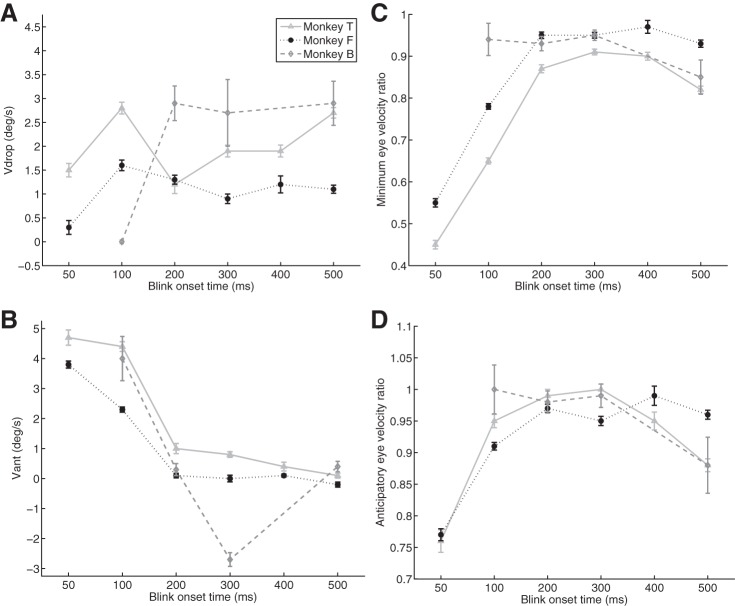
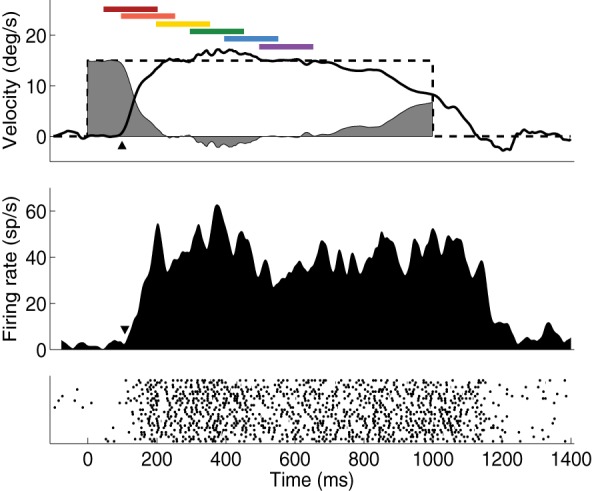
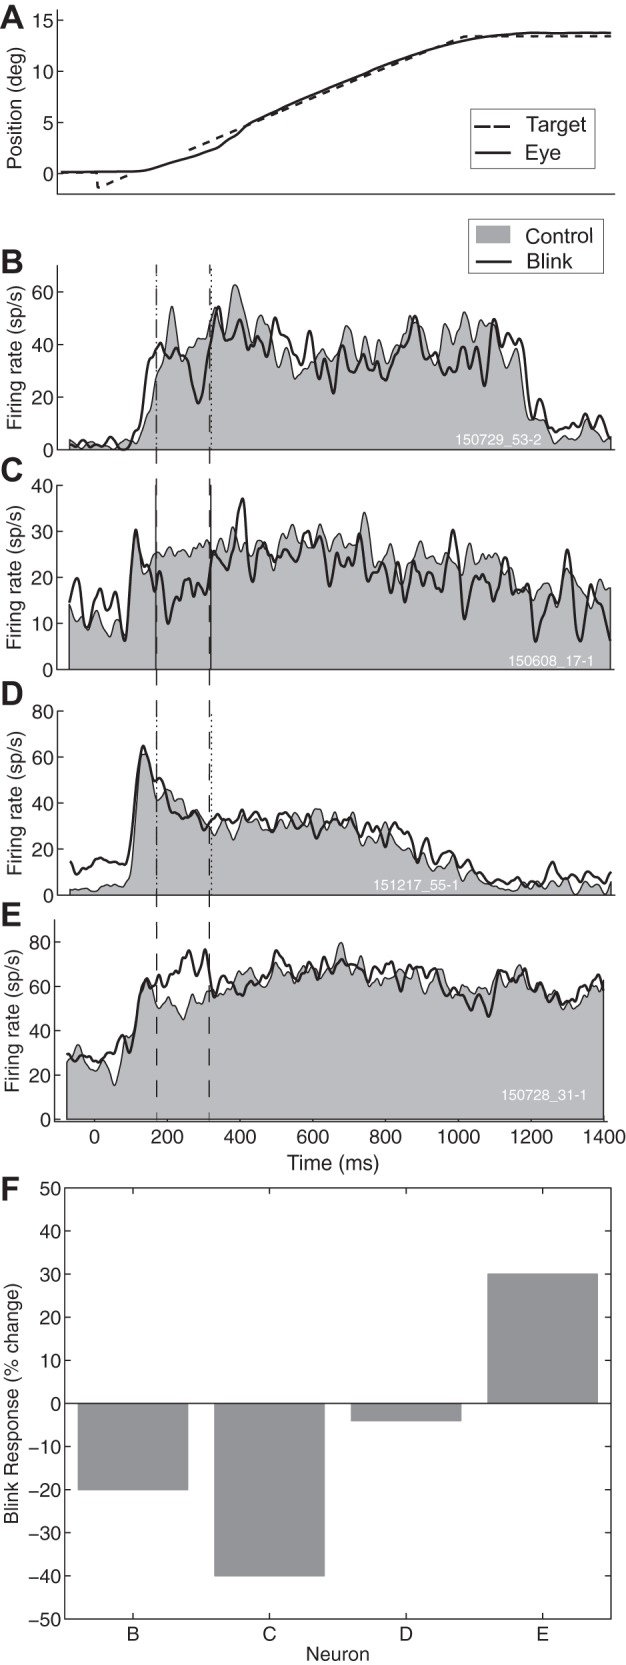
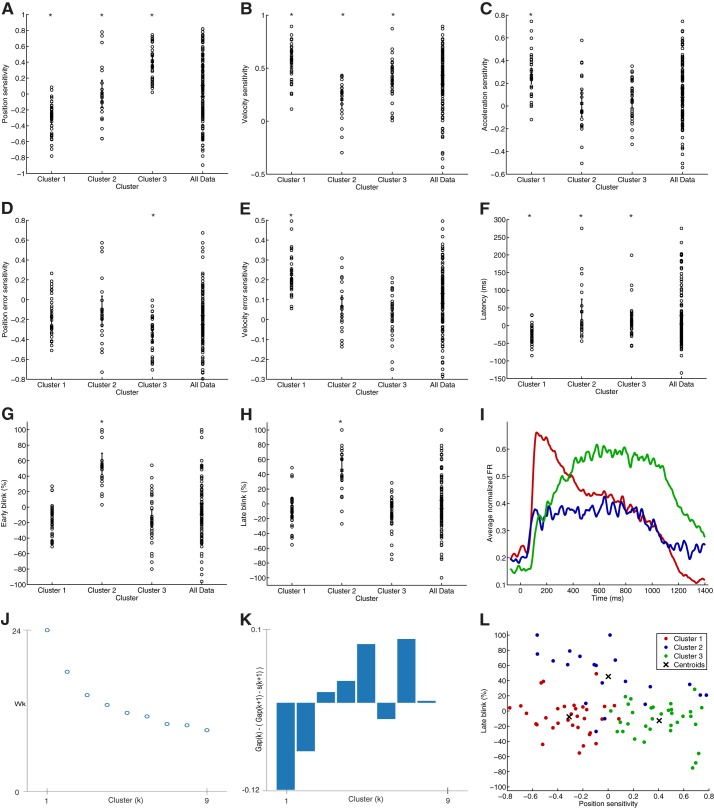
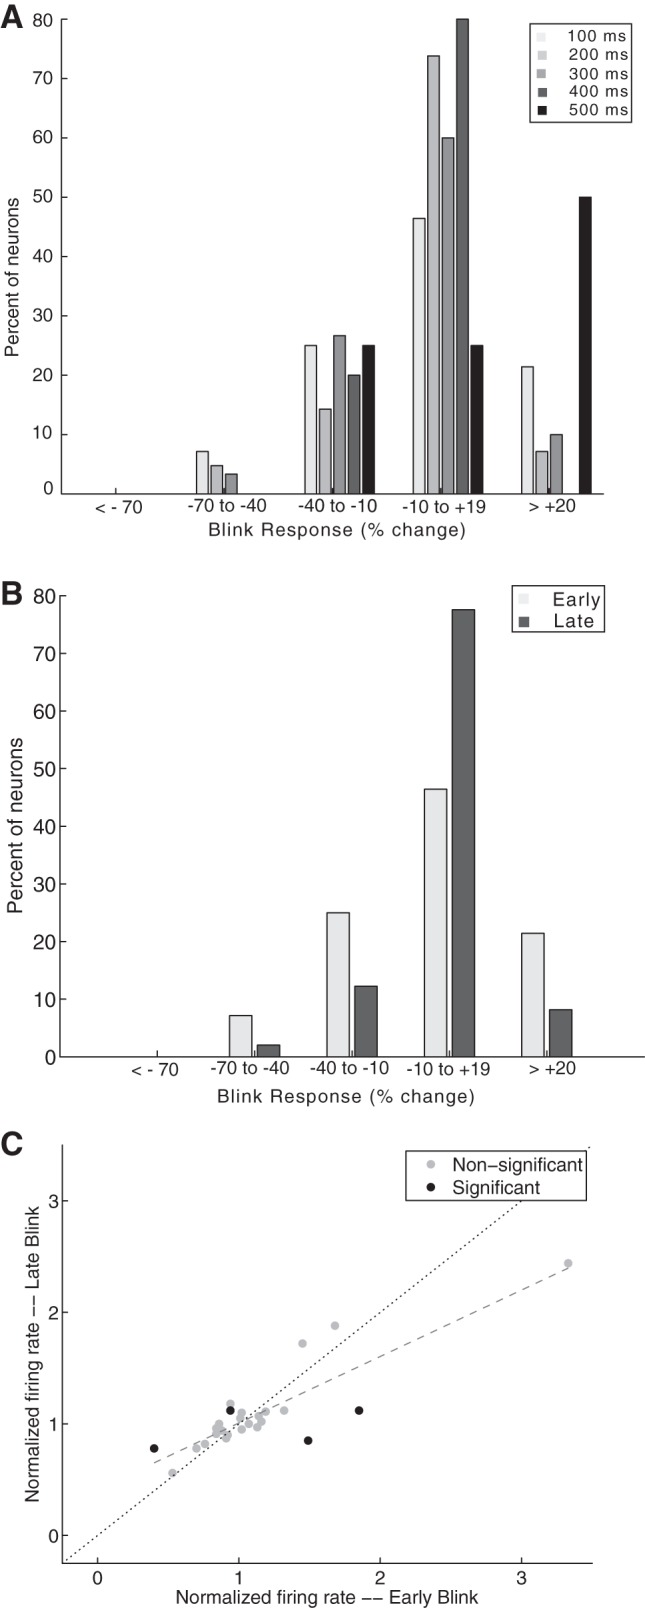
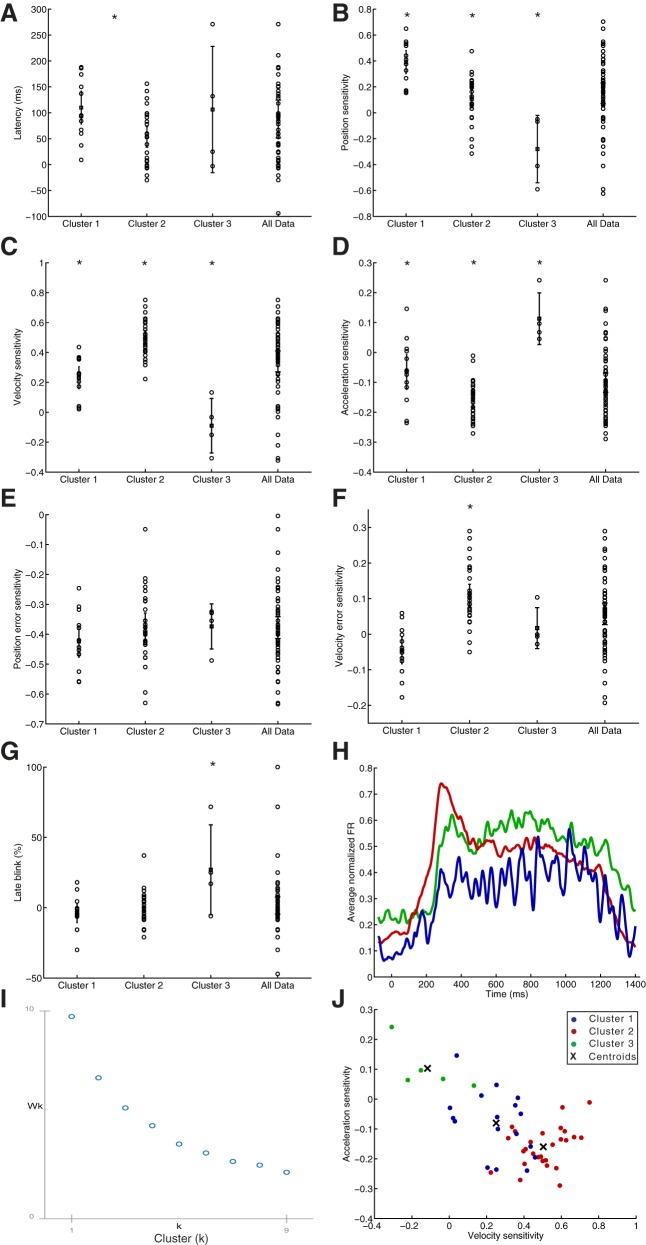
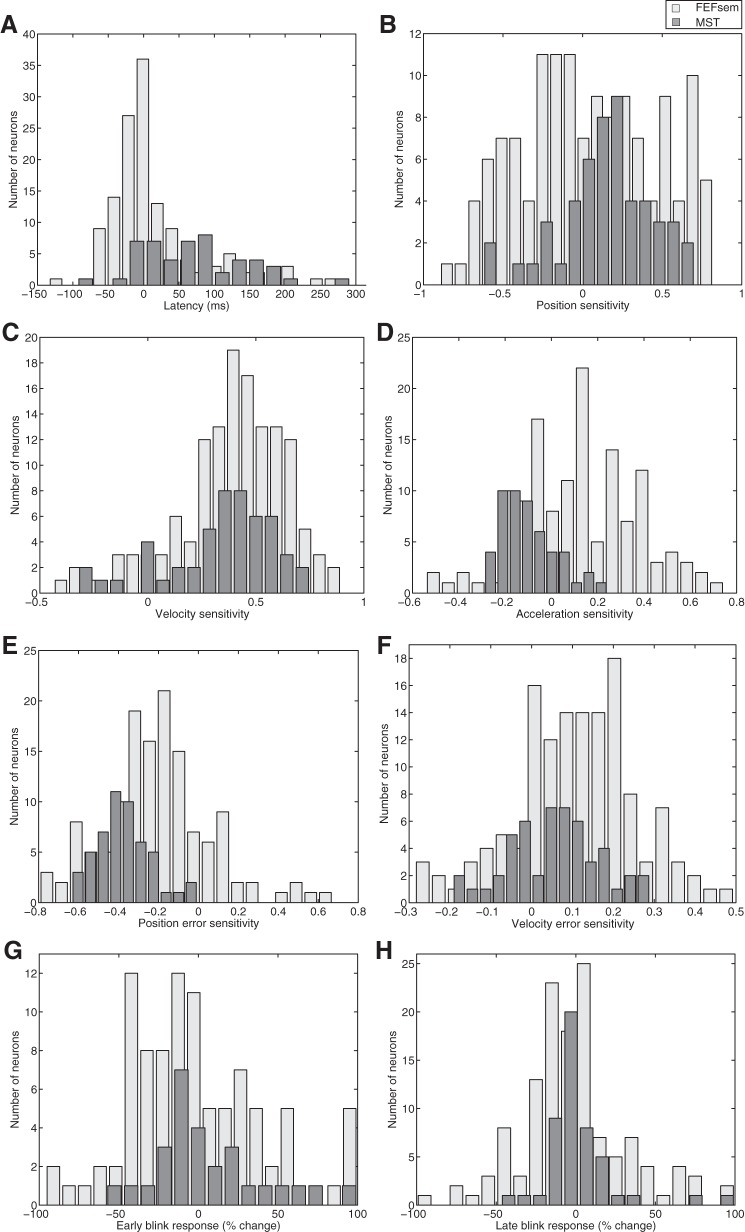
Neurons in the smooth eye movement subregion of the frontal eye field (FEFsem) are known to play an important role in voluntary smooth pursuit eye movements. Underlying this function are projections to parietal and prefrontal visual association areas and subcortical structures, all known to play vital but differing roles in the execution of smooth pursuit. Additionally, the FEFsem has been shown to carry a diverse array of signals (e.g., eye velocity, acceleration, gain control). We hypothesized that distinct subpopulations of FEFsem neurons subserve these diverse functions and projections, and that the relative weights of retinal and extraretinal signals could form the basis for categorization of units. To investigate this, we used a step-ramp tracking task with a target blink to determine the relative contributions of retinal and extraretinal signals in individual FEFsem neurons throughout pursuit. We found that the contributions of retinal and extraretinal signals to neuronal activity and behavior change throughout the time course of pursuit. A clustering algorithm revealed three distinct neuronal subpopulations: cluster 1 was defined by a higher sensitivity to eye velocity, acceleration, and retinal image motion; cluster 2 had greater activity during blinks; and cluster 3 had significantly greater eye position sensitivity. We also performed a comparison with a sample of medial superior temporal neurons to assess similarities and differences between the two areas. Our results indicate the utility of simple tests such as the target blink for parsing the complex and multifaceted roles of cortical areas in behavior.NEW & NOTEWORTHY The frontal eye field (FEF) is known to play a critical role in volitional smooth pursuit, carrying a variety of signals that are distributed throughout the brain. This study used a novel application of a target blink task during step ramp tracking to determine, in combination with a clustering algorithm, the relative contributions of retinal and extraretinal signals to FEF activity and the extent to which these contributions could form the basis for a categorization of neurons.

Keywords: FEF; extraretinal; initiation; smooth pursuit.


Figures

Fig. 1.
Fig. 1.
Behavioral response to target blink. A: average eye movement traces for monkey F. The black trace represents control trials (n = 752) with no target blink, and color traces represent different blink timings (n = 564, 924, 706, 820, 155, and 563, for 50, 100, 200, 300, 400, and 500 ms, respectively). Target motion onset at 0 ms, and offset at 1,000 ms, as indicated by dotted lines. B: average eye movement traces for monkey T, same conventions as in A. Control trials (n = 921), blink trials (n = 603, 884, 591, 810, 363, 641). C: detailed view of the 100-ms average trace from B (red) alongside the control trace (black). Points used for quantification of blink effects indicated by black squares. Target motion onset and offset indicated by dotted lines at 0 and 1,000 ms, blink onset at the solid vertical line. D: same conventions as in C, but for trials with blink at 500 ms.
Fig. 2.
Fig. 2.
Quantification of behavior. A: magnitude of eye velocity drop following target blink (Vdrop), according to time of blink onset. Each line represents behavior from an individual monkey. Monkey B had 0, 364, 211, 345, 0, and 107 trials for the 50, 100, 200, 300, 400, and 500 ms blinks, respectively. Monkey F had 564, 918, 708, 823, 155, and 565 trials. Monkey T had 603, 884, 591, 810, 363, and 641 trials. Error bars are SE. B: same conventions as in A, but for magnitude of anticipatory eye velocity increase (Vant). C: ratio of minimum eye velocity following target blink to control (blink/control). D: ratio of anticipatory eye velocity (blink/control).
Fig. 3.
Fig. 3.
Response of an example FEFsem neuron. Top: target velocity (dashed line), average eye velocity (solid line), and average retinal image motion (shaded region) during step-ramp tracking at 15°/s (n = 28; monkey T). Color bars represent blink timings: 50, 100, 200, 300, 400, 500 ms. Arrowhead indicates the eye movement latency (111 ms after target motion onset). Middle: average spike density function. Arrowhead indicates the neuronal latency (119 ms after target motion onset). Bottom: raster plot.
Fig. 4.
Fig. 4.
Representative examples of blink responses in FEFsem neurons. A: target position (dashed line) and average eye position (solid line; n = 21) during the step-ramp task with target blink. Target was extinguished between 100 and 250 ms after target motion onset, as indicated by the gap in the target trace. BE: each panel shows the average spike density function for control (shaded region) and blink trials (solid line) for example FEFsem neurons. Vertical dashed lines show the time range used for neuronal response quantification. B: control trials n = 28, blink trials n = 21, monkey T (B is same neuron as in Fig. 3). C: control trials n = 52, blink trials n = 17, monkey F. D: control trials n = 25, blink trials n = 32, monkey F. E: control trials n = 26, blink trials n = 27, monkey F. F: quantification of blink response for neurons in BE. Difference in firing rate within the interval is expressed as percent change. Negative numbers indicate firing rates that are lower in blink trials than control.
Fig. 5.
Fig. 5.
Example FEFsem neuronal blink response over time. A, top: behavior during step-ramp trials with blinks at different times. Target velocity during control trials (dashed line) shown alongside eye velocity traces (solid lines) for the various blink times (n = 14, 12, 17, 14, 13, 15, for 50, 100, 200, 300, 400, and 500 ms, respectively). Bottom: average firing rate in control trials (shaded region) compared with the average firing rate during blink trials (colored traces). B: quantified blink response over time. Difference in firing rate within the interval between blink and control is expressed as percent change. Early (50–100 ms) blink responses significantly different than late (300–500 ms) blink responses (P < 0.001). C: change in blink response over time shown across individual trials. Blink time is with respect to eye movement onset. Firing rate plotted on a log2 scale. Each gray point is the blink response in one trial compared with average of all control trials. Means and 95% CI shown superimposed in black, along with best fit line with the equation: normalized FR = 0.0011(blink time) + 0.7436. D: individual trial blink responses (gray points) shown condensed across the early and late categories (n = 26 and 42, respectively), with means and 95% CI shown atop in black.
Fig. 6.
Fig. 6.
Eye velocity and firing rate comparison for an example FEFsem neuron. Data from the same neuron as in Fig. 5. Top: data from control trials. Average of firing rate and eye velocity were taken over intervals of 50 ms on individual trials and normalized by the average during that interval for all control trials. Circles represent data from trials at 15°/s (n = 18), diamonds are data from trials at 7°/s (n = 15), both are compared with the average at 15°/s. The color of the points indicates the time during the step-ramp trial the interval began, as indicated by the color bar. Dotted line represents unity. Both firing rate and eye velocity are plotted on a log2 scale. Bottom: data from blink trials (n = 85). Averages of firing rate and eye velocity over intervals starting 60 ms after blink onset and lasting 150 ms in individual trials were normalized by the average during that interval for all control trials. Color represents timing of the start of the interval.
Fig. 7.
Fig. 7.
Blink responses over time across the FEFsem population. A: distribution of responses from neurons tested at each blink time (colors represent different timings; n = 34, 93, 71, 97, 24, and 52 neurons for 50, 100, 200, 300, 400, and 500 ms, respectively). Blink responses are grouped into 30%-wide bins along the abscissa, and the percentage of neurons in each bin is shown on the ordinate. B: same conventions as in A, but blink times are grouped into early (50–100; n = 93) and late (300–500; n = 130) responses. C: average normalized firing rate in response to early and late blinks for individual neurons. Black points indicate significant differences between early and late responses (n = 41). The dotted line represents unity, and the best linear fit (dashed line) is represented by the equation: late response = 0.338(early response) + 0.683.
Fig. 8.
Fig. 8.
Multiple linear regression modeling for an example FEFsem neuron (same neuron as in Fig. 3). Top: eye and retinal motion component contributions as determined by the model. Bottom: observed spike density function (solid line; n = 28) compared with the best fit from the model (dotted line). The model fit had a CD of 0.77. The equation for the model is: FR(t) = 2.23 + 1.82E(t+8) + 1.83E′(t+8) – 0.03E″(t+8) + 12.60R(t+119) + 1.22R′(t+119).
Fig. 9.
Fig. 9.
K-means clustering results for FEFsem neurons. AH: cluster assignments for each variable: eye position sensitivity (A), eye velocity sensitivity (B), eye acceleration sensitivity (C), position error sensitivity (D), velocity error sensitivity (E), neuronal latency with respect to eye movement onset (F), and early (G) and late (H) blink response. Open circles represent each neuron; black squares indicate means and 95% CI for each cluster. Asterisks indicate clusters that are significantly different. Cluster 1 n = 33; cluster 2 n = 20; cluster 3 n = 33. I: average normalized firing rate for each cluster. J: within-cluster variance (Wk) by number of clusters. K: gap statistic for each number of clusters. The appropriate number of clusters is the smallest number with a positive gap statistic. L: comparison of eye position sensitivity and late blink to show the three distinct clusters. Colors indicate cluster assignment, and black ×’s represent means.
Fig. 10.
Fig. 10.
Blink responses over time across the MST population. Same conventions as Fig. 7. A: distribution of responses from neurons tested at each blink time (n = 28, 42, 30, 5, and 4 for 100, 200, 300, 400, and 500 ms, respectively). B: blink times are grouped into early (50–100 ms; n = 28) and late (300–500 ms; n = 49) responses. C: average normalized firing rate in response to early and late blinks for individual neurons. Black points indicate significant differences between early and late responses (n = 4). The best linear fit (dashed line) is represented by the equation: late response = 0.596 (early response) + 0.412.
Fig. 11.
Fig. 11.
K-means clustering results for MST neurons. AG: cluster assignments for each variable: neuronal latency with respect to eye movement onset (A), eye position sensitivity (B), eye velocity sensitivity (C), eye acceleration sensitivity (D), position error sensitivity (E), velocity error sensitivity (F), and late blink response (G). Same conventions as Fig. 9. Cluster 1 n = 27; cluster 2 n = 17; cluster 3 n = 5. H: average normalized firing rate for each cluster. I: Within-cluster variance (Wk) by number of clusters. J: comparison of eye velocity sensitivity and eye acceleration sensitivity to show the three distinct clusters. Colors indicate cluster assignment, and black ×’s represent means.
Fig. 12.
Fig. 12.
Comparison of FEFsem and MST. AH: histograms of data from FEFsem (light gray) and MST (dark gray). A: neuronal latency with respect to eye movement onset. FEFsem (n = 137) and MST (n = 51) are significantly different (P < 0.001). B: position sensitivity from partial correlation. No significant difference between FEFsem (n = 137) and MST (n = 51; P = 0.08). C: velocity sensitivity. No significant difference between FEFsem (n = 137) and MST (n = 51; P = 0.23). D: acceleration sensitivity. FEFsem (n = 137) and MST (n = 51) are significantly different (P < 0.001). E: position error sensitivity. FEFsem (n = 137) and MST (n = 51) are significantly different (P < 0.001). F: velocity error sensitivity. FEFsem (n = 137) and MST (n = 51) are significantly different (P = 0.03) G: early blink response (percent change from control). No significant difference between FEFsem (n = 94) and MST (n = 28; P = 0.40). H: late blink response. No significant difference between FEFsem (n = 130) and MST (n = 49; P = 0.79).

Similar articles

Cited by

References

    1. Bogadhi AR, Montagnini A, Mamassian P, Perrinet LU, Masson GS. Pursuing motion illusions: a realistic oculomotor framework for Bayesian inference. Vision Res 51: 867–880, 2011. doi:10.1016/j.visres.2010.10.021. - DOI - PubMed
    1. Bogadhi AR, Montagnini A, Masson GS. Dynamic interaction between retinal and extraretinal signals in motion integration for smooth pursuit. J Vis 13: 5, 2013. doi:10.1167/13.13.5. - DOI - PubMed
    1. Brodal P. The cortical projection to the nucleus reticularis tegmenti pontis in the rhesus monkey. Exp Brain Res 38: 19–27, 1980. - PubMed
    1. Churchland AK, Lisberger SG. Discharge properties of MST neurons that project to the frontal pursuit area in macaque monkeys. J Neurophysiol 94: 1084–1090, 2005. doi:10.1152/jn.00196.2005. - DOI - PMC - PubMed
    1. Cui D-M, Yan Y-J, Lynch JC. Pursuit subregion of the frontal eye field projects to the caudate nucleus in monkeys. J Neurophysiol 89: 2678–2684, 2003. doi:10.1152/jn.00501.2002. - DOI - PubMed

Publication types

LinkOut - more resources