

The New Aptima HBV Quant Real-Time TMA Assay Accurately Quantifies Hepatitis B Virus DNA from Genotypes A to F
- PMID: 28202793
- PMCID: PMC5377849
- DOI: 10.1128/JCM.02219-16
The New Aptima HBV Quant Real-Time TMA Assay Accurately Quantifies Hepatitis B Virus DNA from Genotypes A to F
Abstract
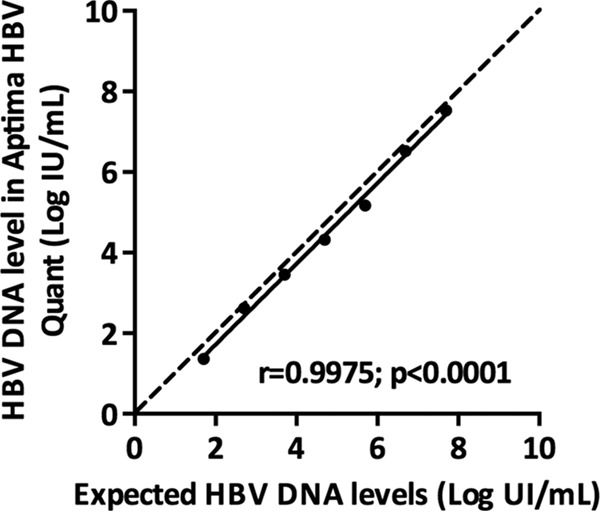
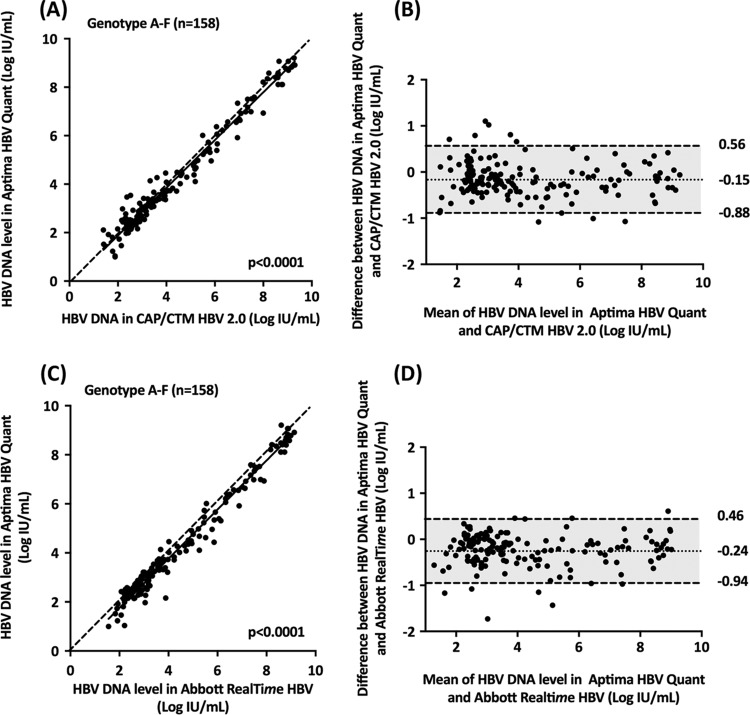
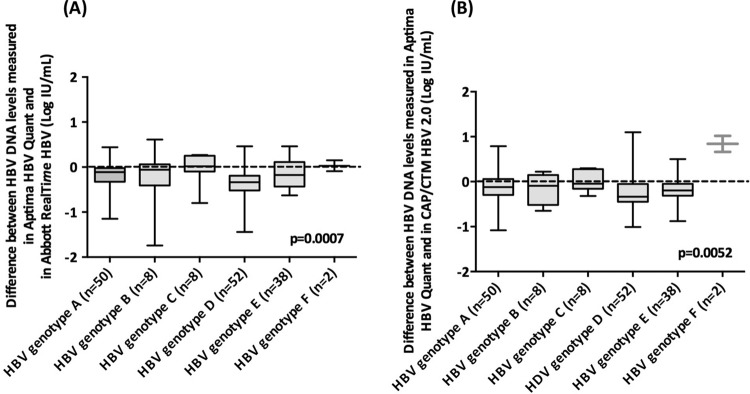
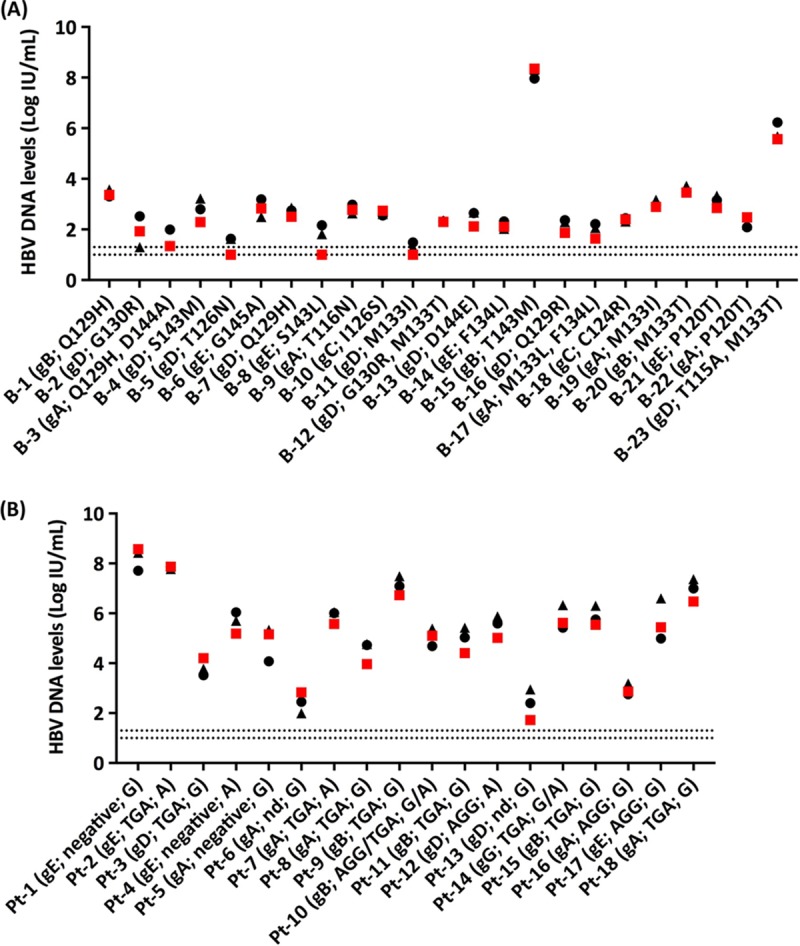
Sensitive and accurate hepatitis B virus (HBV) DNA detection and quantification are essential to diagnose HBV infection, establish the prognosis of HBV-related liver disease, and guide the decision to treat and monitor the virological response to antiviral treatment and the emergence of resistance. Currently available HBV DNA platforms and assays are generally designed for batching multiple specimens within an individual run and require at least one full day of work to complete the analyses. The aim of this study was to evaluate the ability of the newly developed, fully automated, one-step Aptima HBV Quant assay to accurately detect and quantify HBV DNA in a large series of patients infected with different HBV genotypes. The limit of detection of the assay was estimated to be 4.5 IU/ml. The specificity of the assay was 100%. Intra-assay and interassay coefficients of variation ranged from 0.29% to 5.07% and 4.90% to 6.85%, respectively. HBV DNA levels from patients infected with HBV genotypes A to F measured with the Aptima HBV Quant assay strongly correlated with those measured by two commercial real-time PCR comparators (Cobas AmpliPrep/Cobas TaqMan HBV test, version 2.0, and Abbott RealTime HBV test). In conclusion, the Aptima HBV Quant assay is sensitive, specific, and reproducible and accurately quantifies HBV DNA in plasma samples from patients with chronic HBV infections of all genotypes, including patients on antiviral treatment with nucleoside or nucleotide analogues. The Aptima HBV Quant assay can thus confidently be used to detect and quantify HBV DNA in both clinical trials with new anti-HBV drugs and clinical practice.
Keywords: HBV DNA; HBV monitoring; hepatitis B virus; real-time TMA.
Copyright © 2017 American Society for Microbiology.
Figures
Similar articles
-
The New Aptima HCV Quant Dx Real-time TMA Assay Accurately Quantifies Hepatitis C Virus Genotype 1-6 RNA.J Clin Virol. 2017 Jun;91:5-11. doi: 10.1016/j.jcv.2017.03.020. Epub 2017 Mar 29. J Clin Virol. 2017. PMID: 28380393
-
Analytical performance of the Hologic Aptima HBV Quant Assay and the COBAS Ampliprep/COBAS TaqMan HBV test v2.0 for the quantification of HBV DNA in plasma samples.J Clin Virol. 2018 Jul;104:83-88. doi: 10.1016/j.jcv.2018.05.007. Epub 2018 May 18. J Clin Virol. 2018. PMID: 29783147
-
Performance of version 2.0 of the Cobas AmpliPrep/Cobas TaqMan real-time PCR assay for hepatitis B virus DNA quantification.J Clin Microbiol. 2010 Oct;48(10):3641-7. doi: 10.1128/JCM.01306-10. Epub 2010 Aug 18. J Clin Microbiol. 2010. PMID: 20720031 Free PMC article.
-
Evaluation of the Aptima HBV Quant Assay Compared to Abbott RealTime M2000 HBV Quant Assay and Procleix Ultrio Plus dHBV Assay in Plasma Samples.Microbiol Spectr. 2022 Aug 31;10(4):e0176122. doi: 10.1128/spectrum.01761-22. Epub 2022 Jul 26. Microbiol Spectr. 2022. PMID: 35880868 Free PMC article.
-
DETECTION OF VIRAEMIC HBV INFECTION – to guide who to treat or not treat.WHO Guidelines on Hepatitis B and C Testing. Geneva: World Health Organization; 2017 Feb. 9. WHO Guidelines on Hepatitis B and C Testing. Geneva: World Health Organization; 2017 Feb. 9. PMID: 30418715 Free Books & Documents. Review. No abstract available.
Cited by
-
Performance Evaluation of the Aptima Assays in Comparison with the cobas 6800 Assays for the Detection of HIV-1, HBV, and HCV in Clinical Samples.Ann Lab Med. 2022 Jul 1;42(4):447-456. doi: 10.3343/alm.2022.42.4.447. Ann Lab Med. 2022. PMID: 35177565 Free PMC article.
-
Alinity m, a Random-Access System, for Hepatitis B Virus DNA Quantification in Plasma and Whole Blood Collected on Dried Blood Spots.mSphere. 2022 Jun 29;7(3):e0008222. doi: 10.1128/msphere.00082-22. Epub 2022 Apr 28. mSphere. 2022. PMID: 35477312 Free PMC article.
-
The PreS-Based Recombinant Vaccine VVX001 Induces Hepatitis B Virus Neutralizing Antibodies in a Low-Responder to HBsAg-Based HBV Vaccines.Vaccines (Basel). 2024 Sep 30;12(10):1123. doi: 10.3390/vaccines12101123. Vaccines (Basel). 2024. PMID: 39460290 Free PMC article.
-
Rapid quantification assay of hepatitis B virus DNA in human serum and plasma by Fully Automated Genetic Analyzer μTASWako g1.PLoS One. 2023 Feb 9;18(2):e0278143. doi: 10.1371/journal.pone.0278143. eCollection 2023. PLoS One. 2023. PMID: 36758029 Free PMC article.
-
Development of a portable electrochemical loop mediated isothermal amplification (LAMP) device for detection of hepatitis B virus.RSC Adv. 2018 Oct 12;8(61):34954-34959. doi: 10.1039/c8ra07235c. eCollection 2018 Oct 10. RSC Adv. 2018. PMID: 35547082 Free PMC article.
References
-
- GBD. 2013 Mortality and Causes of Death Collaborators. 2015. Global, regional, and national age-sex specific all-cause and cause-specific mortality for 240 causes of death, 1990–2013: a systematic analysis for the Global Burden of Disease Study 2013. Lancet 385:117–171. doi:10.1016/S0140-6736(14)61682-2. - DOI - PMC - PubMed
-
- Fitzmaurice C, Dicker D, Pain A, Hamavid H, Moradi-Lakeh M, MacIntyre MF, Allen C, Hansen G, Woodbrook R, Wolfe C, Hamadeh RR, Moore A, Werdecker A, Gessner BD, Te Ao B, McMahon B, Karimkhani C, Yu C, Cooke GS, Schwebel DC, Carpenter DO, Pereira DM, Nash D, Kazi DS, De Leo D, Plass D, Ukwaja KN, Thurston GD, Yun Jin K, Simard EP, Mills E, Park EK, Catala-Lopez F, deVeber G, Gotay C, Khan G, Hosgood HD III, Santos IS, Leasher JL, Singh J, Leigh J, Jonas JB, Sanabria J, Beardsley J, Jacobsen KH, Takahashi K, Franklin RC, Ronfani L, Montico M, Naldi L, et al. . 2015. The global burden of cancer 2013. JAMA Oncol 1:505–527. doi:10.1001/jamaoncol.2015.0735. - DOI - PMC - PubMed
Publication types
MeSH terms
Substances
LinkOut - more resources
Full Text Sources
Other Literature Sources
