

Three-dimensional trajectories and network analyses of group behaviour within chimney swift flocks during approaches to the roost
- PMID: 28202812
- PMCID: PMC5326531
- DOI: 10.1098/rspb.2016.2602
Three-dimensional trajectories and network analyses of group behaviour within chimney swift flocks during approaches to the roost
Abstract
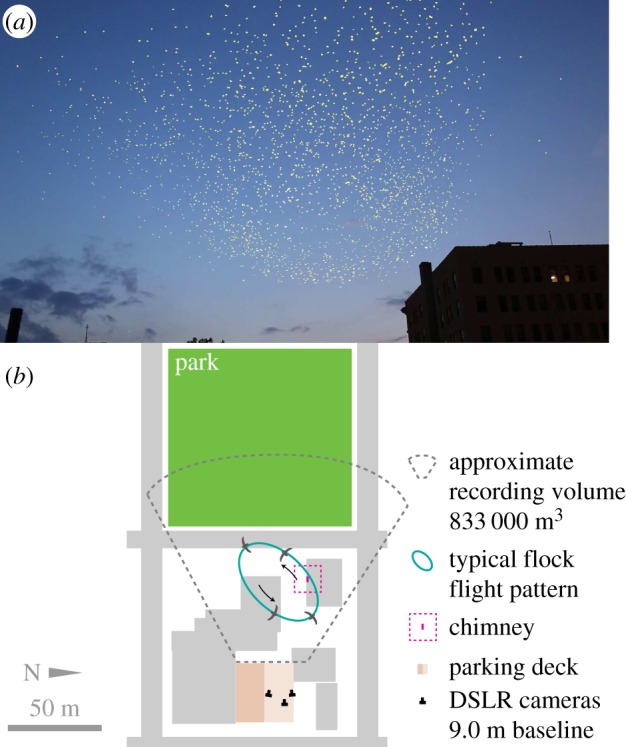
Chimney swifts (Chaetura pelagica) are highly manoeuvrable birds notable for roosting overnight in chimneys, in groups of hundreds or thousands of birds, before and during their autumn migration. At dusk, birds gather in large numbers from surrounding areas near a roost site. The whole flock then employs an orderly, but dynamic, circling approach pattern before rapidly entering a small aperture en masse We recorded the three-dimensional trajectories of ≈1 800 individual birds during a 30 min period encompassing flock formation, circling, and landing, and used these trajectories to test several hypotheses relating to flock or group behaviour. Specifically, we investigated whether the swifts use local interaction rules based on topological distance (e.g. the n nearest neighbours, regardless of their distance) rather than physical distance (e.g. neighbours within x m, regardless of number) to guide interactions, whether the chimney entry zone is more or less cooperative than the surrounding flock, and whether the characteristic subgroup size is constant or varies with flock density. We found that the swift flock is structured around local rules based on physical distance, that subgroup size increases with density, and that there exist regions of the flock that are less cooperative than others, in particular the chimney entry zone.
Keywords: aggregation; chimney swift; flight biomechanics; flocking; network; swarming.
© 2017 The Authors.
Figures
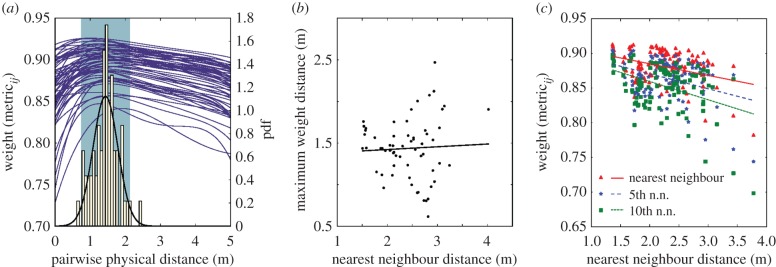
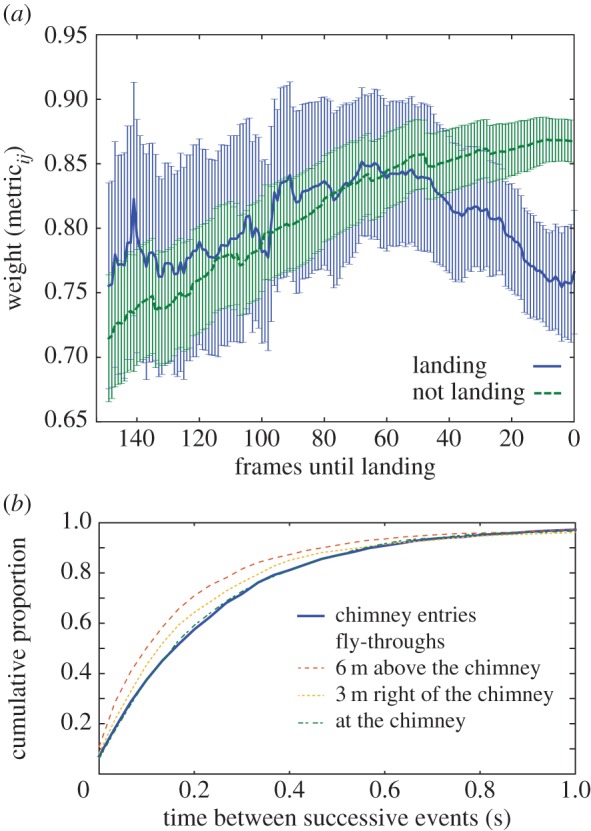
 wingspan; normality was confirmed with an Anderson–Darling test (test statistic 0.313587, p > 0.15, null hypothesis of normality). The shaded region is the 95% CI for the mean. (b) The maximum weight pairwise distance did not vary with mean nearest neighbour distance (R2 = 0.002315, p = 0.710362). However, as shown by the trend lines in (c), the average weight of the nth neighbour decreased with increases in nearest neighbour distance, (R = −0.353969, −0.378956, −0.394210 for the nearest, 5th nearest, and 10th nearest neighbours, respectively; p = 0.000112, 3.21440 ×10⁻⁵, and 1.42674 ×10⁻⁵). As expected, average weight also declined with neighbour index. Data in (c) were computed from 114 samples of 100 consecutive frames across the full dataset.
 (null hypothesis of normality).
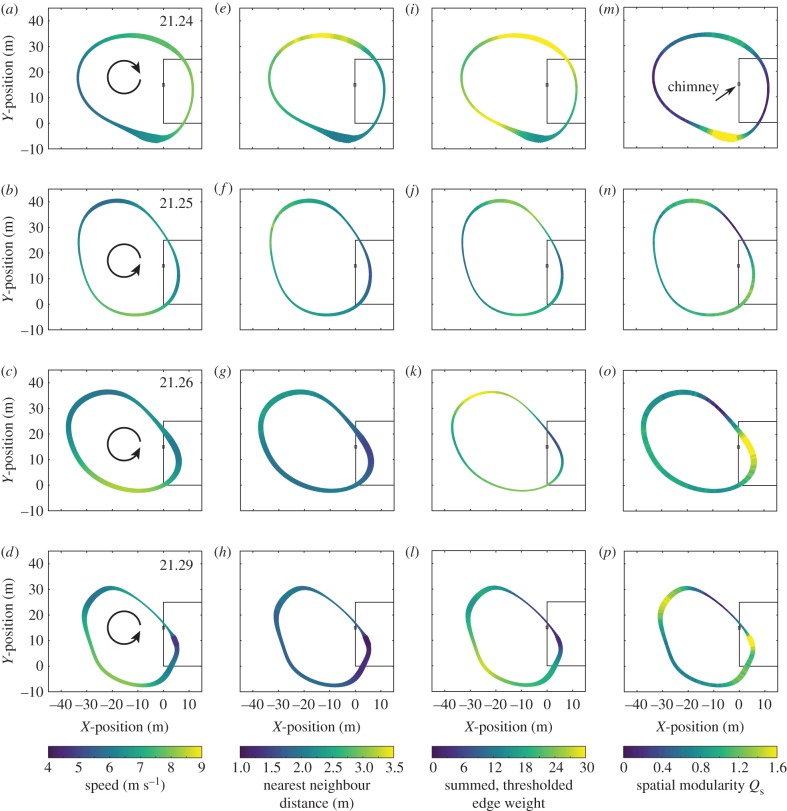
References
-
- Cucker F, Smale S. 2007. Emergent behavior in flocks. IEEE Trans. Autom. Control 52, 852–862. (10.1109/TAC.2007.895842) - DOI
MeSH terms
Associated data
LinkOut - more resources
Full Text Sources
Other Literature Sources
Research Materials
