. 2017 Feb 15;542(7641):348-351.
doi: 10.1038/nature21369.

Early brain development in infants at high risk for autism spectrum disorder

Collaborators, Affiliations

Early brain development in infants at high risk for autism spectrum disorder

Heather Cody Hazlett et al. Nature. .

Abstract

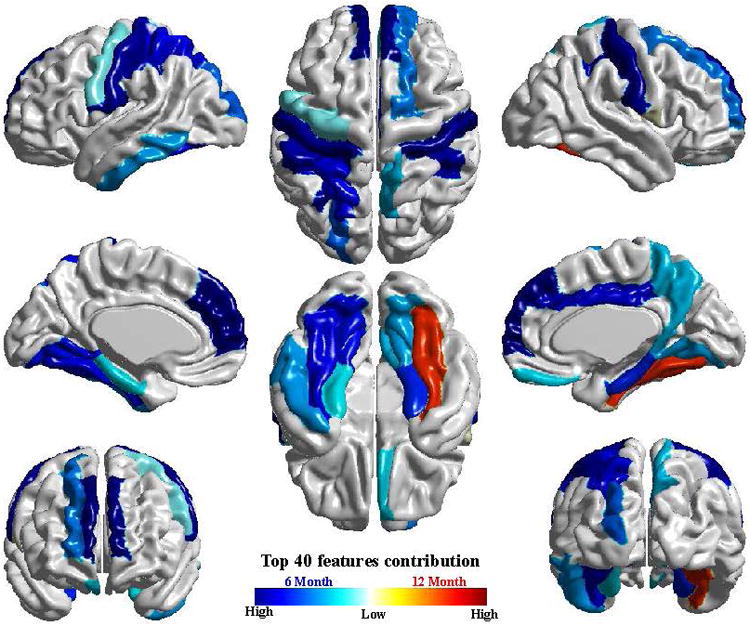
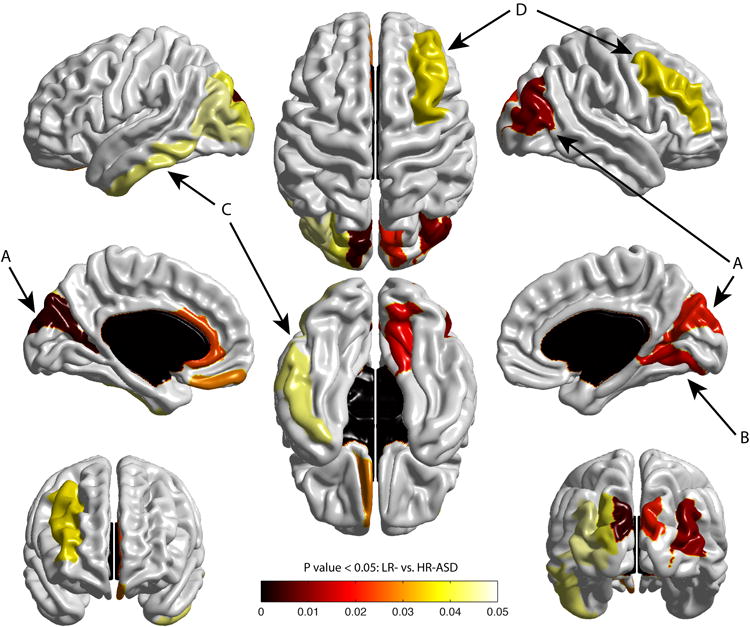
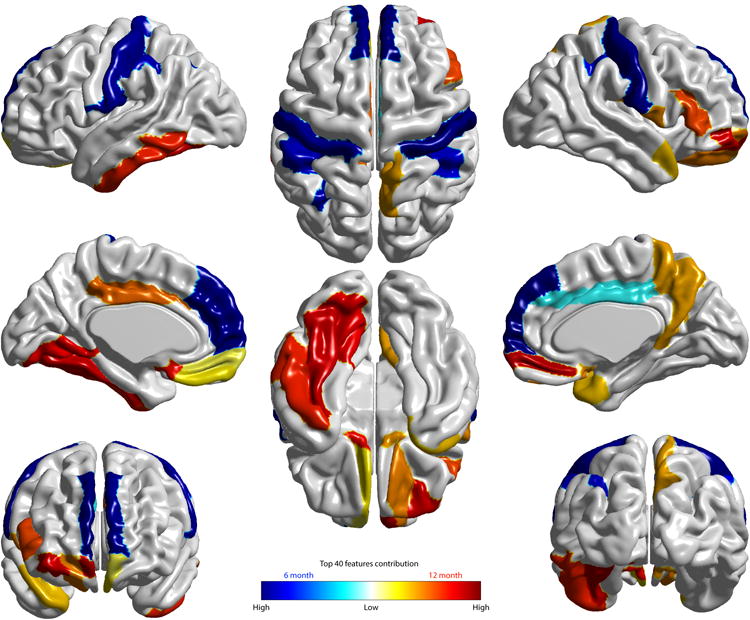
Brain enlargement has been observed in children with autism spectrum disorder (ASD), but the timing of this phenomenon, and the relationship between ASD and the appearance of behavioural symptoms, are unknown. Retrospective head circumference and longitudinal brain volume studies of two-year olds followed up at four years of age have provided evidence that increased brain volume may emerge early in development. Studies of infants at high familial risk of autism can provide insight into the early development of autism and have shown that characteristic social deficits in ASD emerge during the latter part of the first and in the second year of life. These observations suggest that prospective brain-imaging studies of infants at high familial risk of ASD might identify early postnatal changes in brain volume that occur before an ASD diagnosis. In this prospective neuroimaging study of 106 infants at high familial risk of ASD and 42 low-risk infants, we show that hyperexpansion of the cortical surface area between 6 and 12 months of age precedes brain volume overgrowth observed between 12 and 24 months in 15 high-risk infants who were diagnosed with autism at 24 months. Brain volume overgrowth was linked to the emergence and severity of autistic social deficits. A deep-learning algorithm that primarily uses surface area information from magnetic resonance imaging of the brain of 6-12-month-old individuals predicted the diagnosis of autism in individual high-risk children at 24 months (with a positive predictive value of 81% and a sensitivity of 88%). These findings demonstrate that early brain changes occur during the period in which autistic behaviours are first emerging.


Figures

Extended Data Figure 1
Extended Data Figure 1. Visualization of cortical regions with surface area measures among the top 40 features contributing to the linear sparse learning classification
The cortical features produced by the deep learning approach (Main Text, Figure 3) are highly consistent with those observed using an alternative approach (linear sparse learning) shown here. Results from this alternative approach are included for comparison in the Supplementary Information (Supplementary Information, Tables 2 and 3).
Extended Data Figure 2
Extended Data Figure 2. Trajectories of TBV for males (left) and females (right)
For illustrative purposes, we provide plots for Total Brain Volume (TBV) for males and females from the same sample. Figure 1 shows the longitudinal trajectories of total brain volume (TBV) from 6 to 24 months for the three groups examined, with males and females displayed separately. The trajectory of TBV for males only among the three groups is similar to the pattern we see in the full sample (Main Text, Figure 1). The female only HR-ASD group is quite small (n=2) which makes the pattern of trajectory difficult to interpret. These figures support the general similarity of the findings in the combined sample and the male-only sample. Key: red = HR-ASD, green = HR-neg, blue = LR. Total brain volume (TBV) shown in mm3. Length_age refers to the age corrected by length (body size).
Figure 1
Figure 1. Longitudinal trajectories of total brain volume (TBV), surface area (SA) and cortical thickness (CT) from 6 to 24 months
Figure 1 shows the longitudinal trajectories of total brain volume (TBV), cortical thickness (CT), and surface areas from 6 to 24 months for the three groups examined. Only individuals with complete longitudinal imaging (6, 12, and 24 months) were included in the analysis (HR-ASD, n=15; HR-neg, n=91; LR, n=42). Group trajectories were estimated from the random coefficient piece-wise linear model (see Methods). The HR-ASD group showed a significantly increased SA growth rate in the first year of life (from 6 to 12 months) compared to both the HR-neg (t (289) =2.01, p=0.04) and LR groups (t (289) = 2.50, p=0.01). There were no significant group differences in SA growth rates in the second year (Extended Data, Table 2). Pairwise comparisons of SA measured at 12 months of age showed medium to large effect sizes for HR-ASD vs LR (Cohen's d = 0.74) and HR-ASD vs HR-neg (Cohen's d = 0.41), becoming more robust by 24 months with HR-ASD vs LR (Cohen's d = 0.88) and HR-ASD vs HR-neg (Cohen's d = 0.70). There were no significant group differences in trajectories for cortical thickness (CT), with all groups showing a pattern of decreasing CT over time. No group differences were observed in trajectory of CT growth in either the first (F (2,289) = 0.00; p =0.99) or second year (F (2,289) = 1.44; p=0.24). Key: red = HR-ASD, green = HR-neg, blue = LR. TBV = total brain volume in mm3, Length_age refers to the age corrected by length (body size), SSAll = total surface area, CTAll = total cortical thickness. Surface area shown in mm2, Cortical thickness in mm.
Figure 2
Figure 2. Cortical regions showing significant expansion in surface area from 6-12 months in HR-ASD
Figure 2 displays the map of significant group differences in surface area from 6 to 12 months. Exploratory analyses were conducted with a 78 region of interest surface map (see Supplementary Information), using an adaptive Hochberg method of p <0.05. The colored areas show the group effect for the HR-ASD versus LR subjects. Compared to the LR group, the HR-ASD group had significant expansion in cortical surface area in the left/right middle occipital gyrus and right cuneus (A), right lingual gyrus (B), and to a lesser extent the left inferior temporal gyrus (C), and middle frontal gyrus (D). HR-ASD, n = 34; LR, n = 84.
Figure 3
Figure 3. Visualization of cortical regions with surface area measures among the top 40 features contributing to the deep learning (DL) dimensionality reduction
The cortical regions whose surface area measures are among these top 40 features obtained from the non-linear deep learning (DL) approach are visualized. The top 10 DL features observed include: surface area at 6 months in the right and left superior frontal gyrus, post-central gyrus, and inferior parietal gyri, and ICV at 6 months. These features produced by the DL approach are highly consistent with those observed using an alternative approach (linear sparse learning) (Extended Data, Figure 1). Two tables listing the top 40 features from the DL approach and sparse learning are provided in Supplementary Information (Tables 2 and 3).

Similar articles

Cited by

References

    1. Hazlett HC, et al. Magnetic resonance imaging and head circumference study of brain size in autism: birth through age 2 years. Arch Gen Psychiatry. 2005;62(12):1366–1376. - PubMed
    1. Hazlett HC, et al. Early brain overgrowth in autism associated with an increase in cortical surface area before age 2 years. Arch Gen Psychiatry. 2011;68(5):467–476. - PMC - PubMed
    1. Ozonoff S, et al. A prospective study of the emergence of early behavioral signs of autism. J Am Acad Child Adolesc Psychiatry. 2010;49(3):256–266. - PMC - PubMed
    1. Zwaigenbaum L, et al. Behavioral manifestations of autism in the first year of life. Int J Dev Neurosci. 2005;23(2-3):143–152. - PubMed
    1. Piven J, et al. An MRI study of brain size in autism. Am J Pyschiatry. 1995;152(8):1145–1149. - PubMed

References (Methods)

    1. Hazlett HC, et al. Brain volume findings in 6-month-old infants at high familial risk for autism. Am J Psychiatry. 2012;169:601–608. - PMC - PubMed
    1. Lord C, Rutter M, LeCouteur A. Autism Diagnostic Interview-Revised: a revised version of a diagnostic interview for caregivers of individuals with possible pervasive developmental disorders. J Autism Dev Disord. 1994;24:659–685. - PubMed
    1. Mullen EM. Mullen Scales of Early Learning (AGS ed) Circle Pines, MN: American Guidance Service, Inc; 1995.
    1. Sparrow S, Balla D, Cicchetti D. Vineland scales of adaptive behavior: A survey form manual. Circle Pines, MN: American Guidance Service, Inc; 1984.
    1. American Psychiatric Association. Diagnostic and statistical manual of mental disorders. 4th. Washington, D.C: 2000. text rev.

Publication types